Winter

More Like Virginia: February 2020 and Winter 2019/20 Recaps

March 3, 2020 - 10:57pm -- Dave Robinson

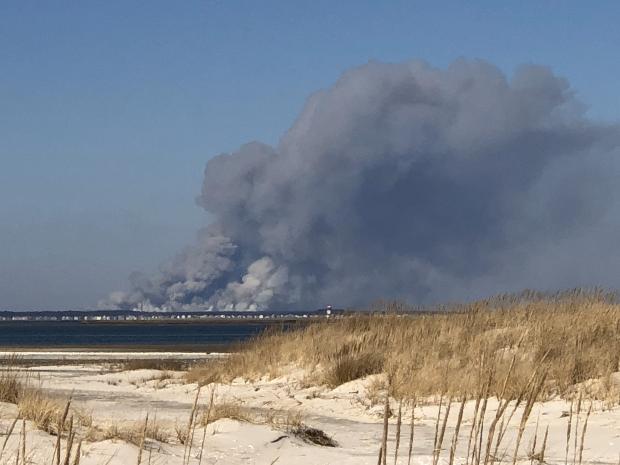
Controlled burn smoke photo

Following on the heels of the 8th mildest January on record, February 2020 entered the books as the 3rd mildest since records began in 1895. The 39.2° average was 5.7° above the 1981–2010 mean. The northern climate division of the state averaged 36.2° (+5.2°; 6th mildest), the south was 41.0° (+6.1°; 3rd mildest), and the coastal division was 41.2° (+5.7°; 3rd mildest). Average minimum temperatures ranked 2nd mildest for the state, while average maximums ranked 8th mildest. To place February 2020 in some perspective, it was just 1.6° below the 1981–2010 March average of 40.8° and only 0.2° below the longer 1895–2019 March average. It was close to the long-term (1981–2010) average February temperatures in Washington, DC, Paducah, KY, and Bristol, TN.

February precipitation (rain and melted snow) came in very close to the 1981–2010 average at 2.82”. This is just 0.02” above average and ranks as the 62nd driest (and 65th wettest) of the past 126 years. Divisional totals ranged from 2.48” (-0.34”, 49th driest) in the north, 2.99” (+0.21”, 60th wettest) in the south, and 3.37” (+0.48”, 51st wettest) at the coast.
Where is Winter?: January 2020 Recap

February 4, 2020 - 2:01pm -- Dave Robinson

Boardwalk photo

The new decade got off on a rather unwintry note, with January temperatures well above average, snow rarely falling, and just one significant storm that brought only rain. The statewide average temperature of 37.3° was 6.6° above the 1981–2010 mean. This ranks as the 8th mildest January (tied with 1933) since records commenced in 1895. Anomalies and rankings were quite similar across the state. January 2020 was milder than December 2019 by 1.0°. The last time this climatological flip occurred was in December 2005/January 2006. Most notably, January 11th and 12th saw record daily temperatures in the upper 60°s to as high as 70°.

Precipitation fell mostly in the form of rain and mainly on the 25th. The monthly average across NJ was 2.38”. This is 1.02” below the mean and ranks as the 26th driest. The north was 1.27” below average, the south -0.84”, and the coast -1.12”, with all divisional totals between 2.14”–2.55”.

A Little Bit of This and a Little Bit of That: February and Winter 2019 Recaps

March 5, 2019 - 8:23pm -- Dave Robinson

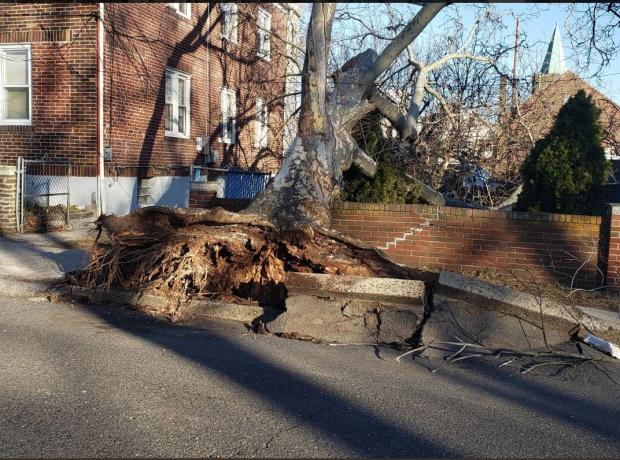
Tree felled by wind

The second month of 2019 across New Jersey was not one that will leave an indelible mark in the memory bank. Unlike some of the wild conditions that afflicted many other parts of the nation, NJ precipitation events were only minor to moderate, and there was nothing in the way of stream and river flooding. On several occasions, cold and warmth came and went rather quickly. There were no coastal storms, thus no significant tidal flooding or beach erosion. While there was one notable wind event, overall, rather calm conditions prevailed.

The statewide average precipitation (rain and melted snow) was 3.27”. This is 0.47” above the 1981–2010 average and ranks as the 47th wettest February since 1895. The statewide average temperature of 34.8° was 1.3° above average, and ranks as the 26th mildest February of the past 125 years.

Since When Did February Become March?: February 2018 Summary and Winter 2017/2018 Recap

March 6, 2018 - 5:11pm -- Dave Robinson

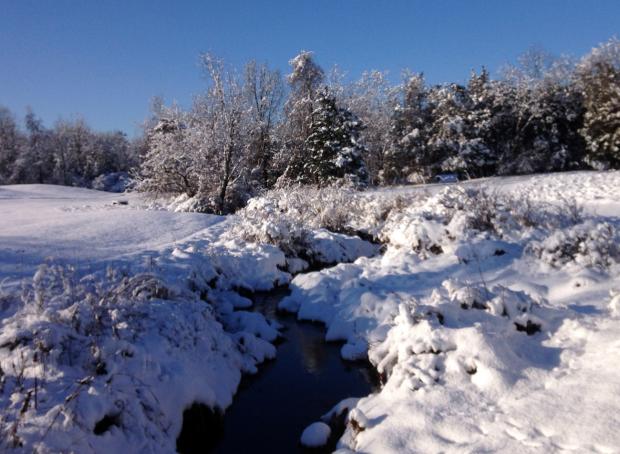
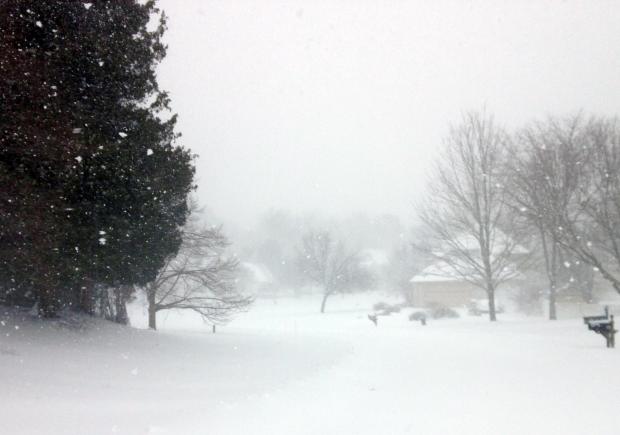
Snow photo

While the title of this report is guilty of some exaggeration, by just looking at the temperatures across New Jersey the past two Februaries you would not be far off the mark. The mildest February by far occurred in 2017 (40.4°), while this past February 2018 came in second mildest at 39.2°, just edging out 1998. This was 5.8° above the 1981–2010 mean and an impressive 8.3° above the 1895–present mean. The difference between mean periods further illustrates how Februaries in recent decades have been milder overall than earlier in the 20th century. So does the fact that February 2018 was milder than 62 of the past 123 Marches (February 2017 was milder than 70 Marches).

Not to be ignored due to February’s warmth, monthly precipitation certainly delivered in an impressive manner. The average statewide rainfall of 5.97” ranks as the third wettest on record. This is 3.17” above the 1981–2010 mean (2.87” above the period of record mean) and is the wettest February in well over 100 years.

Bitter Cold, a Blizzard, and a Thaw: January 2018 Summary

February 5, 2018 - 5:06pm -- Dave Robinson

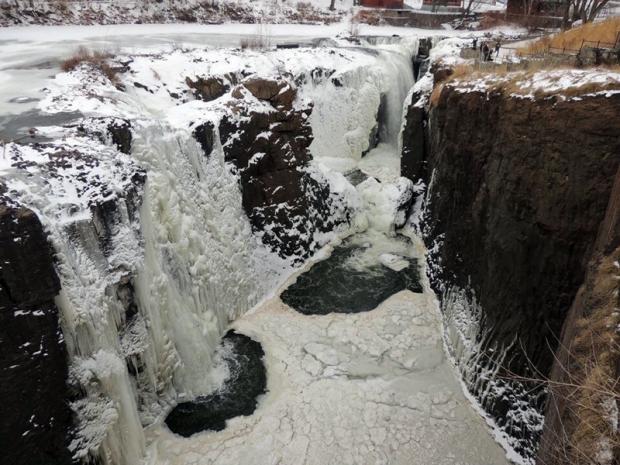
Great Falls frozen

The first month of 2018 was replete with cold, warmth, snow, rain, and stretches of dry weather. First came an impressive episode of subfreezing conditions that began in late December and extended into the second week of January. This interval included a storm that brought over 10” of snow and blizzard conditions to coastal counties. Next was a heavy rain event accompanied by much warmer air, then later in the month, several scattered rain and snow episodes interspersed with dry conditions and some 60° warmth. Something for most everyone, I suppose you could say!

The statewide January mean temperature was 29.2°. This is 1.5° below the 1981–2010 mean and ranks as the 55th coldest January of the 124 since 1895. It was the coldest January since 2015. Precipitation (rain and melted snow) across NJ averaged 2.69”, which is 0.71” below average for the month. This was the 39th driest on record and the lowest total since 2010. January snowfall across the state averaged 8.3”, which was 1.1” above average. Northern counties averaged 7.9” (-1.4”), central ones 6.9” (-1.0”), and the south on top with 9.2” (+3.4”). Through January, this snow season has brought an average of 17.0” (+4.1”) to New Jersey, with the north at 16.6” (-0.8”), central 14.7” (+0.3”), and south 17.0” (+4.1”).

An Early Winter Sampler: December 2017 Recap and Annual Summary, including the Top 10 Events of 2017

January 3, 2018 - 4:09pm -- Dave Robinson

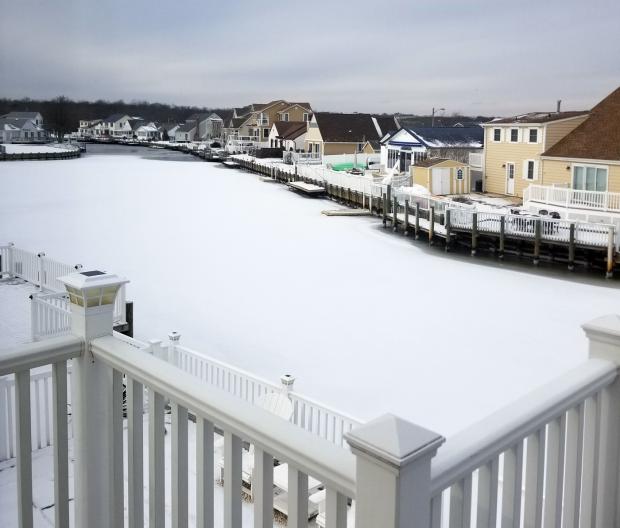
Snow-covered lagoon

The last month of 2017 was similar to many a month this past year. Whatever the season, weather conditions varied quite a bit from week to week. This was mainly due to an absence of atmospheric blocking in the middle and high latitudes with patterns that can lock a particular weather situation in place for multiple weeks. Thus in December we had a mild week, a snowy week, and a very cold week interspersed with transitional conditions. The one largely absent factor was precipitation, which resulted in the 10th driest December across NJ since records were established in 1895. The 1.57” of rain and melted snowfall was 2.28” below the 1981–2010 average. Snowfall averaged 8.7”, which is 3.9” above average and ranks as the 25th snowiest December on record. It was the snowiest since 2010. North Jersey averaged 8.7” (+2.1”), central areas 7.8” (+2.3”), and the south 9.1” (+4.9”). Temperatures seesawed from week to week, with the monthly statewide average of 33.6° being 1.6° below the 1981–2010 average. This ranked as the 61st coldest or 63rd mildest December on record.

March in February, & Another Mild Season: February and Winter 2016-2017 Recap

March 6, 2017 - 4:26pm -- Dave Robinson

Crocuses photo

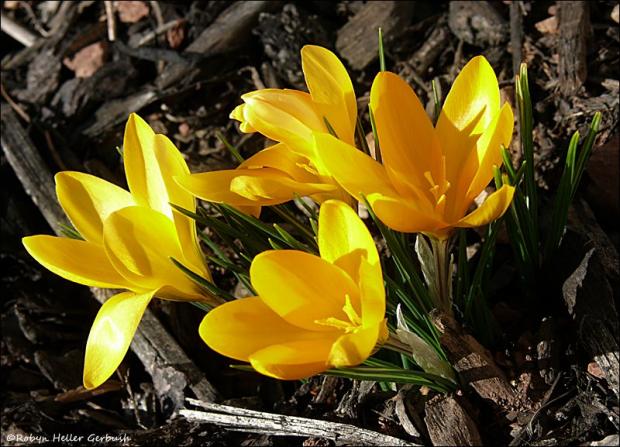
On many an afternoon this past February, one had to be reminded that, according to the calendar, we were in the midst of a winter month. While there was a modest snowstorm for central and northern areas on the 9th, there were 11 days, including the day prior to the storm, when temperatures equaled or exceeded 60° at one or more New Jersey locations. The average statewide monthly temperature of 40.1° made February 2017 NJ’s mildest since records commenced in 1895. The average was 6.6° above the 1981–2010 mean and 1.0° above the previous record in 1998. In fact, the 2017 average was only 0.7° lower than the mean for March, and would rank as the 54th mildest (69th coolest) March on record. February precipitation (rain and melted snowfall) averaged 1.70”. This was 1.10” below the 30-year mean and ranks as the 11th driest on record. Only the storm on the 9th delivered more than an inch of rain or melted snow to some observing stations around the state.

Volatility Reigns: February 2016 and 2015/2016 Winter Recaps

March 7, 2016 - 7:10pm -- Dave Robinson

Fire photo/radar combo graphic

Much like this past January, the second month of 2016 had considerable swings and occasional extremes in temperature and precipitation. This included a brief, exceedingly cold mid-month outbreak with subzero wind chills and a late-month evening with severe thunderstorms bringing strong winds, hail, and flash flooding across NJ. A key indicator of the volatile weather pattern was the wind, which on 13 days gusted to 40 mph or higher somewhere in the state, with five of these days gusting to at least 50 mph. The statewide average temperature was 35.6°, which is 1.8° above the 1981–2010 normal. This ranks as the 19th mildest February since 1895. Precipitation (rain and melted snow) averaged 4.21”. This is 1.35” above normal and ranks as the 24th wettest. Snowfall was below normal, with a statewide average of 5.1”. This is 3.0” below normal and ranks as the 52nd least snowy of the past 122 Februaries. Northern counties tallied only 4.6” (-5.5”), the central region 6.3” (-2.7”), and the south 4.7” (-1.9”).

A Winter Sampler: January 2016 Recap

February 8, 2016 - 10:35am -- Dave Robinson

Snow

While average monthly temperature and precipitation (rain and melted snow) did not vary much from their long term averages, January 2016 certainly had enough of a potpourri of atmospheric conditions to satisfy (or displease) most anyone in the Garden State. Temperatures ranged from 67° to -2°, a storm deposited as much as 2.35" of rain, and a blizzard dumped record-breaking snow in several locations and caused moderate to major flooding, especially in south Jersey coastal communities.

The statewide monthly average temperature of 31.1° was 0.1° below the 1981–2010 normal and ranked as the 66th coldest since 1895. The temperature averaged 16.7° colder than the record-shattering December 2015 warmth. This is not a record for a December to January swing in temperature, nor for several other monthly pairs too, however it ranks among the largest. Precipitation averaged 3.65", which is 0.17" above normal and 44th wettest. Statewide snowfall averaged 20.0". This was 12.1" above normal and ranks as the 7th highest since 1895 and the largest since the record 23.1" total in 2011. The north received 20.4", which is 11.1" above normal and ranks 13th largest for January, 23.1" (+15.3") fell in central NJ, ranking 5th greatest for the month, and the south averaged 18.2" (+12.5") tied for the 4th highest January total.

Will the Present Strong El Niño Event Have a Major Impact on New Jersey’s Weather?

December 18, 2015 - 12:24pm -- Ariel Schabes

Roughly every two to seven years, a joint ocean – atmosphere phenomenon known as “El Niño” occurs. Right now happens to be one of those times and this event is showing every indication of being one of the three strongest El Niños of the past 65 years. An El Niño is defined as the prolonged warming of sea surface temperatures (SST) over the central and eastern equatorial Pacific and associated anomalies of atmospheric variables such as winds, clouds, and precipitation. According to the National Oceanic and Atmospheric Administration (NOAA), to be categorized as an El Niño, a 3-month SST anomaly of at least 0.9°F (0.5°C) above average must be observed in the central and eastern equatorial Pacific. There are related atmospheric anomalies elsewhere around the globe that are associated with conditions in the tropical Pacific. Do these anomalies extend to New Jersey, especially during a strong event? This article discusses the current El Niño episode as of mid-December and speculates as to whether NJ is already being impacted by this event and may continue to be into spring 2016.

Pages

Subscribe to RSS - Winter