Overview
While March temperatures came in above normal, they were not nearly as anomalously mild as those seen in January and February. This quelled concerns that an early blooming season might arise, one that could result in damaged vegetation had an early bloom been followed by an unseasonable cold spell. The average March temperature across NJ was 42.1°. This was 1.2° above the 1991–2020 normal and ranks as the 30th mildest March since 1895. The average maximum temperature of 52.2° was 1.3° above normal, ranking 37th mildest. The average minimum of 32.1° was 0.9° on the mild side, ranking 29th mildest. The National Centers for Environmental Information northern division averaged 39.8° (+1.0°, 31st mildest), the southern division 43.5° (+1.1°, 31st mildest), and the coastal division 43.7° (+1.5°, 23rd mildest).
Statewide, precipitation averaged 2.75”, which is 1.45” below normal and ranks 29th driest of the past 129 years. The northern coast and northeast were wettest and the southwest and far south driest (Figure 1). This was reflected in the northern division averaging 3.07” (-0.94”, 44th driest), southern 2.52” (-1.80”, 24th driest), and coast 2.84” (-1.58”, 30th driest).
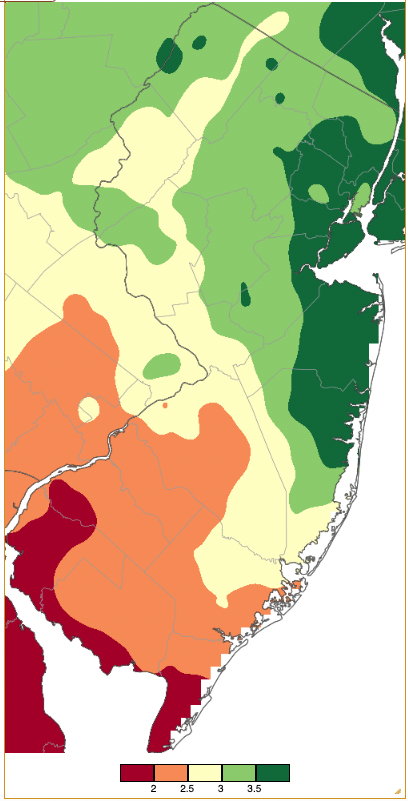
Figure 1. March 2023 precipitation across New Jersey based on a PRISM (Oregon State University) analysis generated using NWS Cooperative, CoCoRaHS, NJWxNet, and other professional weather station observations from 7 AM on February 28th to 8 AM on March 31st. Note the scale in inches at the bottom of the map. Totals range from 1.50”–2.00” (dark red) to 3.50”–3.99” (dark green).
March statewide average snowfall was 1.8”. This was 2.8” below normal and ranks as 49th least snowy. Northern counties averaged 5.4” (-1.8”, 56th least snowy), central counties 1.5” (-3.9”, 46th least snowy), and southern counties 0.0” (-2.7”, tied with 37 other years as least snowy).
Should flakes fail to accumulate in April, the state will have seen its 4th least snowy season on record at 4.8” (period of record 1895/96–present), which is 20.5” below normal. Only 1972/1973 with 4.0”, 1918/1919 with 4.3”, and 2019/2020 with 4.7” saw less. Northern counties have averaged 13.8” for the season (-21.2”, 7th least snowy) and central ones 3.9” (-24.5”, 3rd least snowy). In the south, the 0.4” seasonal average was 18.1” below normal and has been the least snowy on record, surpassing the previous minimum of 0.8” in 2019/2020. A final evaluation will follow next month.
Precipitation and Storms
As with February, March was not a particularly wet month. Monthly totals at CoCoRaHS stations were as high as 5.01”in Cranford (Union County), followed by Long Branch (Monmouth) 4.57”, Little Silver (Monmouth) 4.32”, Point Pleasant Beach (Ocean) 4.30”, and Eatontown (Monmouth) 4.28”. Among the driest stations, Wildwood Crest (Cape May) saw 1.63”, three Lower Township (Cape May) stations with 1.80”, 1.87”, and 1.89”, Upper Deerfield (Cumberland) 1.91”, and both Woodstown (Salem) and South Harrison (Gloucester) with 1.94”.
Station snowfall ranged as high as 17.4” at Sparta (Sussex), followed by Morris County stations in Mount Olive 13.0”, Randolph Township 12.1”, 11.8” and 11.5”, Jefferson Township 12.0”, 11.9”, and Rockaway Township 10.1”.
Only three March events produced more than an inch of precipitation (rain or melted snow) at NJ stations. The first was the largest when afternoon and evening rain (with some sleet and snow mixed in over northern areas) on the 3rd became heavy rain overnight, ending by daybreak on the 4th. Of 250 CoCoRaHS reports, Hawthorne (Passaic) caught the most with 1.74”, followed by Montclair (Essex) 1.70”, and New Brunswick (Middlesex) and Roxbury Township (Morris) each with 1.60” (Figure 2). Some 145 stations received from 1.00”–1.74” and 100 from 0.50”–0.99”.
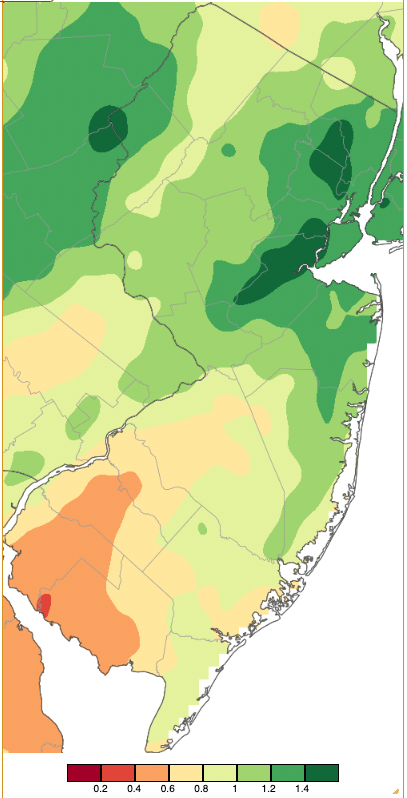
Figure 2. Precipitation across New Jersey from 7 AM on March 3rd through 7 AM March 4th based on a PRISM (Oregon State University) analysis generated using NWS Cooperative, CoCoRaHS, NJWxNet, and other professional weather station observations. Note the scale in inches beneath the map.
Snow and rain early on the 7th only amounted to a liquid maximum of 0.36” in Clark (Union). However, 14 counties saw measurable snow (0.1” or more), with five having one or more locations with at least 2.0” (Figure 3). These included Holland Township (Hunterdon) 2.6”, Mount Olive 4.8”, Watchung (Somerset) 2.8”, Sparta 4.5”, and Hackettstown (Warren) 3.5”.
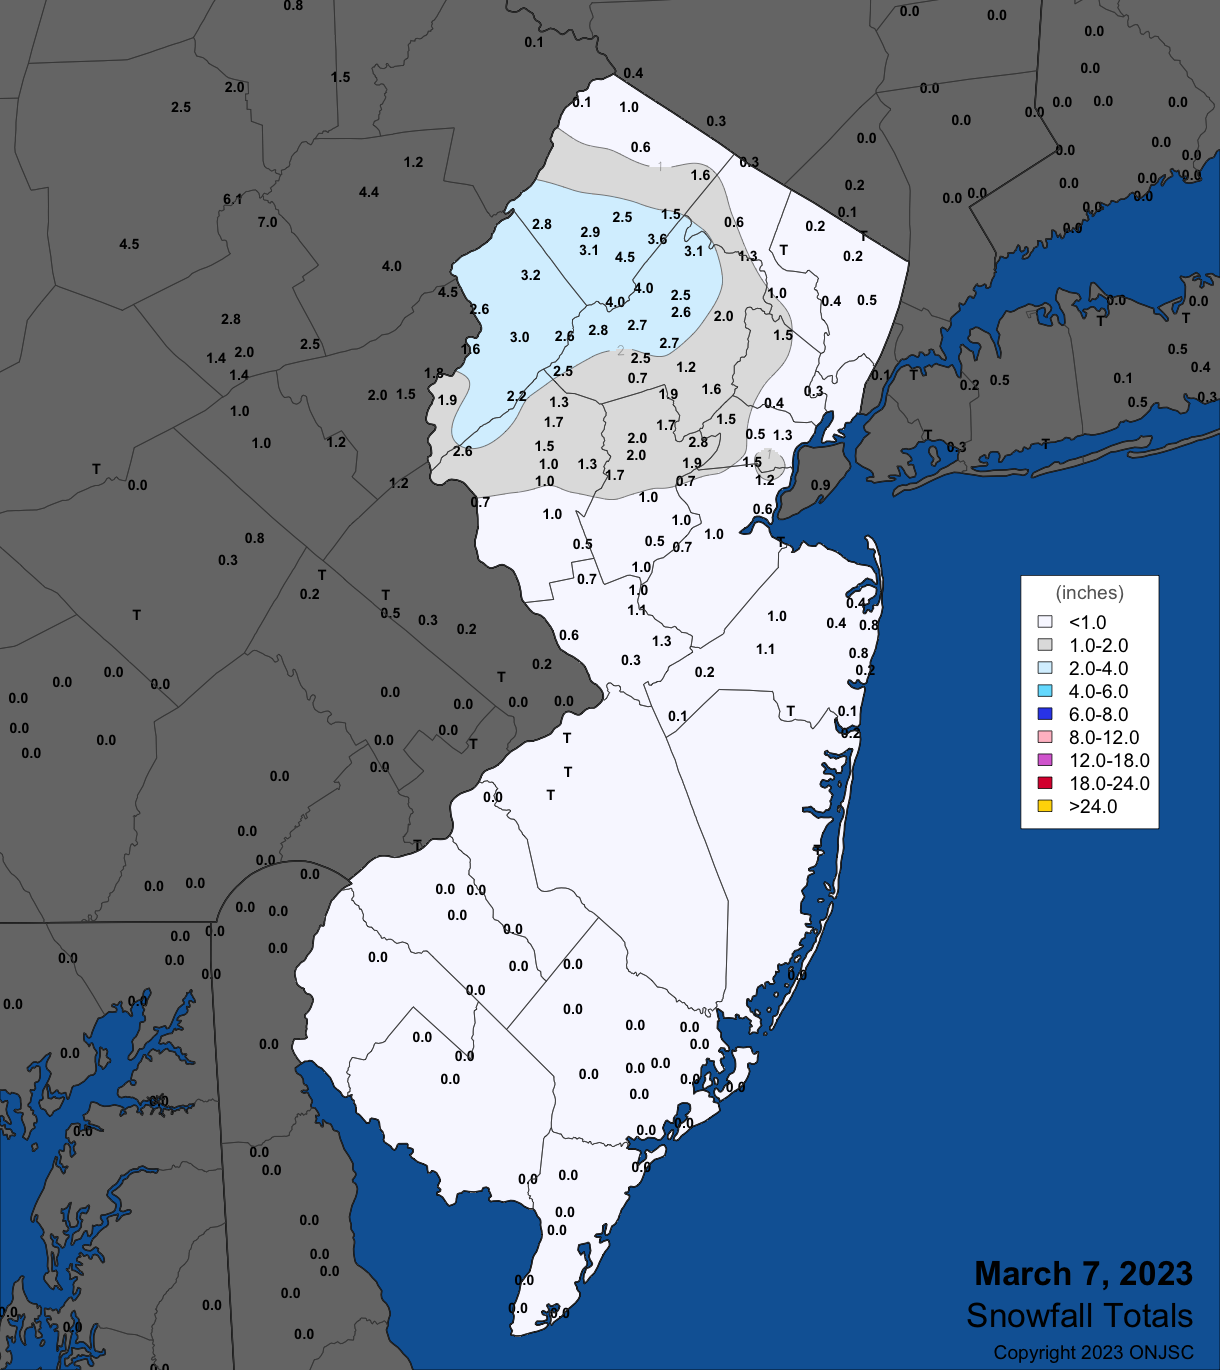
Figure 3. Snowfall on March 7th. Observations are from CoCoRaHS, NWS Cooperative Observer, NWS Trained Spotter, and North Jersey Weather Observers contributors.
Next up statewide was late-afternoon and evening rain and snow in the northwest on the 10th persisting into the morning of the 11th. Long Branch saw the most rain with 1.53”, followed by Ocean Township (Monmouth) 1.43” and Eatontown 1.26”. Just seven stations received more than an inch, while 139 caught 0.50”–0.99” (Figure 4). Measurable snow fell in nine counties, with five having locations with as much as 2.0” (Figure 5). This includes North Caldwell (Essex) 2.2”, Green Pond (Morris) 6.2”, West Milford (Passaic) 3.6”, High Point (Sussex) 7.8”, and Liberty Township (Warren) 2.0”.
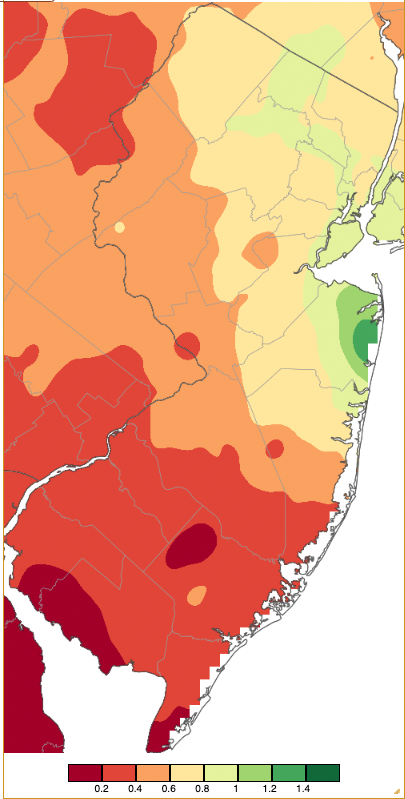
Figure 4. Precipitation across New Jersey from 7 AM on March 10th through 8 AM March 12th based on a PRISM (Oregon State University) analysis generated using NWS Cooperative, CoCoRaHS, NJWxNet, and other professional weather station observations. Note the scale in inches beneath the map.
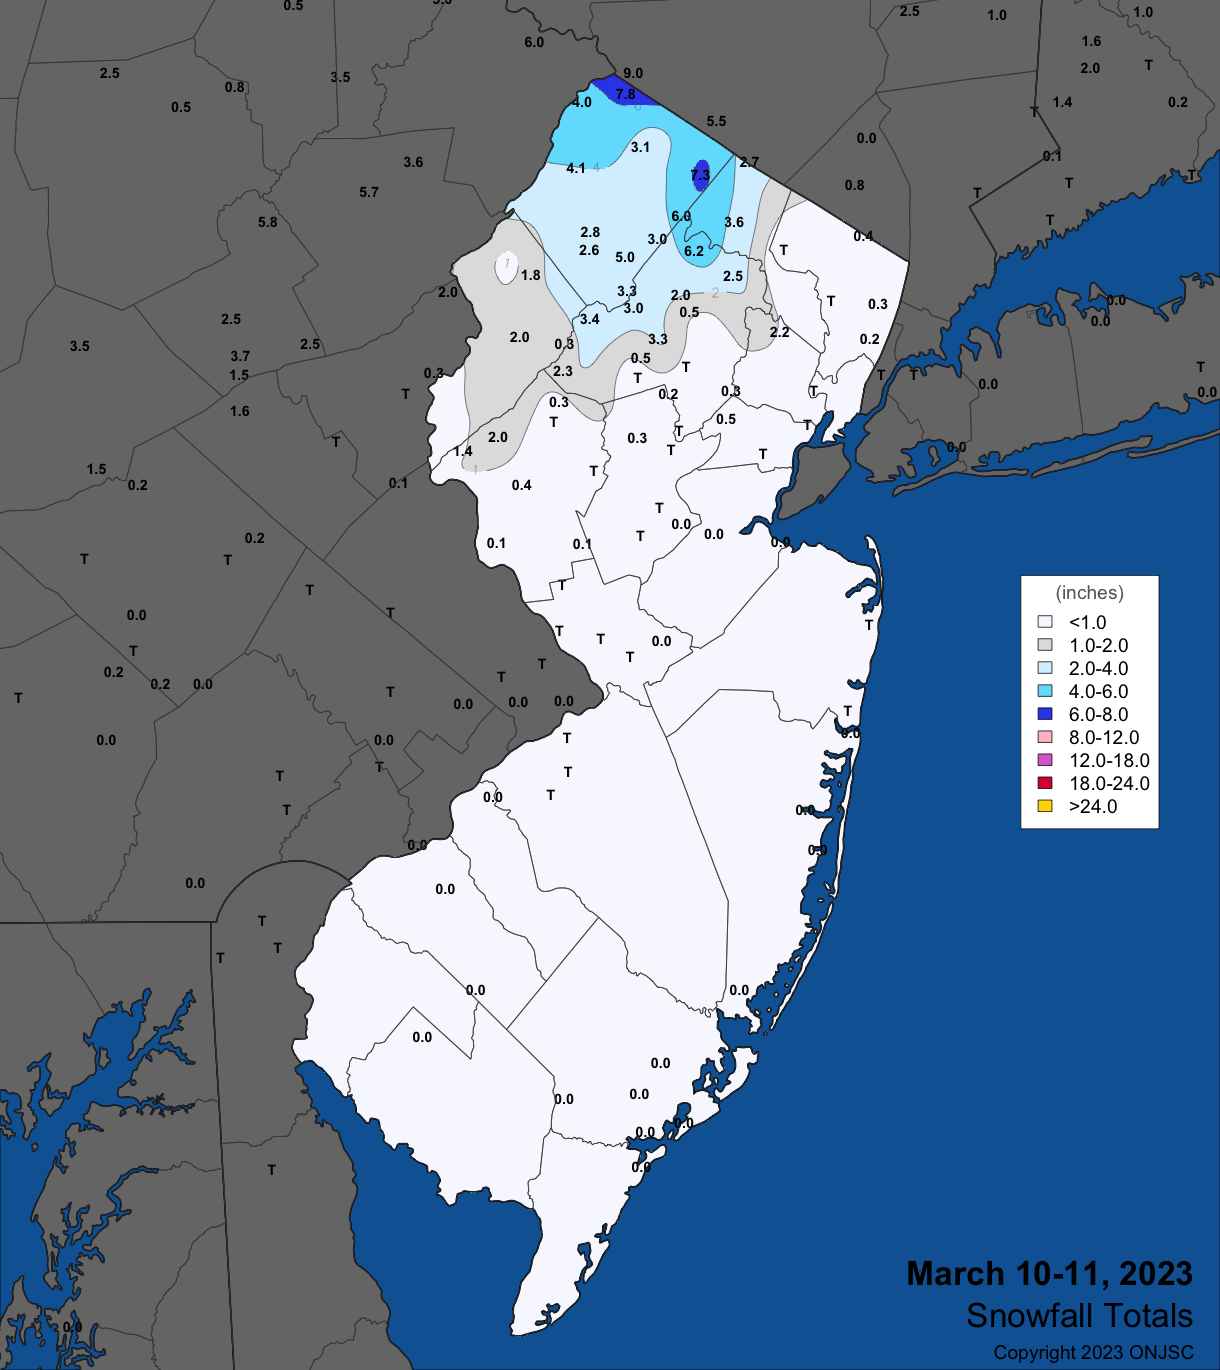
Figure 5. Snowfall on March 10th–11th. Observations are from CoCoRaHS, NWS Cooperative Observer, NWS Trained Spotter, and North Jersey Weather Observers contributors.
Light rain throughout the 13th, with some snow at higher elevations in the north, transitioned to all snow in some northern and central locations on the backside of a strong low-pressure system moving to the northeast during much of the daylight hours of the 14th. Rain and melted snow accumulated to as much as 1.08” at West Milford, with Palisades Park (Bergen) and Vernon Township (Sussex) both reporting 1.06” (Figure 6). Much less fell in the south. Measurable snow fell in 15 counties, with six of these having locations of 2.0” or more (Figure 7). They included Cedar Grove (Essex) 2.7”, Tewksbury (Hunterdon) 2.5”, Green Pond 7.2”, West Milford 5.7”, Bernards Township (Somerset) 2.0”, and Highland Lakes (Sussex) 9.0”.
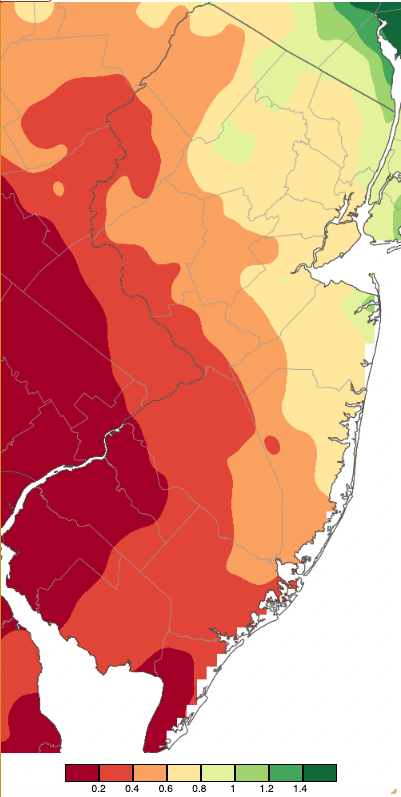
Figure 6. Precipitation across New Jersey from 8 AM on March 12th through 8 AM March 15th based on a PRISM (Oregon State University) analysis generated using NWS Cooperative, CoCoRaHS, NJWxNet, and other professional weather station observations. Note the scale in inches beneath the map.

Figure 7. Snowfall on March 13th–14th. Observations are from CoCoRaHS, NWS Cooperative Observer, NWS Trained Spotter, and North Jersey Weather Observers contributors.
Three lighter rainfall events completed the month’s precipitation regime. On the 24th, daytime showers in the far south left three Lower Township stations with 0.56”, 0.52”, and 0.50”. More widespread rain during the afternoon and evening of the 25th, even with some late thunder in some southern locations, brought 0.65” to Berkeley Township (Ocean) and Washington Township (Gloucester) 0.54”. Finally, afternoon and evening showers on the 27th extending into early on the 28th brought as much as 0.46” to Bradley Beach (Monmouth) and 0.45” at Wall (Monmouth).
The lowest barometric pressures of the month occurred on the 4th with values from 29.20”–29.30”. Highest pressures were on the 21st and 22nd, coming in between 30.35” and 30.45”.
Winds gusted to 40 mph or greater at one or more of the 65 Rutgers NJ Weather Network stations on 11 March days. This impressive list began with a 46-mph gust at High Point Monument (Sussex) on the 2nd. The 3rd brought a 46-mph gust to Harvey Cedars (Ocean), with six stations gusting from 40–44 mph. The 4th found Sea Girt (Monmouth) gusting to 57 mph, Harvey Cedars 52 mph, Little Egg Harbor Township (Ocean) 51 mph, and 13 other stations from 40–48 mph.
After a two-day break, strong gusts returned, with High Point Monument reaching 67 mph, Vernon Township 61 mph, and 12 stations from 40-47 mph on the 7th. These winds fanned a 418-acre wildfire in the Stafford-Forge Wildlife Management Area in Little Egg Harbor Township. No injuries or major damage were reported. The 8th found High Point Monument up to 50 mph, Vernon Township 45 mph, and Wantage (Sussex) 41 mph. High Point Monument hit 41 mph on the 9th.
One of the windiest NJ days in recent memory occurred on the 14th, with Atlantic City Marina (Atlantic) at 59 mph, High Point Monument 55 mph, Little Egg Harbor Township 55 mph, Harvey Cedars, Fortescue (Cumberland), and Lower Alloways Creek Township (Salem) all 52 mph, Pennsauken (Camden) 51 mph, and 22 stations peaking from 40–48 mph. Somewhat calmer conditions prevailed on the 15th, though Harvey Cedars made it to 49 mph and 16 locations from 40–48 mph. Fortescue topped out at 44 on the 19th and Pennsauken 41 mph. Vernon Township reached 43 mph on the 25th and 51 mph on the 29th, noting that the High Point Monument anemometer was damaged and out of commission from the 25th onward.
Temperature
The first week of March found high temperatures of 60° at some southern NJWxNet stations on three days, the 2nd at Atlantic City Marina and Woodbine (Cape May), the 4th at six locations, and the 5th at six sites. On the 4th, High Point Monument only reached 35°, illustrating the thermal contrast from south to north.
Mild conditions returned on the 16th with Sicklerville (Camden) at 61° and 13 locations at 60°. On this day, Pequest rose to 60° following a statewide morning minimum of 19°. Howell (Monmouth) reach 65° on the 17th with 41 stations from 60°–64°. Cape May Court House (Cape May) was 61° and Woodbine 60° on the 18th.
The 21st found Toms River (Ocean) and Walpack (Sussex) at 65° and 53 of the remaining 63 NJWxNet stations from 60°–64°. The 22nd was the first of three March days that are in contention for the warmest day of the month. Here, the distribution of mild temperatures was rather uniform across NJ with the exception of cooler coastal locales (Figure 8). Sicklerville reached 68°, Hammonton (Atlantic), Red Lion (Burlington) each got to 67°, and 50 other stations were from 60°–66°. The next warmest day contender was the 23rd when Cape May Court House at 71° had the state monthly maximum, followed by West Cape May (Cape May) at 70°, and 43 stations from 60°–69°, illustrative of a cooler north and warm south (Figure 9). The 24th saw only Sea Girt 64° and Oceanport (Monmouth) 63° exceed 60°. The last of the three warmest day contenders was the 26th with Sicklerville at 65° and 57 stations 60°–64°, exhibiting a very uniform coverage, with the exceptions of the cooler northwest and the Delaware Bay coast (Figure 10). The 27th brought a high of 68° to West Deptford (Gloucester) and 44 stations from 60°–67°. Piney Hollow (Gloucester) and Sicklerville were each 66° on the 31st, with 30 locations from 60°–65°.
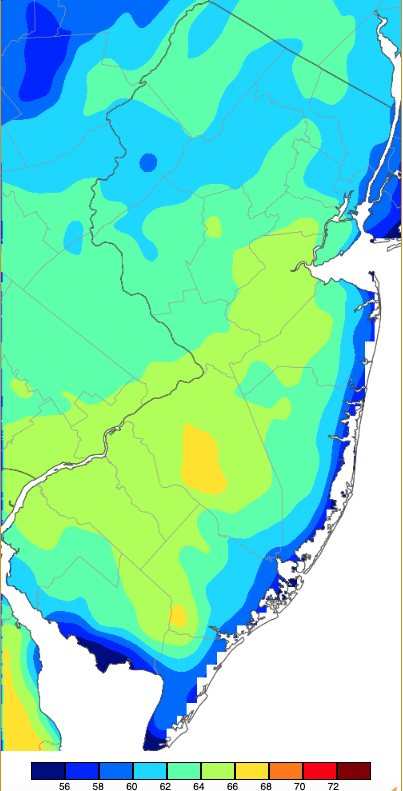
Figure 8. Maximum temperatures on March 22nd based on a PRISM (Oregon State University) analysis generated using NWS, NJWxNet, and other professional weather stations. Note the 2-degree scale beneath the map.
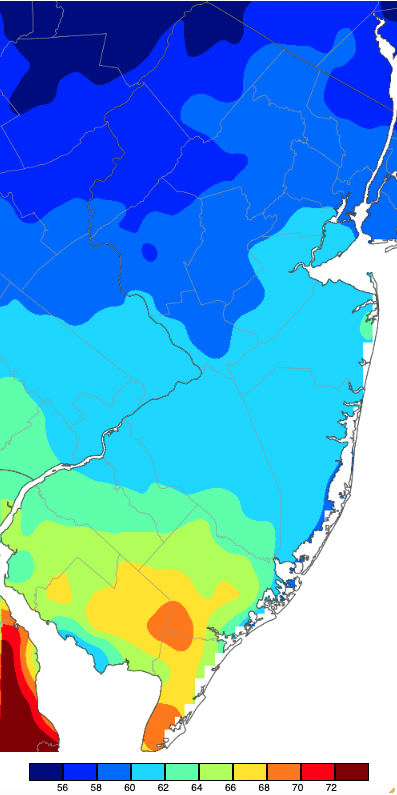
Figure 9. Maximum temperatures on March 23rd based on a PRISM (Oregon State University) analysis generated using NWS, NJWxNet, and other professional weather stations. Note the 2-degree scale beneath the map.
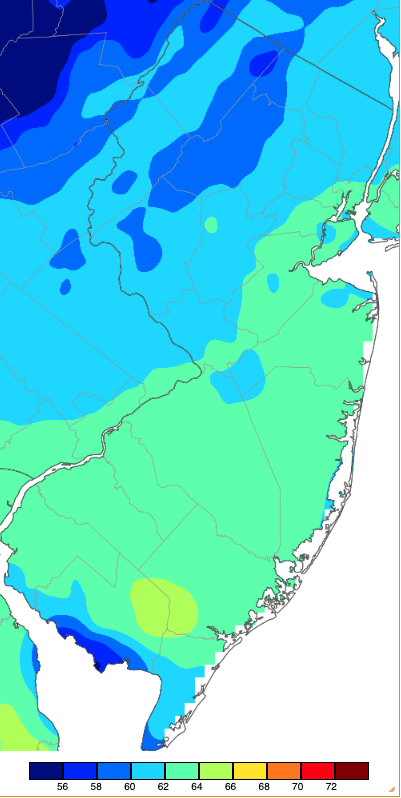
Figure 10. Maximum temperatures on March 26th based on a PRISM (Oregon State University) analysis generated using NWS, NJWxNet, and other professional weather stations. Note the 2-degree scale beneath the map.
The 23rd was the only March day without at least one NJWxNet station falling to the freezing point or colder. Otherwise, there were eight days where one or more station dropped to 20° or colder. The 1st saw Pequest and Sandyston (Sussex) bottom out at 17°, Walpack 19°, and Basking Ridge (Somerset) 20°. It was not until the 10th that the 20° or lower mark was again achieved when the temperature fell to 20° at Walpack. Cold returned on the 16th with Pequest 19° and Berkeley Township and Walpack each 20°. A three-day run of cold ushered in astronomical spring, starting with 18° at High Point Monument and 20° in both Walpack and the lower-elevation High Point station on the 19th. The 20th was the coldest March morning with Walpack down to 14°, Sandyston 15°, and ten NJWxNet sites from 16°–20° (Figure 11). The state low of 17° at Walpack on the morning of the 21st was followed there that afternoon by a tie for the state daily maximum of 65°. Other lows that morning included Pequest 18° and Sandyston and Hopewell Township (Mercer) each at 20°. Late in the month, High Point Monument fell to 19° on the 30th, with the 31st bringing lows of 17° to Walpack, Pequest 19°, and both Hopewell Township and Sandyston 20°. These lows compared with the highest minimum of 43° at Fortescue.
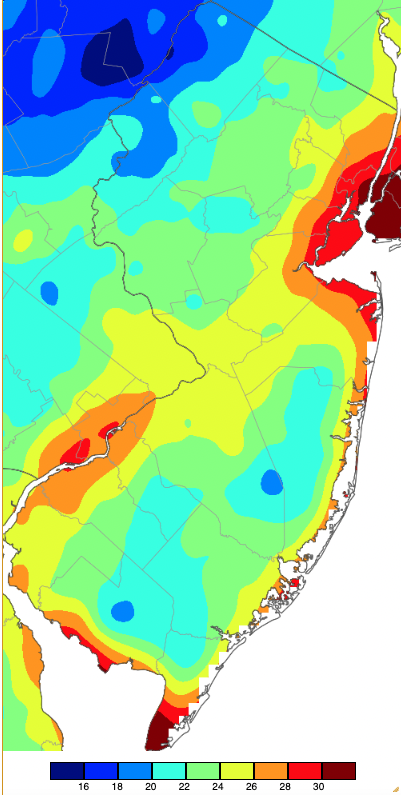
Figure 11. Minimum temperatures on March 20th based on a PRISM (Oregon State University) analysis generated using NWS, NJWxNet, and other professional weather stations. Note the 2-degree scale beneath the map.
Given the absence of prolonged or excessive warmth in March, vegetation did not prematurely green up and bloom. Thus, despite some cold nights during the last two weeks of the month, there was no plant damage reported as had been the case in March 2022. The two photos in Figure 12 illustrate this, as they show the same Magnolia tree on almost the same late March day a year apart.
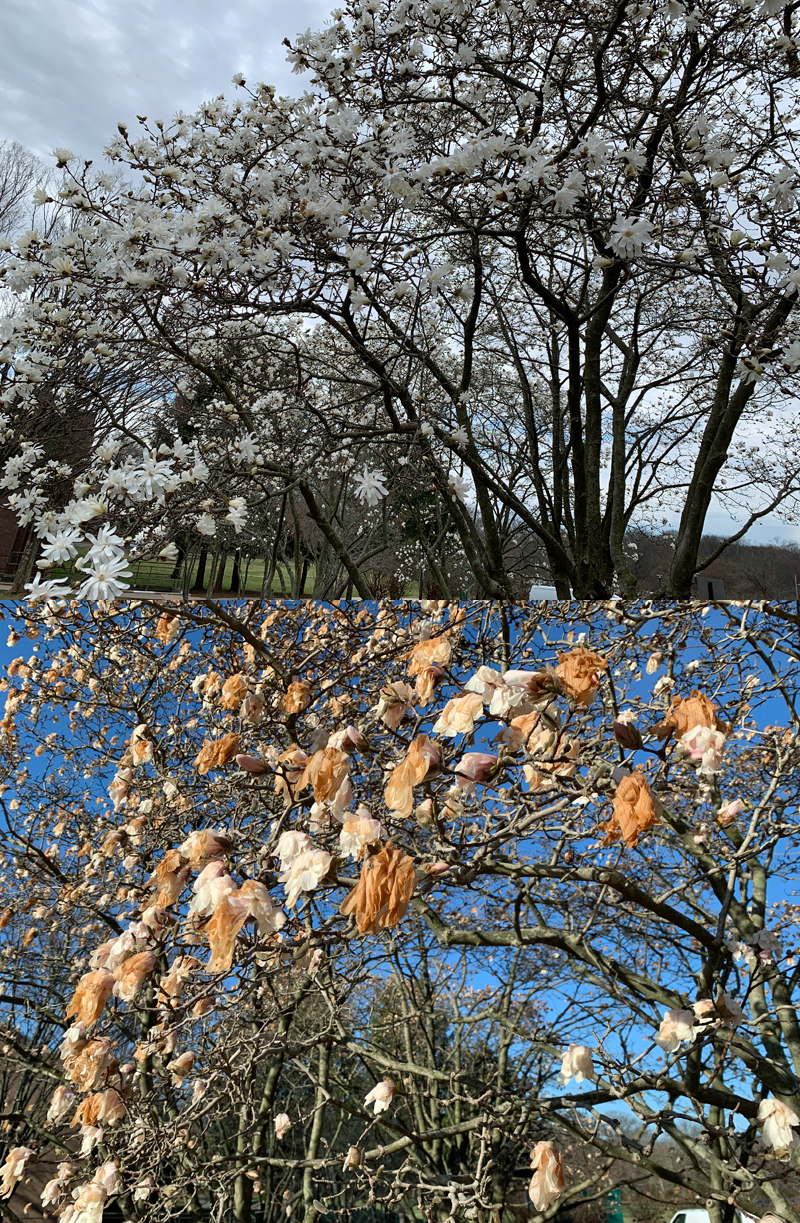
Figure 12. Blossoming magnolia on Rutgers’ Livingston Campus in Piscataway (Middlesex) on March 27, 2023, (top) and March 29, 2022 (bottom).


