March Overview
March 2020 was the 6th mildest in New Jersey dating back to 1895 (Table 1). Combined with mild rankings of 9th in January and 4th in February, 2020 has started off as the 2nd mildest on record at 5.8° above the 1981–2010 average. The 40.8° average only falls behind 2012’s 41.4°. Six of the ten mildest January–March intervals in the past 126 years have occurred since 2002.
March averaged 46.3° across NJ, which is 5.5° above average. The average maximum of 56.2° (+5.4°) ranked 7th mildest and the minimum of 36.4° (+5.6°) 2nd mildest. Anomalies were +5.8° in both the southern (47.9°) and coastal (47.7°) divisions, ranking 6th and 4th mildest, respectively, and +5.0° in the north (43.7°), ranking 9th mildest. As a result of the premature warmth, vegetation green up across the state was at least two weeks earlier than normal.
| Rank | Year | March Avg. Temp. |
|---|---|---|
| 1 | 2012 | 49.8° |
| 2 | 1945 | 48.8° |
| 3 | 1921 | 48.4° |
| 4 | 2016 | 47.0° |
| 5 | 1946 | 46.8° |
| 6 | 2020 | 46.3° |
| 7 | 2010 | 46.2° |
| 7 | 1903 | 46.2° |
| 9 | 2000 | 45.6° |
| 10 | 1977 | 45.0° |
Table 1. The ten warmest Marches across NJ since 1895.
Eleven of the past 12 months have averaged above normal across New Jersey. Seven of these months have ranked in the top 9 for their respective month. Thus, it is not surprising that the past 12 month period ranks as the 3rd warmest April–March interval and the 23rd warmest of any consecutive 12-month interval of the 1492 such intervals since January–December 1895. To provide more numbers to spin through your mind, of the 22 warmer 12-month intervals, 12 occurred between March 2011 (the start of the first of these intervals) and January 2013 (the end of the last interval) and 10 between April 2015 and February 2017. All but one (March 1931–February 1932) of the 100 warmest 12-month intervals have occurred since January 1990, with all but 17 of them falling fully in this century. This is another example of how New Jersey is warming in recent decades compared to the previous century.
March precipitation, virtually all falling as rain, averaged 3.77” across the state. This was 0.34” below average but was just at the median for the past 126 years, demonstrating that average March values tend to be skewed toward the dry side. The north was driest with an average of 3.53” (-0.43”), with slightly higher values along the coast with 3.69” (-0.62” and south with 3.94” (-0.25”). Snowfall averaged 0.1” in the north, with traces to no snow observed elsewhere.
Temperature
Daily maximum temperatures equaled or exceeded 65° at a number of the 62 NJWxNet station locations on seven March days. The wait for warmth was not long, as ten stations rose to 66° on the 2nd. A week later on the 9th, seven locations reached 74°, 46 topped out between 70°–73°, and four from 65°–69°. Coolest that day were coastal stations rising to 57° at Harvey Cedars (Ocean County) and Fortescue (Cumberland), and 58° at Atlantic City Marina (Atlantic). Humidity levels were exceedingly low on the 9th, with dewpoints away from the coast in the teens, and afternoon relative humidity between 10%–20%. This contributed to impressive diurnal temperature ranges, such as 52° at Walpack (Sussex), where the maximum of 73° was preceded by a morning low of 21°. Meanwhile, the diurnal range was just 13° at both Harvey Cedars and Atlantic City Marina.
Greenwich (Cumberland) and Egg Harbor Township (Atlantic) rose to 69° on the 10th, with 47 stations from 65°–68°. West Deptford (Gloucester) reached 76° on the 13th, with 46 stations from 70°–74°. By far, the warmest day of the month was the 20th, when Vineland (Cumberland) soared to 84°, ten stations reached 82°, 22 from 80°–81°, and 25 from 70°–79° (Figure 1). High Point Monument (HPM; Sussex) was coolest at 67°. Warmth held on into the early hours of the 21st before more seasonable air arrived. This resulted in early daily maximums of 72° in Woodbine (Cape May) and Egg Harbor Township, with seven stations at 70°–71°. One final shot of warmth on the 27th brought maximums of 71° to Sicklerville (Camden), 70° at six locations, and 65°–69° highs to 46 stations.
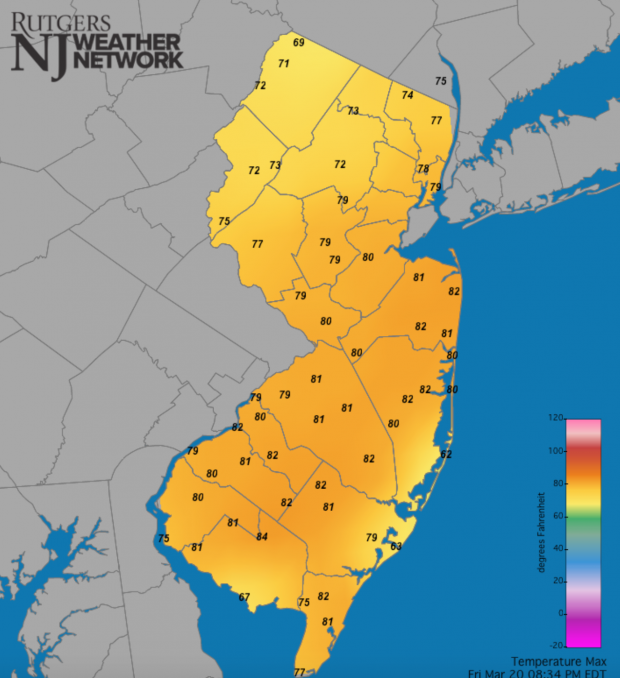
Figure 1. Maximum temperatures at NJWxNet stations on March 20th, ranging from 84° in Vineland (Cumberland) to 67° at High Point Monument (Sussex; not shown).
On 12 March days an NJWxNet station recorded a minimum temperature of 25° or colder. The northwest valley Walpack station was in on the act on 11 days, at times joined by other valley locations or the network’s highest elevation station at HPM. The 1st was the month’s coldest morning, with Walpack at 13°, Berkeley Township (Ocean), Hopewell Township (Mercer), and HPM all at 15°, and 49 other locations at or below 25°. This was the last day of the season with all NJWxNet stations having a freezing minimum, with West Cape May (Cape May) the mildest at 30°. The 2nd brought the aforementioned first day of warmth, however, it started on the cold side, with Walpack at 18° and Hopewell Township 19°. The latter location experienced a 45° diurnal temperature range, with nine other stations with a 40°–44° range.
Walpack fell to 20° and Pequest (Warren) 22° on the 6th, with 21° and 23° lows, respectively, at these sites on the 7th. Walpack was down to 15° on the 8th (jumping to 63° in the afternoon), followed by Pequest at 18°, Sandyston (Sussex) 19°, and 28 stations from 20°–25°. This was another day with low humidity, with most non-coastal stations having dewpoints in the teens, and a few, such as 4° at Sandyston, even lower. Afternoon relative humidity was in the teens. Walpack fell to 21°, and both Pequest and Hopewell Township 24° on the 9th.
Walpack dropped to 24° on the 15th and 16° on the 16th, when it was joined by 19° at HPM and 20°–25° at seven locations. Walpack was 22° on the 18th. Walpack fell to 24° on the 21st and, with HPM, was 19° on the 22nd. The final cold honors of the month went to Pequest with a low of 24° on the 26th.
There were quite a few damp days at the end of the month with extensive cloud cover and chilly northeasterly winds throughout the state. This is no better exemplified than temperatures during the midafternoon of the 25th, with the highest elevations in the upper 30°s and no location, whether at the coast or inland, milder than the mid 40°s (Figure 2). It was a rare day when fewer stations would suffice for temperature readings but an excellent one to verify that the recording instruments are all functioning accurately!
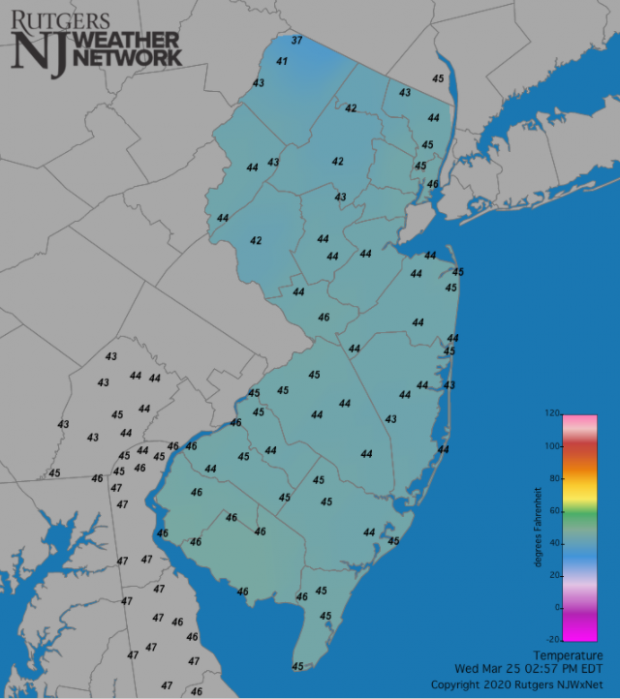
Figure 2. Temperatures across NJ and surrounding states at 2:55PM on March 25th. Observations are quite uniform across the region. This is due to heavy cloud cover, humid air, scattered light rain falling, and a northeasterly wind blowing off the cool Atlantic.
Precipitation and Storms
Precipitation across NJ was relatively evenly dispersed in March. The most rain fell in and near the upper coast, with the least in the northwest. Among CoCoRaHS station reports, Berkeley Township, with 5.06”, topped the chart, followed by Pine Beach (Ocean) 5.04”, Toms River (Ocean) and Lacey Township (Ocean) each at 5.02”, Stafford Township (Ocean) 5.01”, Red Bank (Monmouth) 4.78”, Medford Township (Burlington) 4.77”, and East Brunswick (Middlesex) 4.72”. The lowest totals included Wantage (Sussex) 2.85”, Lebanon Township (Hunterdon) 2.91”, Boonton (Morris) 2.94”, Warren Township (Somerset) 2.94”, Upper Deerfield (Cumberland) 2.98”, and both Montague (Sussex) and Blairstown (Warren) at 3.02”.
Measurable snow was only observed at higher elevations in the north. Sparta (Sussex) had the most at 0.9”, followed by Jefferson Township (Morris) 0.8”, and Mine Hill (Morris), Randolph Township (Morris), and West Milford (Passaic) each at 0.5”.
The first precipitation event of the month began with showers late in the afternoon of the 3rd. An evening squall line included thunderstorms, strong winds, and brief downpours. Two Pennington (Mercer) stations caught 0.54” and 0.51”, Princeton (Mercer) 0.54”, and Hopewell Township 0.53”. Winds gusted to 68 mph at Mullica (Atlantic), Fort Dix (Burlington) 61 mph, Lower Alloways Creek Township (LACT; Salem) 56 mph, Upper Deerfield 52 mph, Pennsauken (Camden) 51 mph, HPM, Fortescue, and Seaside Heights (Ocean) all 50 mph, and eleven stations from 40–48 mph. Tree, wire, and roof damage was reported in scattered locations.
Rain commenced during the afternoon of the 6th, ending early on the 7th. As shown in Figure 3, values were highest in the southeast gradually decreasing to the northwest. Four Lower Township (Cape May) stations caught 0.95”, 0.89”, 0.86”, and 0.84”, and two Middle Township (Cape May) sites each had 0.82”. Snow fell at higher elevations in the north, including 0.8” at Sparta and 0.5” in Jefferson Township.
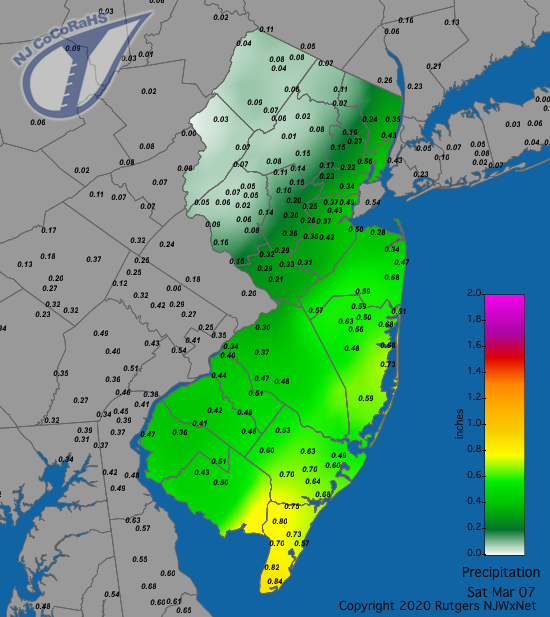
Figure 3. Rainfall from approximately 7AM on March 6th to 7AM on March 7th showing a southeast to northwest decrease in totals at CoCoRaHS stations.
Rain late on the 12th into the morning of the 13th brought 0.59” to Estell Manor (Atlantic), Linwood (Atlantic) 0.58”, and Port Republic (Atlantic) 0.57”. Morning rain on the 17th saw River Edge (Bergen) and Flemington (Hunterdon) each pick up 0.38” and New Brunswick (Middlesex) 0.36”. Snow fell at HPM, with 0.5” accumulating.
The first of three March inch-plus rainstorms began in the southwest late on the 18th. Moderate to heavy rain fell statewide early on the 19th, tapering off later in the morning. The map shown in Figure 4 shows the majority of the rainfall for the event. Of the 234 reporting CoCoRaHS stations, Red Bank, with 1.57”, had the most, followed by two Woodbridge (Middlesex) locations each with 1.40”, and New Brunswick 1.30”. This widespread event found 78 stations coming in with 1.00”–1.29” and 134 from 0.50”–0.99”. Middle Township saw the least at 0.33”.
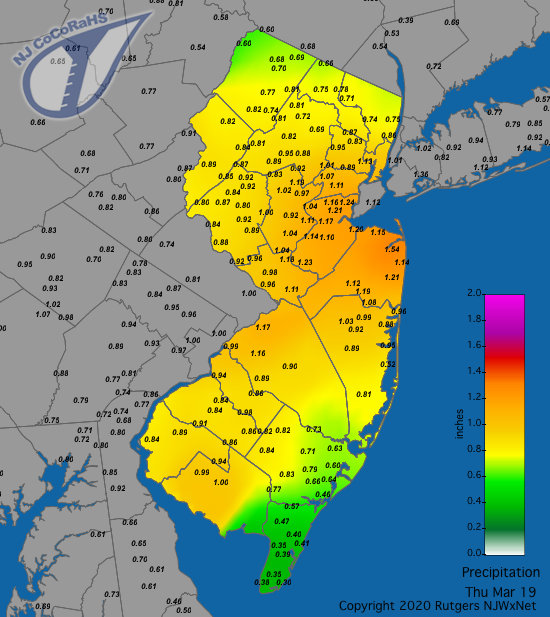
Figure 4. Rainfall from approximately 7AM on March 18th to 7AM on March 19th showing most of the state receiving 0.50” or more rainfall, with the heaviest in the east central region and least falling in the far south and in the northwest.
A chilly storm during the pre-dawn hours of the 23rd and lasting into the early evening brought 0.5” of snow to Mine Hill, Randolph Township, and West Milford, with 14 stations catching 0.1”–0.4”. Other northern and central locations reported traces of snow and sleet. Hefty precipitation totals included Berkeley Township 1.95”, Lacey Township 1.82”, Toms River 1.63” and 1.61”, and Red Bank 1.60”. Of the 225 CoCoRaHS reports, 64 were from 1.00”–1.59” and 152 between 0.50”–0.99”. Mount Olive (Morris) saw the least with 0.45” and Lower Township 0.47”.
The third late-March widespread rain event commenced from south to north during the morning of the 28th, lasting all day and evening prior to ending early on the 29th. Portions of the south saw the most, with 1.24” at Mount Ephraim (Camden), Evesham (Burlington) 1.18”, and both Medford Township and Medford Lakes (Burlington) with 1.16” (Figure 5). Nine stations received from 1.00”–1.15” and 106 sites with 0.50”–0.99”.
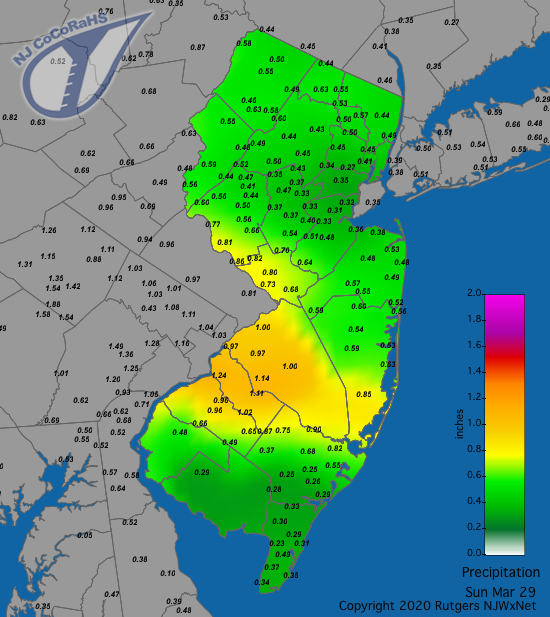
Figure 5. Rainfall from approximately 7AM on March 28th to 7AM on March 29th showing the heaviest totals in Burlington and Camden counties, with widespread totals under an inch elsewhere.
A complex of thunderstorms raced across extreme north Jersey on the morning of the 29th, accompanied by small pea-size hail. The same situation occurred late in the evening across a swath of south central NJ. In the north, Hardyston (Sussex) received 0.49”, Andover Township (Sussex) 0.49”, and Bloomingdale (Passaic) 0.40” (Figure 6). In the south, Manchester (Ocean) caught 0.69”, Pine Beach 0.58”, and Medford Township 0.50”. Very light precipitation was observed elsewhere. Evening showers on the 30th into the pre-dawn of the 31st dropped 0.55” on Clinton (Hunterdon) and 0.50” at Lebanon Township.
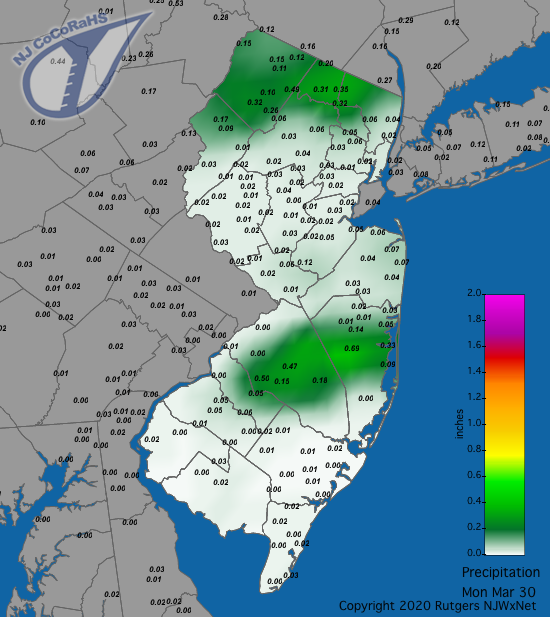
Figure 6. Rainfall from thunderstorms during the morning of March 29th in far northern NJ and rain that fell in thunderstorms during the evening of the 29th across a portion of southern NJ. Some small hail fell in some of these storms.
The lowest barometric pressures of March occurred on the 3rd, with most stations at 29.40”–29.50”. On the high end, both the 22nd and 23rd found stations between 30.60”–30.70”. Along with the strong winds previously discussed on the 3rd, ten other March days saw one or more location within the NJWxNet gust to 40 mph or higher. HPM and Fortescue hit 41 mph on the 4th and HPM 43 mph on the 5th. The 7th saw gusts to 41 mph at HPM and LACT and 40 mph in Pennsauken. HPM and LACT each reached 42 mph on the 10th, and HPM 44 mph on the 11th. HPM gusted to 52 mph and Atlantic City Marina 40 mph on the 13th, with HPM to 41 mph on the 14th. Gusts on the 20th reached 61 mph at HPM, Cream Ridge (Monmouth) 46 mph, LACT 44 mph, and 42 mph at both Moorestown (Burlington) and Sea Girt (Monmouth). HPM gusted to 58 mph on the 21st. The 28th brought coastal gusts of 43 mph to Harvey Cedars and 41 mph at Atlantic City Marina.


