Welcome to the NJ State Climate Office
Welcome to the new, integrated site for the New Jersey State Climate Office and the NJ Weather Network. This site showcases both historic, climate products as well as real-time observations from the 70 station NJ Mesonet and other weather stations throughout the region. Please submit any questions, feedback, or concerns using our contact form.
The NJ State Climate Office offers a robust catalog of climatological data and analysis, including some products that include data as far back as 1895. You can explore NJSCO products via the "Climate" and "Publications" menus above.
The NJ Weather Network provides real-time, localized weather data. This data is available in a variety of formats, including interactive visualizations like the map seen above. You can explore NJ Weather Network products via the "Weather" menu above.

June Overview
The title of this month’s report is appropriate for two very different reasons. First, it applies to Jersey-wide precipitation this month and over the first half of 2026 being well below normal. This condition has persisted over 23 of the past 26 months when compared to 1991–2020 normals.

May Overview
Spring is often recognized as a period when winter attempts to hold on while summer comes knocking on the door. This past March and April displayed this “battle"...to the extreme. May also followed suit. The focus was mainly on thermal swings, resulting in many a decision on whether to go with cold or warm weather clothing. Meanwhile, the ongoing poor “production” of precipitation was disappointingly more persistent, except, unfortunately, over the Memorial Day weekend. First will be a recap of May conditions, followed by a spring overview.
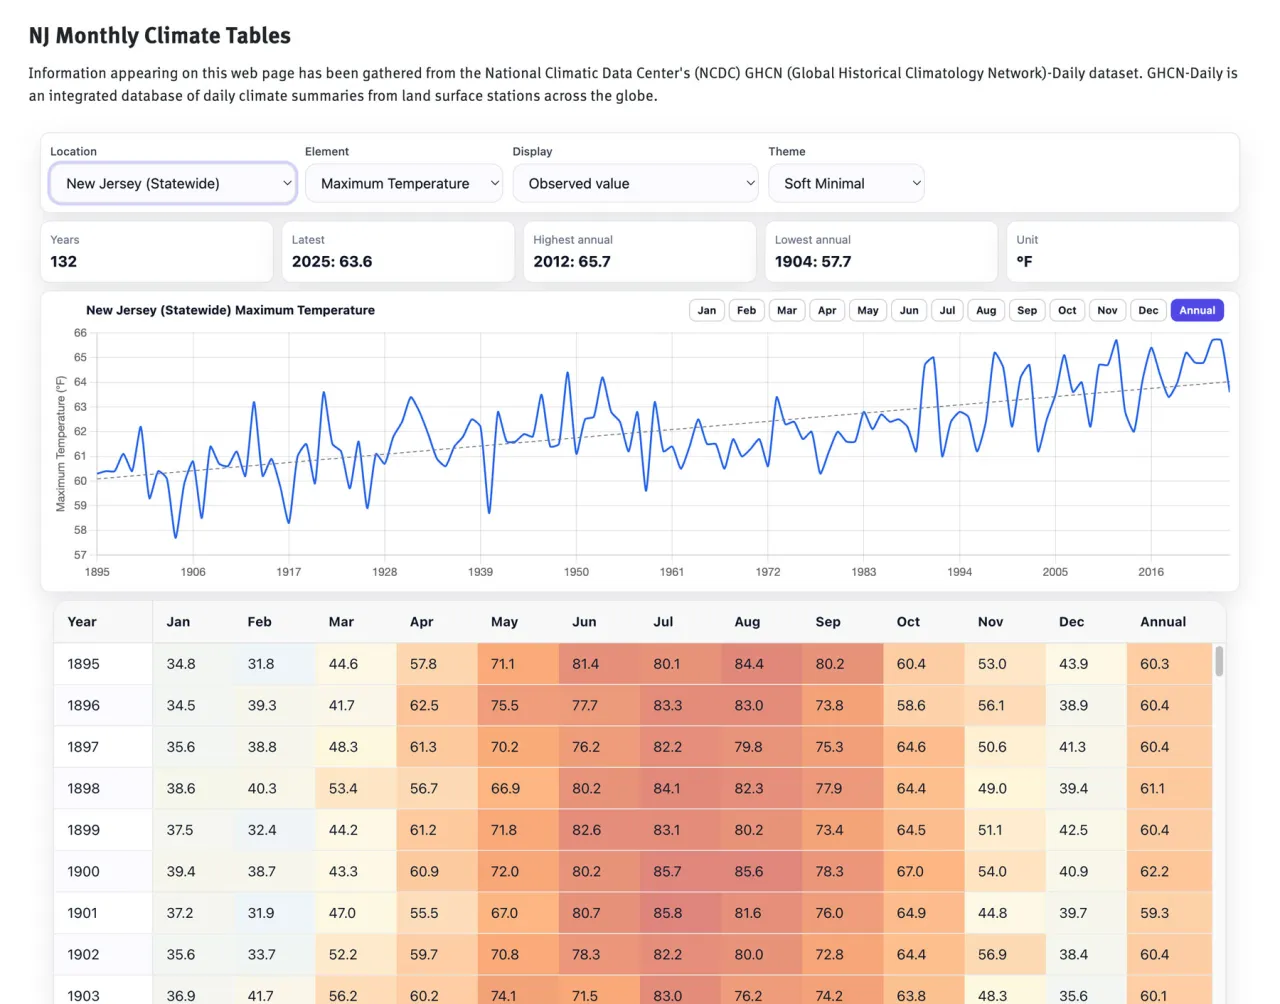
Our featured product this month is our Monthly Climate Tables. The monthly data are sourced from the U.S. Climate Divisional Dataset (NClimDiv), which is a long-term temporally and spatially complete dataset from 1895–present for the contiguous United States, including NJ, its 3 climate divisions, and all 21 counties. The dataset is maintained by NOAA’s National Centers for Environmental Information (NCEI) and provides temperature and precipitation statistics, as well as heating and cooling degree days.
Divisional values in NClimDiv are derived from area-weighted averages of grid-point estimates interpolated from station data. A nominal grid resolution of 5 km is used to ensure that all divisions had sufficient spatial sampling and because the impact of elevation on precipitation is minimal below 5 km. Station data are gridded via climatologically aided interpolation to minimize biases from topographic
and network variability.
The Global Historical Climatology Network (GHCN) Daily dataset is the source of station data for NClimDiv. GHCN-Daily contains several major observing networks in North America, with the primary network in NJ being the National Weather Service (NWS) Cooperative Observing (COOP) program, which consists of stations operated by volunteers as well as by agencies such as the Federal Aviation Administration.

In partnership with the Bureau of Dam Safety (BDS) at the New Jersey Department of Environmental Protection (DEP), the NJSCO created a real-time data analysis and alert system to help BDS staff more closely monitor and react to threats to the more than 1,700 regulated dams within the state.
The NJ DAMSAFE app analyzes precipitation events statewide by utilizing real-time station data from over 160 precipitation gages distributed throughout the state of New Jersey. Monitoring is performed for six distinct hydrological regions defined by the Department of Environmental Protection. When accumulating precipitation exceeds certain thresholds, alerts are issued to BDS staff, allowing them to proactively address developing threats to NJ dams.