News

Typical Springtime Variability: May and Spring 2014 Summaries

June 7, 2014 - 1:01pm -- Dave Robinson

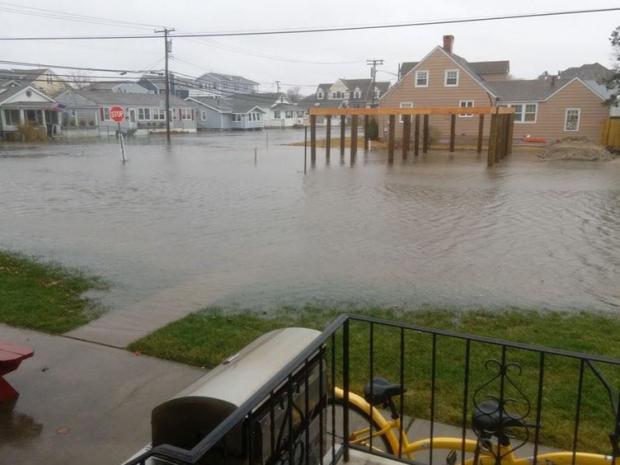
Flooding in Newark

May 2014 had a difficult time establishing an identity. What began with a storm that carried over from April 30th and resulted in the 7th largest flood of the past century in the Raritan basin on the 1st (see the April narrative for discussion of this event), later included some warm days, late freezes in a few locations, severe thunderstorms with hail in others, and a spectacular Memorial Day. Overall, May averaged 62.1°, which is 1.3° above average (compared to the 1981-2010 average). This ranks as the 35th warmest (tied with 1962) in the 120 years back to 1895. Precipitation averaged 5.18", which is 1.18" above average and ranks as 19th wettest. This value includes the considerable rain that fell on April 30th at National Weather Service Cooperative Stations that report during the morning hours (see April narrative for a full explanation).

Potential El Niño could impact New Jersey weather this summer

May 30, 2014 - 5:11pm -- Dan Zarrow

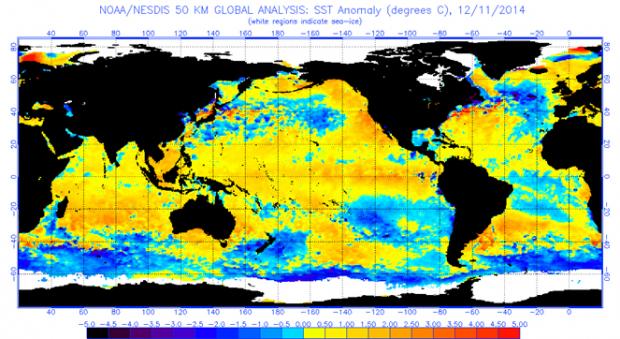
Map of impending El Nino

As climatological summer and the Atlantic hurricane season begin on June 1, scientists are carefully monitoring sea-surface temperatures in the tropical Pacific Ocean for a potential El Niño event. An El Niño occurs when warmer-than-average waters start to form in the eastern Pacific Ocean, specifically near the equatorial latitudes. Easterly winds (blowing from the east) typically move warmer water to the western Pacific (near Indonesia), permitting cooler water to upwell to the surface in the east (near South America). When these winds are weaker, or if they reverse direction, the warm water stays in the eastern Pacific. This difference in sea surface temperatures and winds creates a new dynamic between the ocean and atmosphere, distinctly affecting weather patterns across the world. No two El Niño events are alike; they vary in magnitude and location of the largest temperature anomalies. El Niño events can be classified as Strong, Moderate or Weak. What might an El Niño summer mean for New Jersey's weather?

Another End-of-Month Soaker…but First Some Flames: April 2014 Summary

May 10, 2014 - 4:44pm -- Dave Robinson

Wildfire photo

Was it a drier-than-average April? Was it a wetter-than-average April? If only it hadn't rained heavily on the last day of the month! Certainly this is a strange beginning to this monthly weather narrative. Let me explain before we get to the numbers. Most National Weather Service Cooperative observers, of which there are several dozen in New Jersey, take their daily observations in the 7-8 AM time range. So does nearly every NJ CoCoRaHS observer. These observations are recorded for the calendar day at hand, thus a day's weather records are complete as of the observation time. This means that any precipitation that occurs after the daily observation gets recorded the next morning (day). This is something that must be understood when evaluating daily precipitation reports, however, it does not make any difference in monthly totals except on the first and last day of the month. One of these exceptions occurred, in a big way, in April…or was it May?! Torrential rain fell during the daylight hours into the evening of April 30, part of an event that began lightly during the daylight hours of the 29th and ended just after observation time on the morning of May 1st (yes, meaning May 2 observations also were involved in storm totals). What up until then had been a somewhat dry April suddenly became a wet month…if you waited until midnight to take your observations. And believe it or not, some COOP stations do have observations taken at midnight. Confused? Can't blame you…

Heavy rain and flooding plague NJ residents

May 1, 2014 - 6:20pm -- Mathieu Gerbush

Flooding photo

Copious moisture streaming across a slowly advancing warm front resulted in a period of heavy rain across the Garden State, with most of the rainfall occurring on April 30th. The entirety of NJ north of Cape May County was deluged with more than 2.00" of rain, with a large area of greater than 4.00" totals extending from southwest to northeast along the entire span of the state. In particular, the area from western Salem, Gloucester, Camden, Burlington and Monmouth counties north up to roughly I-80 were socked with 4.00"-5.00", with some localized pockets of greater than 5.00". CoCoRaHS stations in Robbinsville Twp (Mercer County) and Matawan (Monmouth) reported the highest totals in the state, with 6.02" and 5.59", respectively. Stations in Medford Twp (Burlington County; 5.44"), New Brunswick (Middlesex; 5.39"), Westfield (Union; 5.32"), and Maplewood Twp (Essex; 5.25") also measured among the heaviest totals in NJ. On the low side, stations in Cape May County such as West Cape May (0.90"), Middle Twp (1.05"), Dennis Twp (1.27"), and Wildwood Crest (1.29") missed out on the heaviest rain.

Amid dry and windy conditions, wildfires rip through portions of South Jersey

April 24, 2014 - 2:07pm -- Adam Rainear

Wildfire photo

April showers typically bring May flowers, but when they fail to arrive in abundance and bundled with low humidity and gusty winds, wildfires become a major risk.

Just such a scenario unfolded across New Jersey experienced on Thursday April 24. Low dew points, combined with winds gusting over 30 mph, prompted the National Weather Service to issue Red Flag warnings across nearly all of the state both Wednesday and Thursday. Such warnings indicate a high risk for wildfires in wooded areas and grasslands. Unfortunately, fires did erupt in scattered locations around the state, with several large wildfires in Ocean and Cumberland counties.

Winter refuses to relinquish its grip on the Garden State: March 2014 Summary

April 5, 2014 - 12:00am -- Dave Robinson

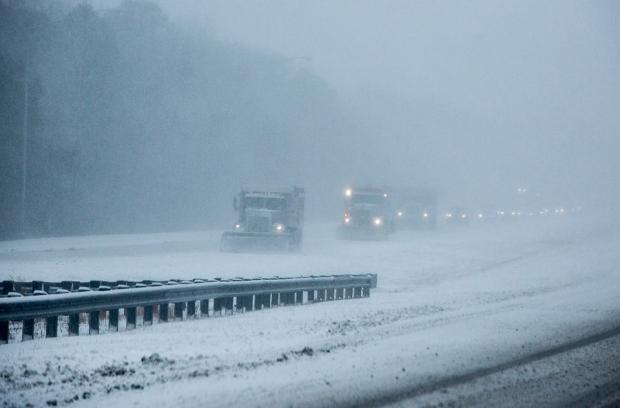
March 2014 snow photo

One of the most disruptive winters in recent memory continued to deliver cold weather throughout New Jersey during March. Three snow events brought over 20" of snow to Cape May County, yet failed to bring more than flurries to northern counties. The statewide average monthly temperature of 35.3° was 5.8° below normal. Thus March ranked as the 11th coldest since statewide records commenced in 1895 (Table 1). Rain and melted snow for the month averaged 4.11". This is 0.12" below normal and ranks as the 55th wettest of the past 120 Marches. Aside from the southern snows, the bulk of the precipitation fell in a soaking storm at month's end.

Relentless Winter: February 2014 Summary and Winter 2013/14 Summary

March 4, 2014 - 12:00am -- Dave Robinson

Snow Cover Map

One of the more disruptive winters in recent decades continued during February, erasing the hopes of many for an early spring. Averaged across New Jersey, the monthly temperature of 29.5° was 4.3° below normal. This made for the 35th coldest February over the past 120 years and the coldest since 2007. Temperatures ranged from a low of -18° at Walpack in snow covered Sussex County valley on the 11th and 12th to a high of 67° at several southern locations on the 21st. The statewide average precipitation of 5.26" made for the 20th wettest February on record. This includes both rainfall and the liquid equivalent of frozen precipitation, and is 2.40" above normal. Snowfall averaged 21.9" across the state, which is 13.9" above normal and ranks as the 7th snowiest of the past 120 Februaries.

Cold and Snow: January 2014 Summary

February 1, 2014 - 12:00am -- Dave Robinson

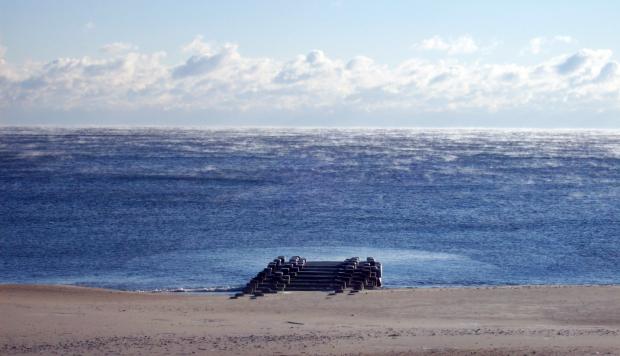
Sea smoke photo

The year began where 2013 left off, with the jet stream in an amplified, progressive pattern that resulted in frequent, pronounced fluctuations in temperature and multiple precipitation events. By late month, the pattern slowed, but remained amplified, locking NJ into over a week of bitter cold conditions. The statewide average temperature for January was 26.1°, which is 5.1° below the 1981-2010 average and ranks as the 17th coldest since 1895 (120 years). It was the coldest January since 2004. Precipitation in the form of rain, freezing rain, and melted snowfall averaged 3.09". This is 0.39" below normal and ranks as the 57th driest. Snowfall averaged 17.7", which is 10.6" above normal and ranks at the 8th snowiest January on record.

An Active Pattern: December and 2013 Annual Summary

January 1, 2014 - 12:00am -- Dave Robinson

Snowfall totals map from December 8th

The final month of 2013 proved to be a rather volatile one in the weather department. A smorgasbord of conditions included biting cold, record warmth, four snow events, and several soaking rainstorms. The statewide average temperature of 36.2° was 0.6° above normal, making it the 46th mildest December dating back 119 years to 1895. Not only were there major day-to-day fluctuations in temperature, as on several occasions temperatures varied by more than 40° from north to south Jersey. Precipitation in the form of rain and melted snow averaged 4.91" across NJ. This is 1.00" above normal and is the 26th wettest on record. Snowfall averaged 9.2", which is 4.3" above normal and the 31st snowiest December.

A December Warm Spell for the Record Books

December 24, 2013 - 12:00am -- Dave Robinson

Temperature map

It wasn't just chestnuts that were roasting in New Jersey several days before Christmas this year. In fact it may be that coal noses on rapidly shrinking snowmen were igniting as a snowy spell from the 8th to 18th quickly transitioned to some unusually warm conditions.

Woodbine (Cape May County), Toms River (Ocean), and Berkeley Township (Ocean) shared top honors on Sunday the 22nd when the thermometer topped out at 73°. Maximum temperatures reached from 70° to 72° at 22 of the 55 NJ Weather and Climate Network stations. Only High Point Monument (Sussex), Hope (Warren), and Harvey Cedars (Ocean) managed to stay out of at least the 60s on the 22nd, with all three locations reaching 59°. Daily records were established at a number of long-term observing stations. For instance highs at Newark (Essex) on the 21st and 22nd of 64° and 71° beat former daily records by 3° and 6°, respectively.

Pages

Subscribe to RSS - News