
Early this past summer, we reported on the potential impacts of a developing El Niño event in the tropical Pacific on summertime weather in New Jersey. While El Niños can impact the weather worldwide, we found that New Jersey's weather doesn't fluctuate with an El Niño event. This year's summer (June-August) proved to be rather comfortable, with the statewide average temperature 0.8° below the 1981-2010 average , and precipitation 0.26” above the 1981-2010 average. These mild conditions replicated what we expect out of an El Niño summer.
Now we’re back to tell you the story for the fall. Although an El Niño hasn’t been confirmed, forecasters are becoming more confident about an El Niño developing in the upcoming months. The forecasters, a cohort of NOAA scientists, claim there is a 66% chance for an El Niño developing during November 2014 – January 2015 timeframe. For those of you who aren’t familiar, an El Niño occurs when warmer-than-average waters start to form in the eastern Pacific Ocean, specifically near the equatorial latitudes. You can see this pictorially explained in Figure 1, with the area of warm (red) waters heading towards South America. Easterly winds (blowing from the east) typically move warmer water to the western Pacific (near Indonesia), permitting cooler water to upwell to the surface in the east (near South America). When these winds are weaker, or if they reverse direction, the warm water stays in the eastern Pacific. This difference in sea surface temperatures and winds creates a new dynamic between the ocean and atmosphere, distinctly affecting weather patterns across the world. No two El Niño events are alike; they vary in magnitude and location of the largest temperature anomalies. El Niño events can be classified as strong, moderate, or weak.

Figure 1. Atmosphere and Ocean Interaction during an El Niño.
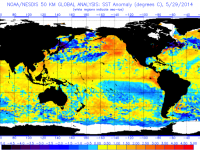
Scientists monitor the oceans through a network of buoys and satellite data in order to forecast El Niño events. Figure 2 shows sea surface temperature anomalies globally, a variable closely examined by forecasters. The picture shows mostly positive anomalies in the eastern pacific, which is an indicator of an El Niño.

Figure 2. Sea Surface Temperature Anomalies for October 13th, 2014.
In order for an El Niño event to be declared, certain oceanic temperature thresholds need to be met over 3-month periods, for 5 consecutive periods. For instance, the temperature index that NOAA uses needs to be above a certain value for the 3 month seasons of March-April-May, April-May-June, and so forth until July-August-September. Confidence was high in early summer that an El Niño would occur, but the summertime anomalies weren’t large enough to declare an El Niño. Interestingly enough, we are at the same confidence (66%) as we were in the early summer. NOAA has launched a blog to discuss this ongoing event, and you can find a more in-depth breakdown there.
Much as conducted for the summer , we have evaluated potential linkages between El Niño and NJ weather for the fall. Time series of statewide temperature and precipitation were generated for the meteorological fall season (September-November) for the 63 years between 1951 and 2013 (Figures 3 and 5 below). Fall conditions during 18 El Niño years were then analyzed relative to the full period distribution of these variables. The percentage of El Niño fall seasons within the lower, middle, and upper terciles (thirds) of the 63 falls are plotted in Figures 5 (temperature) and 6 (precipitation) below. The magnitude of the potential El Niño remains unknown, so this analysis generalizes over all strengths.
Fall temperatures in New Jersey are most often close to average or on the cool side of the ledger during an El Niño event. Some 44% of El Niño fall seasons are within the middle tercile of temperatures (between 54.0° F and 55.5° F). This is followed by 39% of El Niños in the coolest tercile (below 54.0 ° F). This leaves only 17% in the warmest tercile (above 55.5° F). Two of New Jersey’s coolest falls (within the lower 10%) since 1951 occurred during an El Niño year, while there were no El Niño falls within the warmest 10%.

Figure 3. Time series of New Jersey average fall temperatures from 1951-2013. Red bars indicate years with an El Niño event. Black line indicates 5-year moving average.

Figure 4. Distribution of average fall temperatures from 1951-2013, representing percentage of El Niño falls residing within each tercile.
During El Niño falls, 39% of years were in the middle tercile of seasonal precipitation, which is above 9.23" and below 12.13". Another 39% of years were in the lowest tercile, which is below 9.23". Only 22% of El Niño falls are within the historic wettest upper tercile. However, it is interesting to note that three El Niño falls had abundant enough precipitation to sit within the top 10% of all years, while very dry El Niño falls were less common, as only one of them was in the bottom 10%.

Figure 5. Time series of New Jersey average fall precipitation from 1951-2013. Red bars indicate years with an El Niño event. Black line indicates 5-year moving average.

"Figure 6. Distribution of average fall precipitation from 1951-2013, representing percentage of El Niño falls residing within each tercile.
Our analysis shows that while New Jersey’s fall seasons have not been affected in any major way by an El Niño event underway or getting underway, there is some tendency to have both average or cooler-than-average temperatures and average or lower-than-average precipitation. Warm and wet falls are less likely than the overall long term averages would suggest. As an El Niño event may eventually come to fruition, later this fall we will roll out our evaluation of New Jersey El Niño winters.
Below are more links for further reading:
Current Analysis - http://www.cpc.ncep.noaa.gov/products/precip/CWlink/MJO/enso.shtml
A more in-depth explanation of El-Nino – http://www.pmel.noaa.gov/tao/elnino/el-nino-story.html
FAQ about the El-Nino - http://www.cpc.ncep.noaa.gov/products/analysis_monitoring/ensostuff/enso...
More forecasting tools - http://iri.columbia.edu/our-expertise/climate/forecasts/enso/


 anomalies for July 20, 2015.")
 on October 5. (Photo by <a href=\"http://www.timsharkey.com/blog/2015/10/brick-beach-steel-wall-w/20-feet-exposed-during-nor-easter\" target=\"_blank\">Sharkey-Images</a>).")