Overview
If it is weather variety you enjoy, April certainly must have proved rather satisfying. Atmospherically, this was expressed by a cool, wet first half of the month and a warm, dry second half. When all was totaled and averaged, the full month emerged with above-normal temperatures and close-to-normal precipitation. Toss in one northern snow event, considerable wind, lingering drought in some areas, and a major Pinelands wildfire, and there was quite a potpourri of conditions.
Looking first at precipitation, the statewide average of rain and melted snowfall was 3.72”. This was 0.02” above the 1991–2020 normal and ranked as the 62nd wettest April dating back to the start of statewide records in 1895. Conditions varied within the state as seen by the roughly five-zonal pattern of totals (Figure 1). Each of the three climate divisions came in close to normal, with the north at 3.90” (exactly average, 58th wettest/73rd driest), south 3.64” (+0.06”, 58th wettest/74th driest), and coastal 3.31” (-0.24”, 71st wettest/61st driest). Almost all the precipitation fell in the first half of the month. This is evident in Figures 2 and 3, which show, respectively, plentiful rain and the near absence of rain. It should be noted that rain that fell during the daylight hours of March 31st until early on April 1st is mostly factored into these April totals and figures. The reason for this is explained in several recent months with similar last-day-of-the-month conditions.
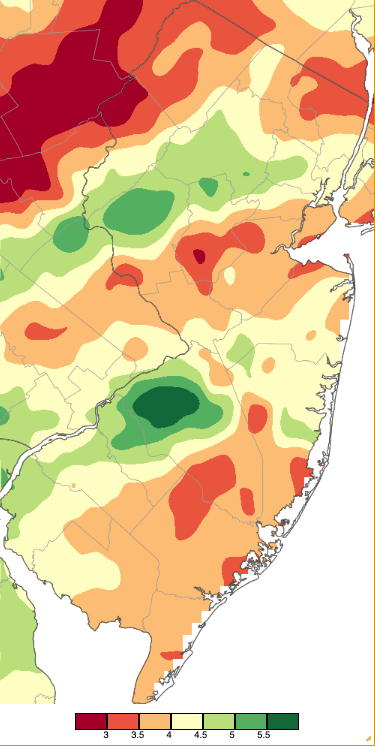
Figure 1. April 2025 precipitation across New Jersey based on a PRISM (Oregon State University) analysis generated using NWS Cooperative, CoCoRaHS, NJWxNet, and other professional weather station observations from 8 AM on March 31st to 8 AM on April 30th. Note the scale in inches at the bottom of the map. Totals range from 2.50”–2.99” (dark red) to 5.50”–5.99” (dark green).
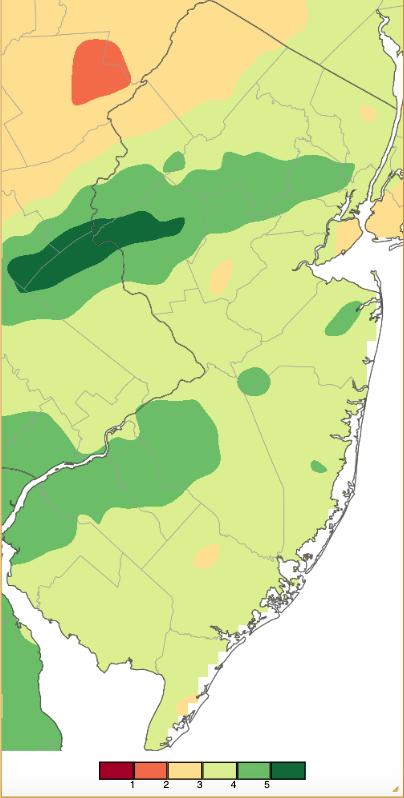
Figure 2. April 1–15, 2025, precipitation across New Jersey based on a PRISM (Oregon State University) analysis generated using NWS Cooperative, CoCoRaHS, NJWxNet, and other professional weather station observations from 8 AM on March 31st to 8 AM on April 15th. Note the scale in inches at the bottom of the map. Totals range from 0.00”–0.99” (dark red) to 5.50”–5.99” (dark green).
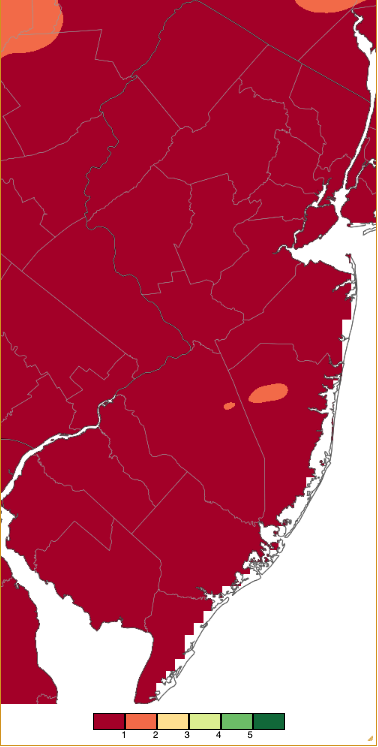
Figure 3. April 16–30, 2025, precipitation across New Jersey based on a PRISM (Oregon State University) analysis generated using NWS Cooperative, CoCoRaHS, NJWxNet, and other professional weather station observations from 8 AM on April 15th to 8 AM on April 30th. Note the scale in inches at the bottom of the map. Totals range from 0.00”–0.99” (dark red) to 5.50”–5.99” (dark green; same legend as Figure 2).
April snowfall occurred in a single event that will be discussed below. This resulted in a statewide average of 0.3”, which is 0.2” below normal and ranks as the 37th snowiest April back to 1895. The northern snow division averaged 1.2” (+0.4”, 28th snowiest), while the central and southern divisions did not record snowfall (0.6” and 0.4” below normal, respectively), situations that have occurred during numerous past Aprils.
The statewide monthly average temperature was 53.3°. This was 1.8° above the 30-year mean and ranked as the 12th mildest (3-way tie; Table 1). Nine of the 16 mildest Aprils in the past 131 years have occurred over the past 23 years. The average high was 64.3° which was 1.6° above normal and ties as the 20th warmest. The average low was 42.4° which was 2.1° above normal and ranks 7th warmest. The north averaged 51.7° (+1.8°, 11th mildest), the south 54.4° (+1.8°, 12th mildest), and coast 53.7° (+2.0°, 9th mildest). Following the theme of the report, the first half of the month averaged from near normal to about 1° below normal while the second half ran 2°–3° above normal.
| Rank | Year | April Avg. Temp. |
|---|---|---|
| 1 | 2017 | 55.9° |
| 2 | 2010 | 55.5° |
| 3 | 2023 | 55.4° |
| 4 | 1921 | 55.3° |
| 5 | 2019 | 54.8° |
| 6 | 1941 | 54.4° |
| 7 | 2011 | 53.9° |
| 7 | 2002 | 53.9° |
| 9 | 1994 | 53.7° |
| 10 | 1960 | 53.6° |
| 11 | 2006 | 53.4° |
| 12 | 2025 | 53.3° |
| 12 | 1945 | 53.3° |
| 12 | 1913 | 53.3° |
| 15 | 2008 | 53.0° |
| 15 | 1981 | 53.0° |
Table 1. The 16 mildest Aprils across NJ since 1895.
Precipitation and Storms
Monthly precipitation at CoCoRaHS stations was as abundant as 6.26” in Medford Township (Burlington County). This was followed by Holland Township (Hunterdon) 5.88”, Madison (Morris) 5.79”, Peapack-Gladstone (Somerset) 5.75”, and Mount Laurel Township (Burlington) 5.70”. On the low end, a Franklin Township (Somerset) location caught just 3.05”, followed by Manville (Somerset) 3.11”, Hillsborough Township (Somerset) 3.16”, Hammonton (Atlantic) 3.17”, and Middletown Township (Monmouth) 3.18”.
Looking at the month in two halves, the 1st–15th saw Holland Township catch 5.66”, with the 16th–30th receiving just 0.22”. The split was 5.44”/0.35” in Madison and 5.30”/0.45” in Peapack-Gladstone. The wettest locations in the second half of the month included Medford Township with 1.34” after seeing 4.85” in the first half, Manchester Township (Ocean) 1.28” in that latter half and 3.22” earlier, and Moorestown Township (Burlington) with 1.15” after 4.24” in the first half.
The first event of the month was the storm from March 31st to early April 1st. The precipitation coverage is shown in Figure 4. As stated in the March report: “Accompanied by frequent lightning and thunder in many locations, totals amounted to 2.17” at Hackettstown (Warren), White Township (Warren) 2.13”, Mansfield Township (Burlington) 1.98”, Washington Township (Warren) 1.88”, Oxford Township 1.85”, Greenwich Township (Warren) 1.81”, Liberty Township (Warren) 1.81”, and 1.00”–1.78” at 151 sites (267 reports).” Winds gusted to 49 mph at High Point Monument (HPM; Sussex), Wantage (Sussex) 42 mph, and 40 mph at both Little Egg Harbor Township (LEHT; Ocean) and Vernon Township (Sussex).
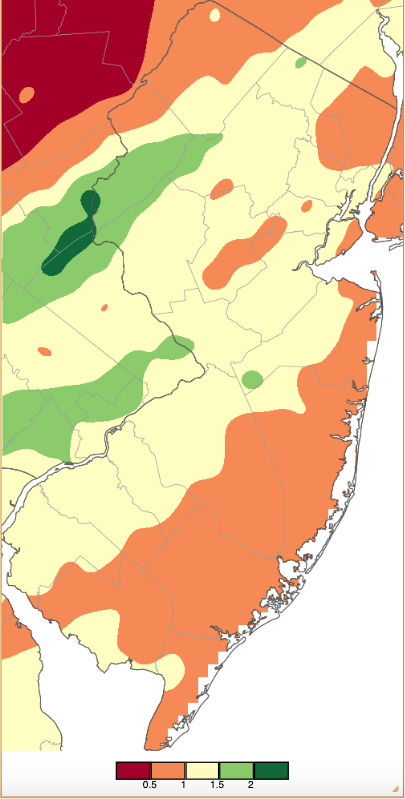
Figure 4. Precipitation across New Jersey from 8 AM on March 31st through 8 AM April 1st based on a PRISM (Oregon State University) analysis generated using NWS Cooperative, CoCoRaHS, NJWxNet, and other professional weather station observations. Note the scale in inches beneath the map.
Rain resumed late on the 2nd and continued off and on until the morning of the 4th. Some thunderstorms erupted early on the 4th in central and southern counties. Top totals included 1.14” in Wenonah (Gloucester), Lacey Township (Ocean) 1.22”, Jackson Township (Ocean) 1.12”, with 11 stations from 1.00”–1.11”, and 74 from 0.50”–0.99” (out of 277 total CoCoRaHS reports). Winds gusted to 46 mph at Vernon Township on the 3rd and 42 mph in West Deptford (Gloucester) on the 4th.
Heavy rain embedded in thunderstorms moved across a narrow swath of central and north Jersey from the afternoon of the 5th into the early hours of the 6th (Figure 5). Three stations in Clinton Township (Hunterdon) received 2.32”, 2.10”, and 2.01”, Peapack-Gladstone caught 2.27”, Lebanon (Hunterdon) 2.14”, Bernardsville (Somerset) 2.04”, 34 stations 1.00”–1.99”, and 31 sites 0.50”–0.99” (249 stations reported).
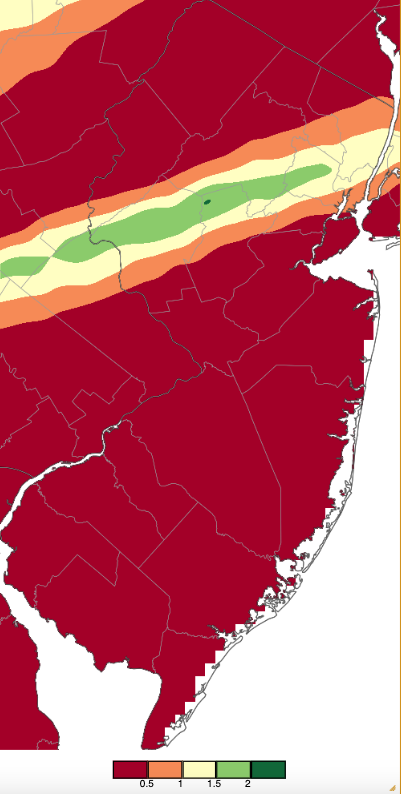
Figure 5. Precipitation across New Jersey from 8 AM on April 5th through 8 AM April 6th based on a PRISM (Oregon State University) analysis generated using NWS Cooperative, CoCoRaHS, NJWxNet, and other professional weather station observations.
The rain scene shifted to the south from early on the 7th through early on the 8th (Figure 6). Top totals included Maurice River Township (Cumberland) 1.69”, two Somers Point (Atlantic) stations with 1.52” and 1.49”, Ventnor City (Atlantic) and Woodbine (Cape May) each with 1.44”, 18 sites from 1.00”–1.40”, and 34 from 0.50”–0.99” (256 observations in total). Winds on the 8th gusted to 58 mph at Lower Alloways Creek Township (LACT; Salem), Vernon Township 48 mph, and from 40–45 mph at nine stations.
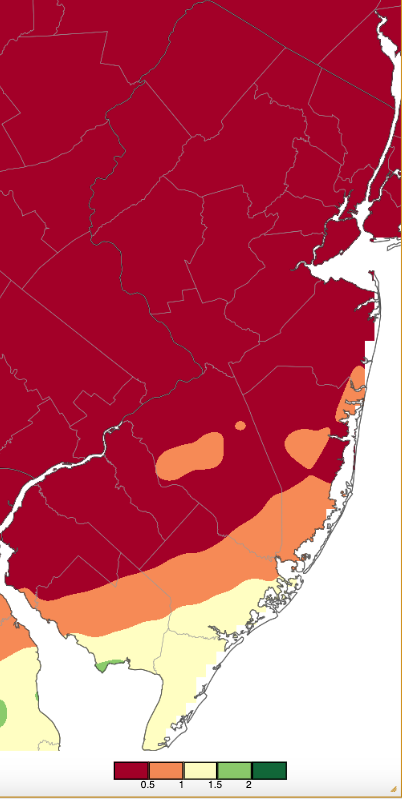
Figure 6. Precipitation across New Jersey from 8 AM on April 6th through 8 AM April 8th based on a PRISM (Oregon State University) analysis generated using NWS Cooperative, CoCoRaHS, NJWxNet, and other professional weather station observations.
The major storm of the month began with pre-dawn showers on the 11th. Precipitation coverage and intensity increased throughout the state during the afternoon and overnight hours before ending with some drizzle into the afternoon of the 12th. This included snow and sleet falling in the overnight hours in the northern half of the state, most notably at higher elevations. Rain and melted snow from the event amounted to as much as 2.13” in Point Pleasant Beach (Ocean), Salem (Salem) 2.09”, Jefferson Township (Morris) 2.05”, Millville (Cumberland) 2.02”, Medford Township 2.01”, Medford Lakes (Burlington) 2.00”, and 1.00”–1.99” at 260 of the 274 reporting stations (Figure 7). Middle Township (Cape May) received the least with 0.79”. The storm brought gusts on 43 mph at LEHT and 40–42 mph at three other sites on the 11th. The 12th saw gusts of 51 mph at LEHT, Atlantic City Marina (Atlantic) 45 mph, and two sites at 40–41 mph.
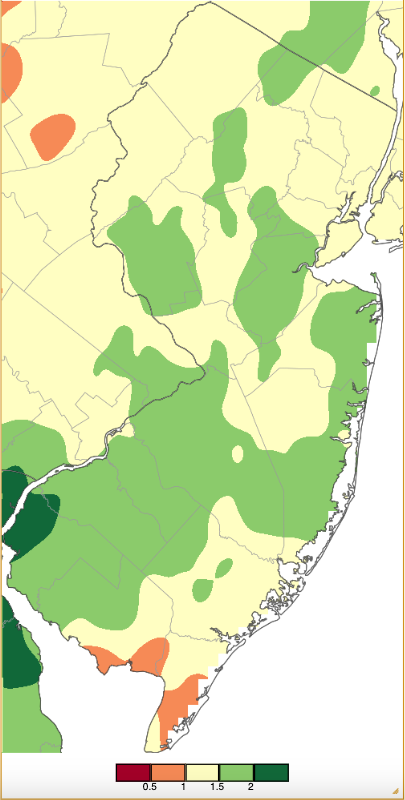
Figure 7. Precipitation across New Jersey from 8 AM on April 10th through 8 AM April 13th based on a PRISM (Oregon State University) analysis generated using NWS Cooperative, CoCoRaHS, NJWxNet, and other professional weather station observations.
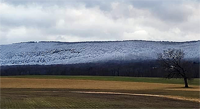
Measurable snow fell in seven counties with four of them seeing an inch or more (Figure 8). Top totals observed in the higher elevations of Sussex County included High Point Monument 6.0”, High Point Ranger Station 5.1”, Sparta Township 4.5”, and Vernon Township (Highland Lakes) 4.4” (with 2.5” at a lower elevation station). The most observed in the three other inch-plus counties included Green Pond (Morris) 3.1”, West Milford (Passaic) 1.8”, and Frelinghuysen Township (Warren) 1.4”.
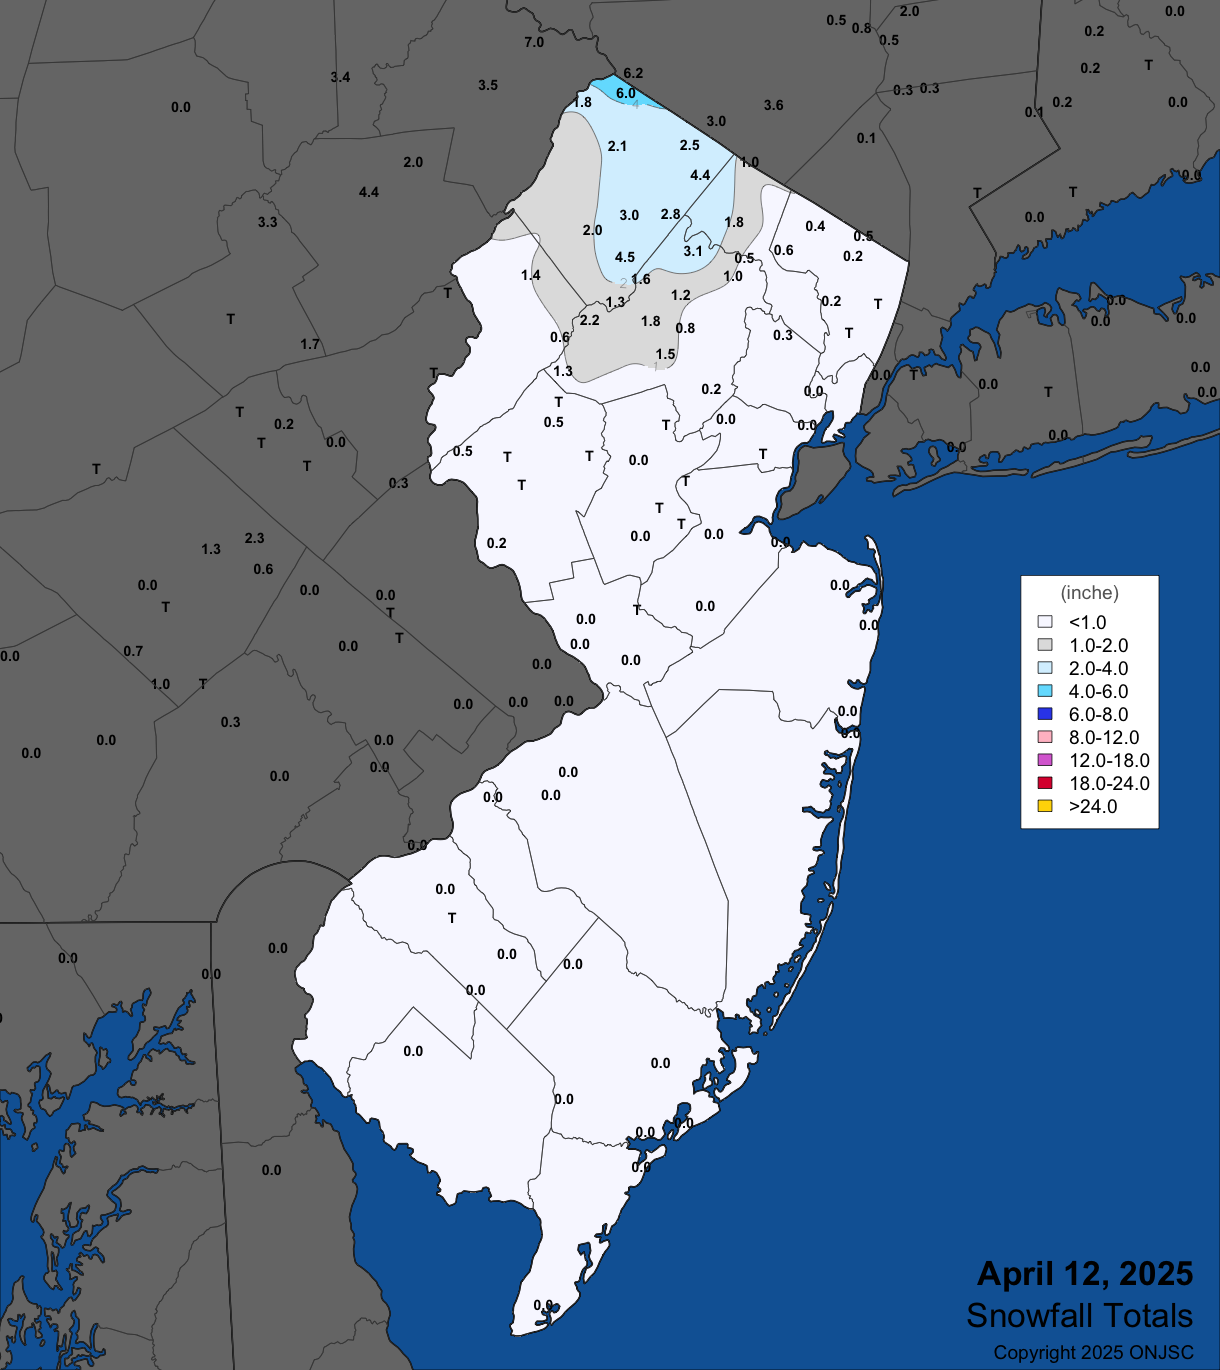
Figure 8. Snowfall on April 12th. Observations are from CoCoRaHS, NWS Cooperative Observer, NWS Trained Spotters, and reports from the North Jersey Weather Observers.
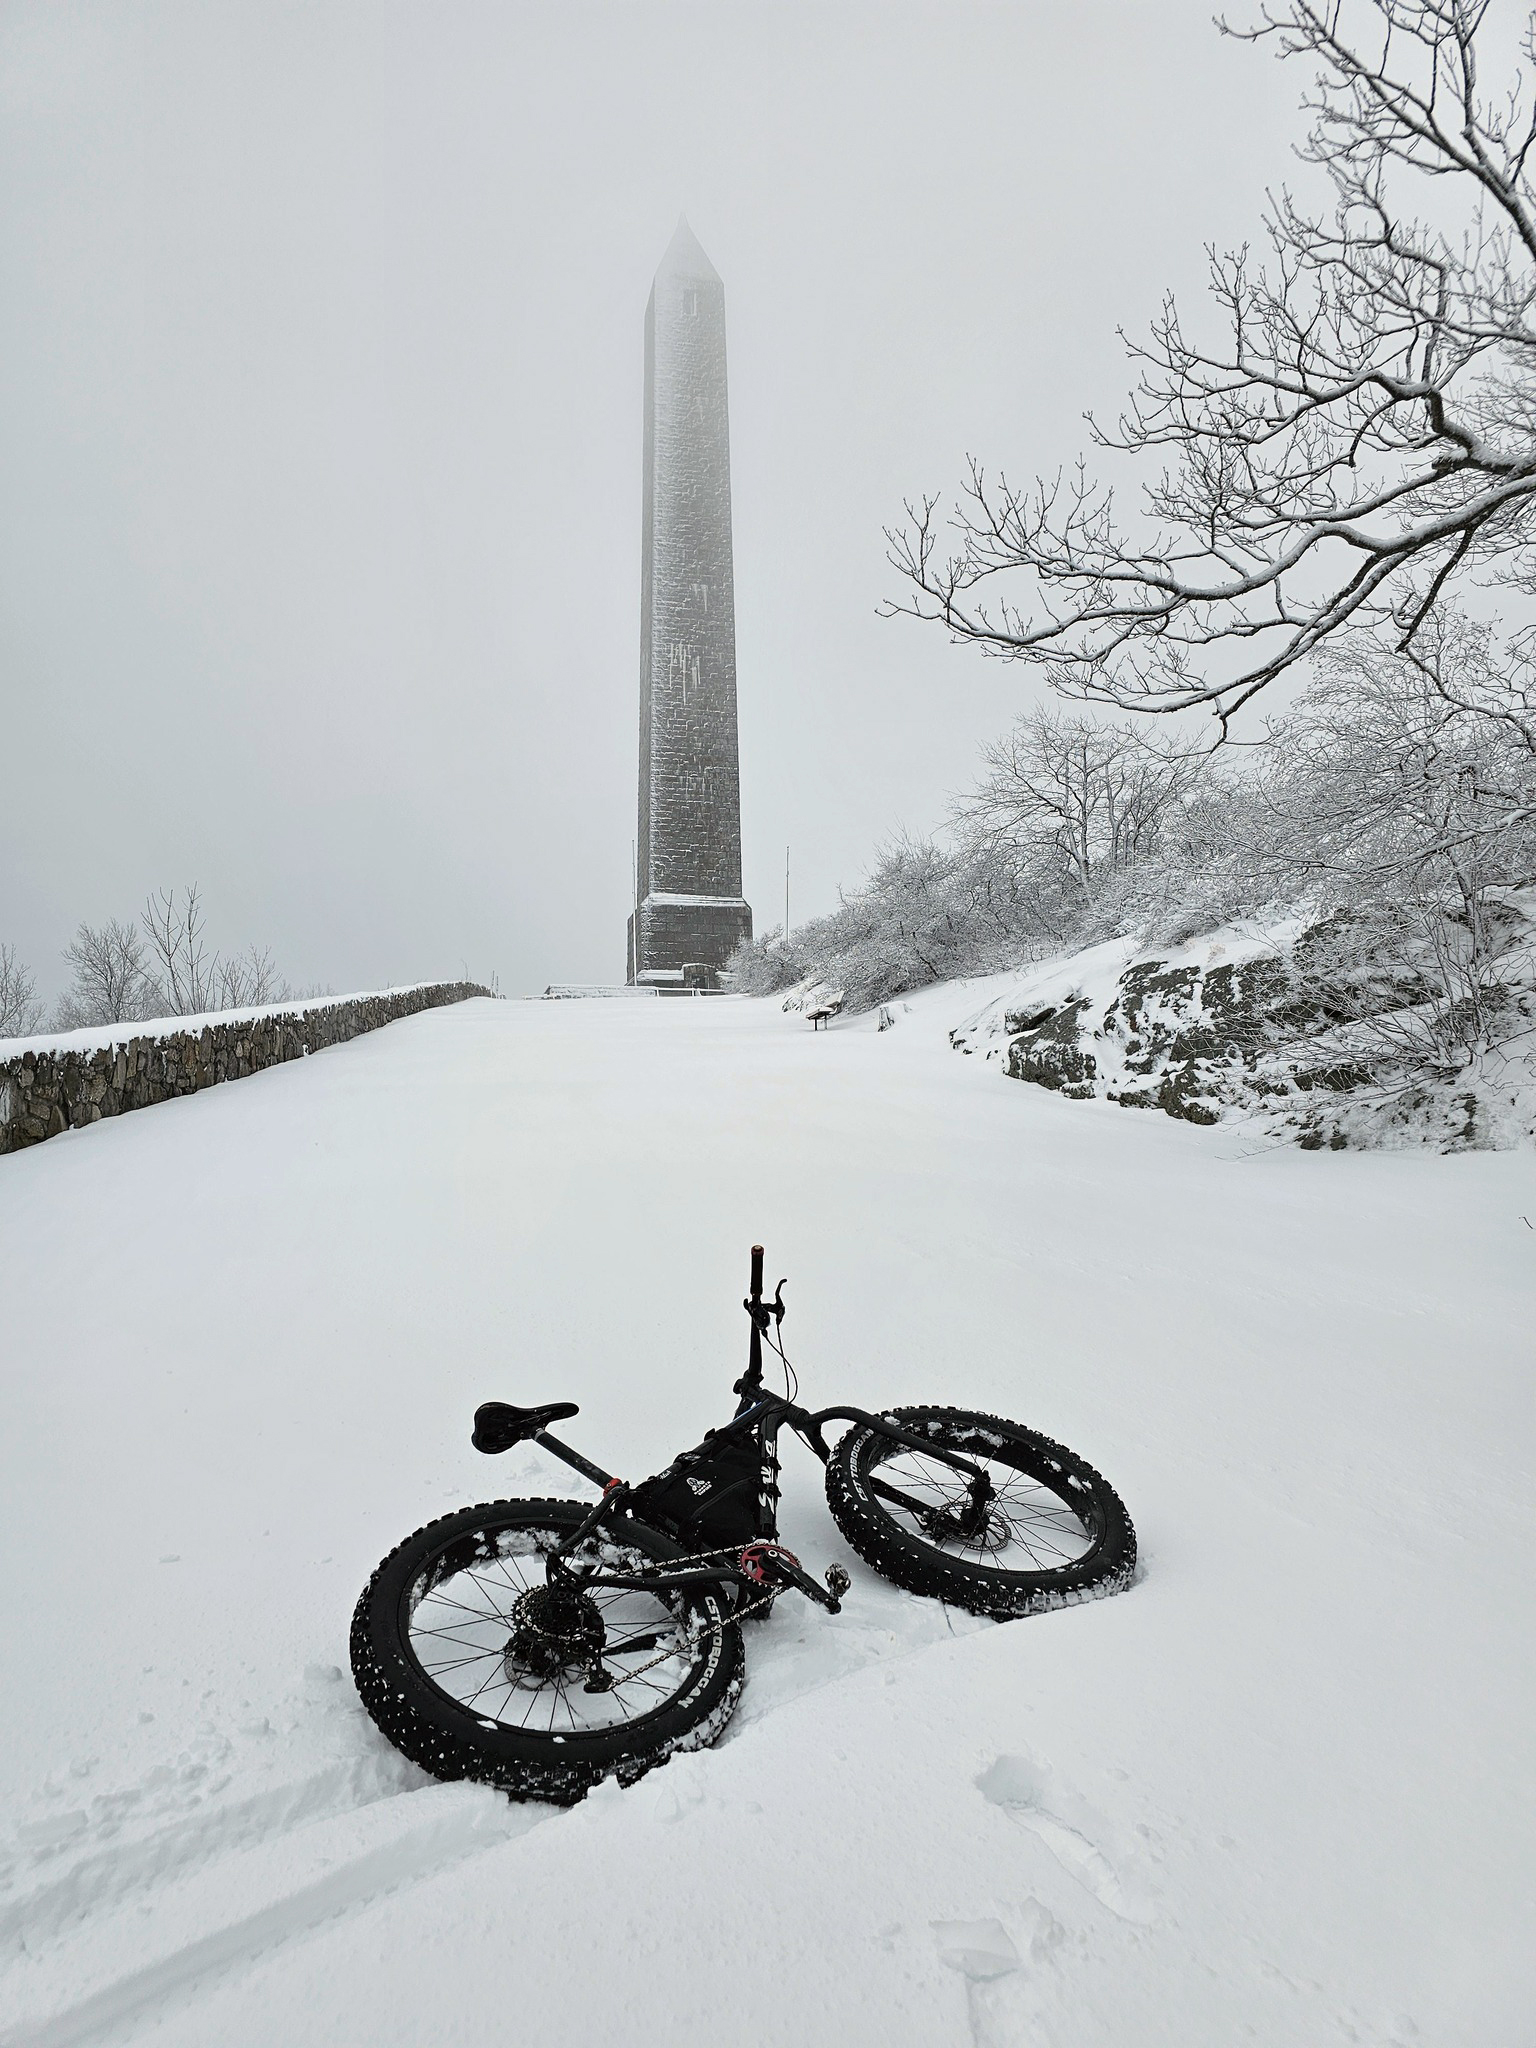
Figure 9. The six-inch snowfall at High Point Monument on April 12th (photo courtesy of Shawn Viggiano).
The 15th brought some quick-hitting thunderstorms just south of the New York border, which included small hail in Jefferson Township (Passaic). The absence of rainfall was the story until late on the 25th into the evening of the 26th when rain fell across the entire state. The heaviest totals were found in Burlington County where Medford Township caught 1.34”, Fort Dix 1.30”, Columbus 1.17”, and Willingboro Township 1.13”. Manchester Township (Ocean) saw 1.26”, while 52 locations reported 0.50”–1.04” and the lowest of 260 observations was 0.04” in Wildwood Crest (Cape May). Scattered thunderstorms accompanied the rain in locations ranging from Atlantic to Warren counties. Winds gusted to 42 mph at LACT and 41 mph at HPM on the 26th, with the 27th seeing gusts to 47 mph at LEHT and 40–44 mph at nine stations.
The month’s highest barometric pressure occurred on the 2nd, with values from 30.45”–30.55”. Lowest pressures were found on the 15th at 29.35”–29.50”. Most of the 12 days with winds gusting to 40 mph or higher at one or more NJWxNet station have been mentioned previously. However, there was a windy period from the 15th to 20th that has yet to be mentioned. The desiccating power of the wind assisted in setting the stage for the two major wildfires discussed in the next section. This included gusts on the 15th up to 53 mph in LACT, Pennsauken (Camden) 50 mph, HPM and Fortescue (Cumberland) each 49 mph, and 40–44 mph gusts at 17 other NJWxNet stations. HPM and LEHT gusted to 43 mph and Pennsauken 40 mph on the 16th, and HPM 41 mph on the 17th and 43 mph on the 20th.
As in March, the US Drought Monitor of April 29th showed improvement from conditions at the start of the month (Figure 10). Drought and abnormally dry designations disappeared in central NJ, as did extreme drought (D3) in the south, and conditions were deemed just abnormally dry (D0) or moderate drought (D1) in most of the north and south. Due to slowly-recharging ground water, D2 was found in the prior D3 area of the south, while portions of the northwest kept missing out on the heaviest precipitation thus remained at D2. The NJ Department of Environmental Protection continues with a Drought Warning for the entire state.
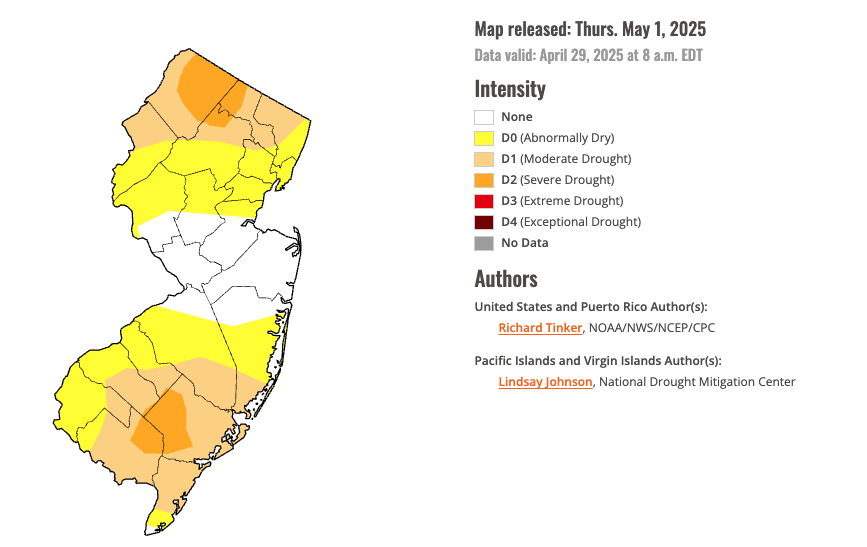
Figure 10. U.S. Drought Monitor map of conditions in NJ as of April 29, 2025.
Wildfire
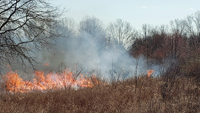
April is known to be the most wildfire-plagued month of the year in New Jersey, particularly in the Pinelands. With debris littering the forest floor from the fall and winter, returning warmth, frequent low humidity, spring winds blowing, full green up yet to arrive to enrich trees and grasses with moisture, and an extended period of dry weather conditions, the fire threat can become volatile. Such was the case in the Peaslee Wildlife Management Area near Vineland (Cumberland) on the 18th. The result was a 1,300-acre wildfire that burned for several days.
Unfortunately, dry conditions continued to persist. On the 22nd, several ignorant individuals set a bonfire that they failed to adequately extinguish, leading to an enormous wildfire (Figure 11). West winds gusting over 20 mph quickly contributed to the fire spreading to what eventually was approximately 15,300 acres, just outside the top ten largest New Jersey wildfires on record. Miraculously, and with the remarkable efforts of state and local fire fighters and other first responders, there were no deaths or major injuries reported. Unfortunately, a business went up in flames, but countless other structures were spared. Thousands were evacuated or on call to do so at a moment’s notice. Power was intentionally cut to several tens of thousands to protect all in the region. As the fire spread east and jumped the Garden State Parkway, smoke was clearly recognized by weather radar lofting out over the Atlantic (Figure 12). The size of the burn scar is clearly visible in satellite imagery, with those possessing knowledge of the region recognizing how close the fire came to inhabited areas (Figure 13).

Figure 11. Jones Road wildfire the evening of April 22nd (courtesy of NJ Forest Fire Service).
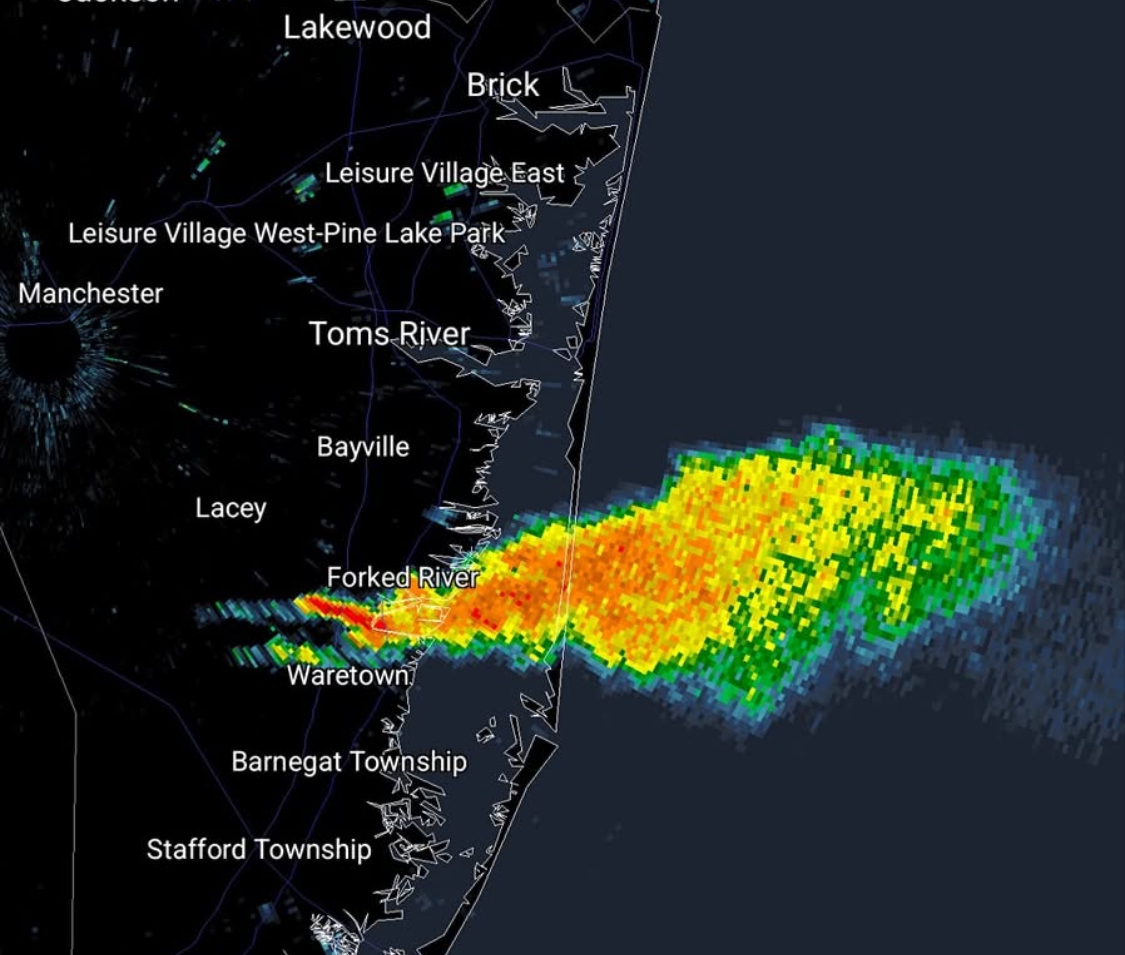
Figure 12. National Weather Service radar at 5:53 PM April 22nd detecting ash and smoke from the Jones Road wildfire.
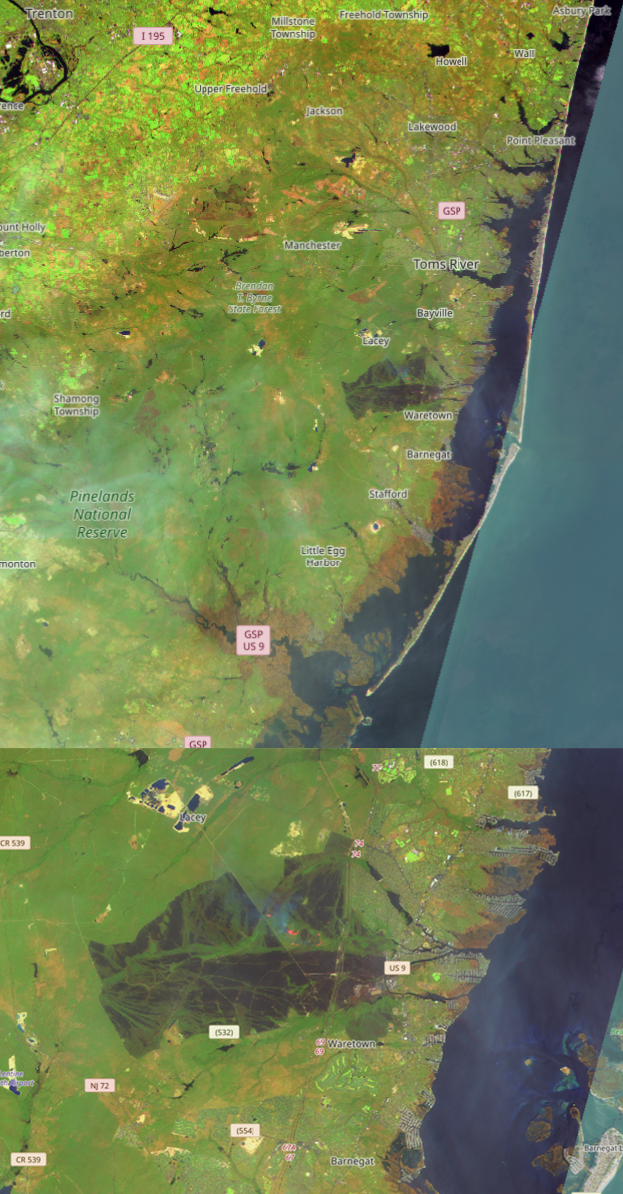
Figure 13. European Space Agency Sentinel 2 satellite image showing the extent of the Jones Road wildfire (black) on April 24th, 2025. Wide view is presented on top, with a zoomed-in view on the bottom.
Temperature
As expected in spring, there was a wide range of temperatures over the course of the month. Thirteen days experienced high temperatures of 75° or greater at one or of the 69 Rutgers NJ Weather Network stations, while 15 days saw lows of 32° or colder. Of the freezes, five days had lows of 25° or lower. This began with a low of 24° at HPM and Walpack (Sussex) on the 2nd, with 34 stations from 26°–32°. HPM again fell to 24° on the 8th, when 16 sites were 27°–32°. The 9th was the coldest morning of the month, including HPM at 20° and 63 stations from 22°–32° (Figure 14). West Cape May (Cape May) was least cold at 35°. Walpack fell to 25° on the 10th with 18 stations from 27°–32°. Of the five days with freezing temperatures in the second half of the month, the 18th found Walpack down to 25° and 19 locations from 27°–32°. Walpack rose to 74° that afternoon, for a 47° diurnal temperature range. The last freeze of the month was the 28th with Walpack at 29° and Pequest (Warren) 32°.
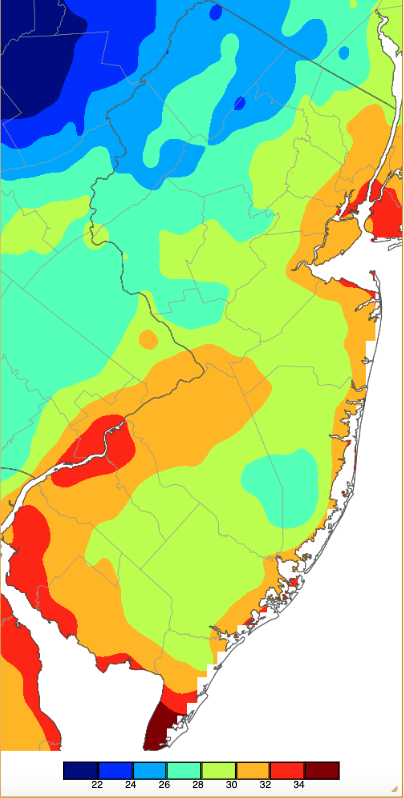
Figure 14. Minimum temperatures on April 9th based on a PRISM (Oregon State University) analysis generated using NWS, NJWxNet, and other professional weather stations. Note the 2° scale beneath the map.
Of the 13 days with highs of at least 75°, six made it to 80°. The first of these did not occur until the 19th and ultimately proved to be the warmest of the month (Figure 15). Berkeley Township (Ocean), Toms River (Ocean), and Woodland Township (Burlington) each rose to 88°. Fifty-six other NJWxNet stations reached 80°–87°. Southerly winds off Delaware Bay kept Fortescue coolest at 68°.
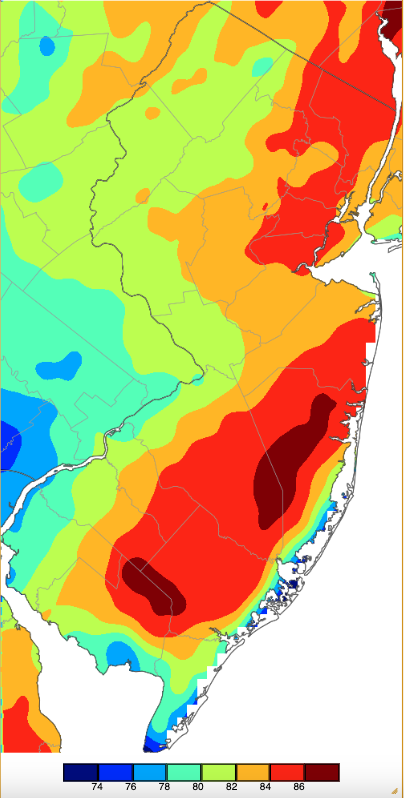
Figure 15. Maximum temperatures on April 19th based on a PRISM (Oregon State University) analysis generated using NWS, NJWxNet, and other professional weather stations.
Woodland Township reached 84° on the 22nd, with 40 sites from 80°–83°. Four locations hit 83° on the 24th when 28 others were from 80°–82°. The 25th again saw a high of 83°, this time at Fort Dix, with 19 locations from 80°–82°. Howell (Monmouth) and Sicklerville (Camden) topped out at 84° on the 29th, with 42 sites from 80°–83°. A sea breeze kept the high at Atlantic City Marina to just 61°. Egg Harbor Township (Atlantic) and Woodbine reached 84° on the 30th, with 23 stations from 80°–83°.
A few thermal oddities during April included a 49° diurnal range at Walpack on the 18th (74°/25°) and a range of 47° on the 28th (76°/29°). HPM recorded the overall coldest day of the month with a high of 35° and low of 24° on the 8th. More unusual were the low maximum temperatures across the state on the 12th. Again, HPM only rose to 35° while LACT and Greenwich (Cumberland) were least cool at 47°. Five stations only made it to 38° or 39°.
2024–2025 Snow Season
For snow lovers, the past snow season was most often a disappointing one. Statewide, the average snowfall was 15.9”. This was 9.4” below normal and ranks as the 30th least snowy of the past 131 seasons. The northern snow division (Warren-Morris-Essex counties northward) averaged 23.2” (-11.9”, 38th least snowy), the central division (Hunterdon-Somerset-Union-Middlesex-Monmouth-Mercer) averaged 15.0” (-13.4”, 23rd least snowy), and the southern division (Burlington-Ocean southward) averaged 12.6” (-6.0”, 38th least snowy).
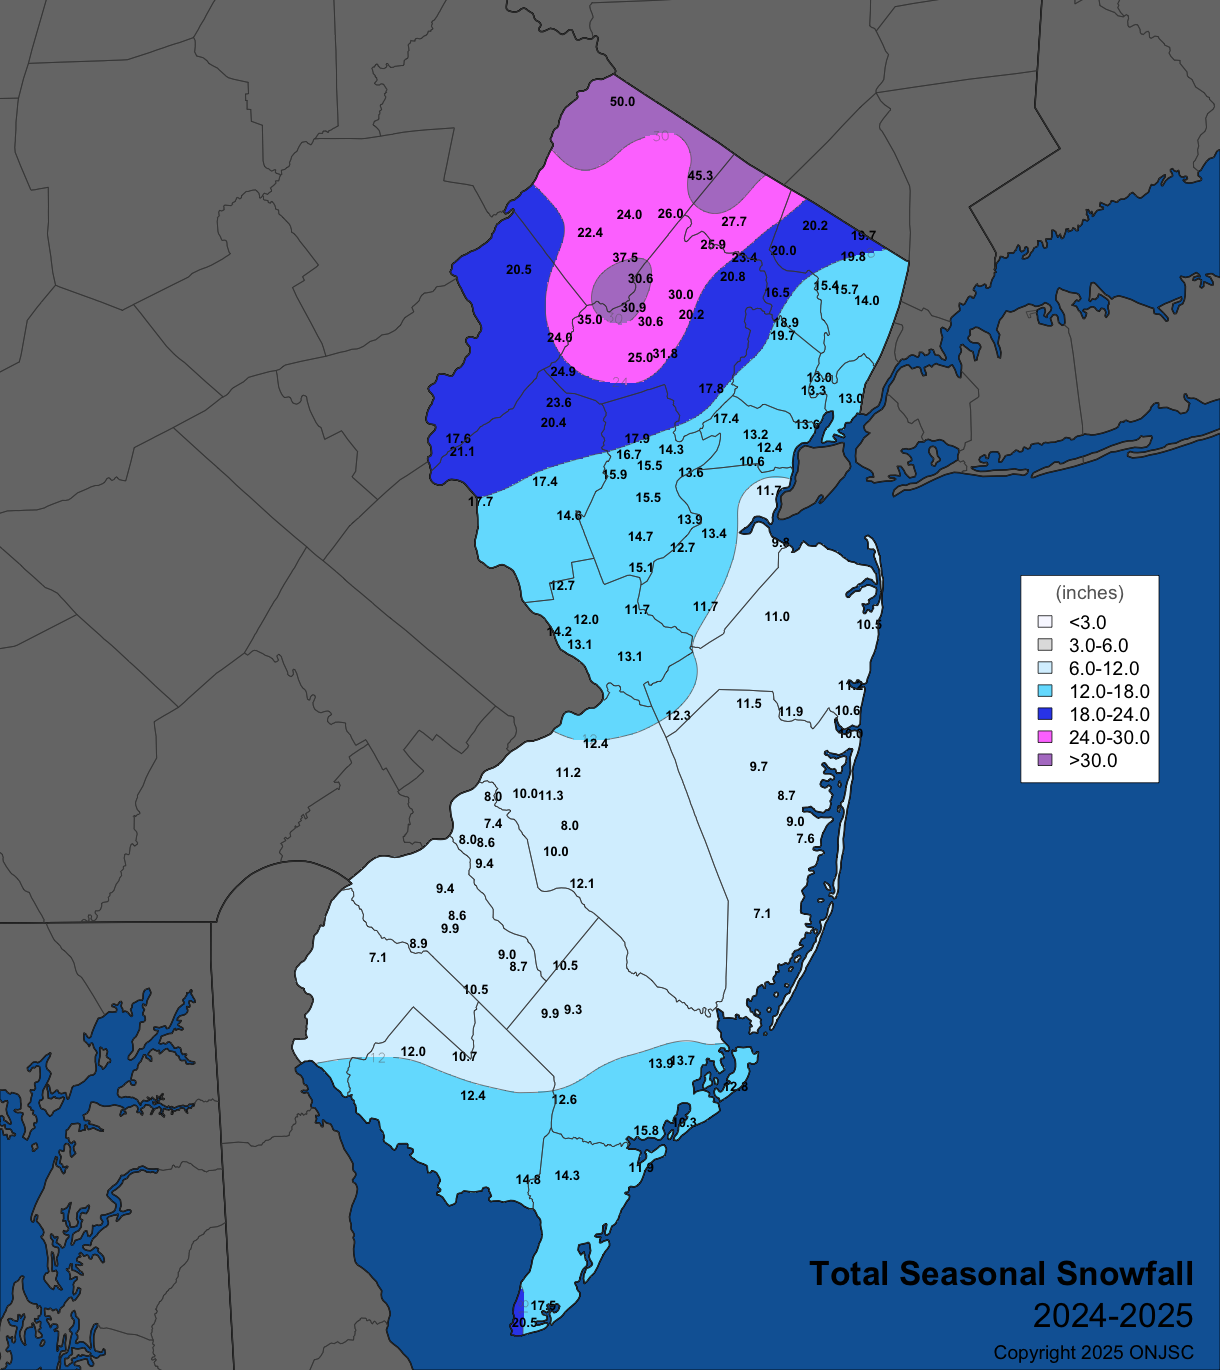
Figure 16. Seasonal snowfall (November 2024–April 2025). Observations are from CoCoRaHS, NWS Cooperative Observer, and North Jersey Weather Observers reports.
Over the course of the season, 11 events brought 2.0” or more to at least one NJ reporting location (CoCoRaHS, NWS Coop, NWS Spotter). The first on November 21st–22nd produced 20” at High Point Monument. This was the largest storm total of the season and brought this location 40% of its 50” seasonal snowfall, the top in the state. The last event was April 12th, as discussed earlier in this report. Table 2 breaks down each event by date, top total, the number of counties with one or more stations receiving measurable snow (at least 0.1”), and the number of counties receiving at least 1.0”. Five months were represented, with only March missing out between November and April. Five events had a top total exceeding 5.0”, while three had top totals of 2.0”–2.2”. From 6 to all 21 counties received measurable snow in the events and 4 to 20 had an inch or more in the events. Five counties recorded top event totals, led by Sussex County with five events (one of these tied with Warren County), followed by three in Cape May County. Morris had two, and Hunterdon and Warren each with one. Suppose you could say it was a bi-polar snow season in NJ, with snow fans in Cape May County perhaps the only ones not disappointed.
| Date | Top Total | Location (County) | Counties ≥ 0.1” | Counties ≥ 1.0” |
|---|---|---|---|---|
| Nov. 21–22 | 20.0” | High Point Monument (Sussex) | 6 | 5 |
| Dec. 4–5 | 2.2” | Holland Township (Hunterdon) | 10 | 4 |
| Dec. 15–16 | 4.2” | Wantage (Sussex) | 6 | 5 |
| Dec. 20–21 | 5.5” |
Sparta (Sussex) & Washington Township (Warren) |
18 | 15 |
| Dec. 24 | 2.1” | Green Pond (Morris) | 16 | 12 |
| Jan. 6 | 8.0” | Wildwood Crest (Cape May) | 21 | 16 |
| Jan. 11 | 2.2” | Rio Grande (Cape May) | 21 | 12 |
| Jan. 19 | 7.6” | Mount Olive Township (Morris) | 21 | 20 |
| Feb. 8–9 | 4.4” | Highland Lakes (Sussex) | 16 | 12 |
| Feb. 11–12 | 8.8” | Cape May (Cape May) | 21 | 20 |
| Apr. 12 | 6.0” | High Point Monument (Sussex) | 7 | 4 |
Table 2. Recap of the New Jersey snow season: November 2024–April 2025.


