Overview
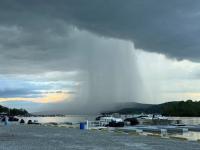
Tragically, this July demonstrated how weather danger lurks across the Garden State during summer months. July thunderstorm winds felled trees that resulted in three fatalities, lightning strikes killed two and injured others, and flash flooding took two lives and put countless others in perilous situations. No doubt, the often-relentless heat and humidity led to medical issues for those most vulnerable, be they old, young, infirmed, employed outdoors, or living in stifling locations devoid of air conditioning.
Temperature-wise, the July statewide average temperature of 78.1° was 2.7° above the 1991–2020 mean and ranked as the 6th warmest since records commenced in 1895. The average high of 87.7° was 2.0° above normal, ranking 12th warmest, while the average low of 68.5° was 3.4° above normal, ranking 3rd warmest. The northern climate division averaged 76.7° (+3.0°, 4th warmest), the southern division 79.0° (+2.5°, 7th warmest), and the coastal division 78.6° (+2.4°, 6th warmest). Eight of the ten warmest Julys have occurred since 2010 and twelve of fifteen since 1999 (Table 1). Only three Julys in the past 25 years have averaged below the 1991–2010 normal. The June–July average of 75.0° is the 5th warmest, only exceeded by 76.1° in 2010, 75.6° in 2024, and 75.2° in both 2020 and 2011.
| Rank | Year | July Avg. Temp. |
|---|---|---|
| 1 | 2020 | 78.8° |
| 2 | 2011 | 78.4° |
| 2 | 1999 | 78.4° |
| 2 | 1955 | 78.4° |
| 5 | 2010 | 78.3° |
| 6 | 2025 | 78.1° |
| 7 | 2019 | 78.0° |
| 8 | 2022 | 77.9° |
| 9 | 2024 | 77.8° |
| 9 | 2013 | 77.8° |
| 9 | 2012 | 77.8° |
| 12 | 2023 | 77.2° |
| 12 | 2016 | 77.2° |
| 14 | 1949 | 77.0° |
| 15 | 1994 | 76.8° |
Table 1. The 15 warmest Julys across NJ since 1895.
The 5.44” statewide average July precipitation was 0.73” above normal, ranking 42nd wettest of the past 131 Julys. As is often seen during summer months, totals varied markedly over rather short distances, seen this month in both the north and south (Figure 1). Overall, the north averaged 4.62” (-0.10”, 64th wettest/68th driest), south 5.93” (+1.19”, 26th wettest), and coast 6.08” (+1.70”, 20th wettest).
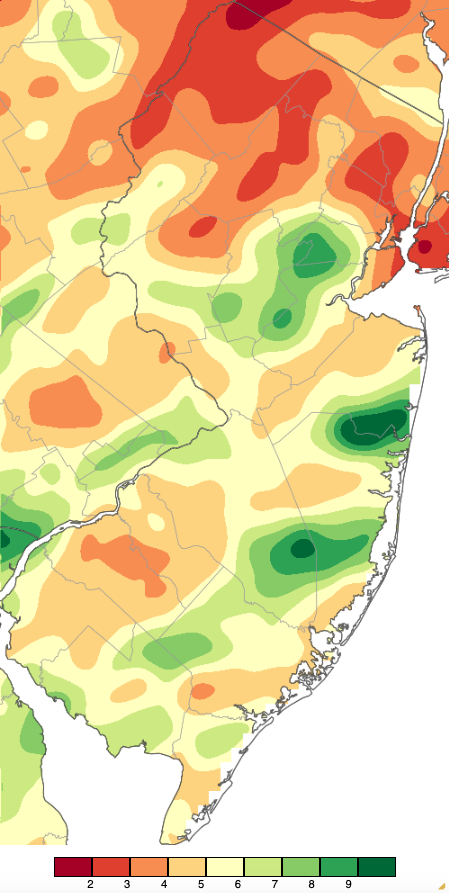
Figure 1. July 2025 precipitation across New Jersey based on a PRISM (Oregon State University) analysis generated using NWS Cooperative, CoCoRaHS, NJWxNet, and other professional weather station observations from approximately 8 AM on June 30th to 8 AM on July 31st. Note the scale in inches at the bottom of the map. Totals range from 1.00”–1.99” (dark red) to 9.00” or greater (dark green).
Precipitation and Storms
There were 13 events during July where one or more locations picked up more than an inch of rain. Six days had storms producing wind gusts of 40 mph or higher at one or more of the 69 Rutgers NJ Weather Network (NJWxNet) stations. The storm on June 30th, where rain fell following morning observations, qualifies as July rain for most reporting stations. A discussion of that storm appeared in the June report, with top totals of 3.65” and 3.16” at two Woodland Township (Burlington) gauges, West Windsor Township (Mercer) 2.34”, and two Princeton (Mercer) stations with 2.14” and 1.95”.
July rainfall totals at NJ Community Collaborative Rain, Hail, and Snow Network (CoCoRaHS) and NJWxNet stations varied by a factor of eight between the wettest and driest locations. Top monthly totals included Howell Township (Monmouth) 12.87”, Jackson Township (Ocean) 12.22”, Wall Township 9.58”, North Brunswick (Middlesex) 9.28”, and Stafford Township (Ocean) 9.26”. On the low side, monthly amounts included Fair Lawn (Bergen) 1.60”, Boonton (Morris) 1.83”, Franklin (Sussex) 2.16”, Glen Rock (Bergen) 2.26”, and Califon (Hunterdon) 2.44”.
The first rain event that fell completely in July began with afternoon and evening thunderstorms on the 1st that continued well into the 2nd, particularly in the south. Event totals reached 5.11” in Howell Township, Wall Township 3.43”, Jackson Township 3.31”, and Neptune City (Monmouth) 3.54” (Figure 2). Of 272 CoCoRaHS reports, 20 ranged from 2.00”–2.99” and 57 from 1.00”–1.99”. For ongoing reference in this report, the number of daily CoCoRaHS observations for events throughout the month ranged within several tens of 250. Strong wind accompanied some of the storms, including gusts to 64 mph at Little Egg Harbor Township (Ocean), Fortescue (Cumberland) 45 mph, and Lower Alloways Creek Township (Salem) 44 mph.
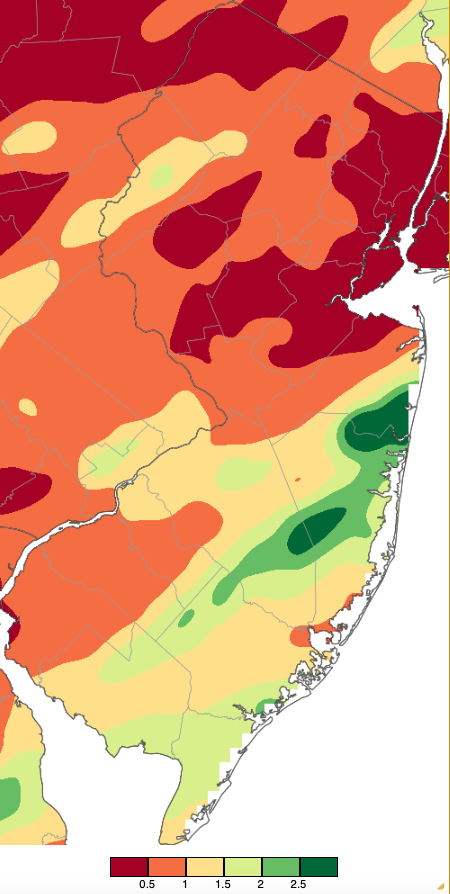
Figure 2. Precipitation across New Jersey from 8 AM on July 1st through 8 AM July 3rd using NWS Cooperative, CoCoRaHS, NJWxNet, and other professional weather station observations. Note the scale in inches at the bottom of the map.
Afternoon and evening storms in northern and southern counties on the 3rd delivered 1.51” to Greenwich Township (Warren), Frenchtown (Hunterdon) 1.50”, Kingwood (Hunterdon) 1.46”, and Franklin Township (Hunterdon) 1.38”. A powerful path of straight-line winds moved through a portion of northeast Somerset, western Union, and northwest Middlesex counties. This brought down trees (Figure 3) that, in two cases, fell onto occupied automobiles in North Plainfield (Somerset) and Plainfield (Union), resulting in one fatality in the first location and two in the second. While the strongest winds were not recorded by any anemometers, gusts of 44 mph in East Brunswick (Middlesex) and 40 mph in Sea Girt (Monmouth) were recorded at NJWxNet stations southeast of the major damage path.
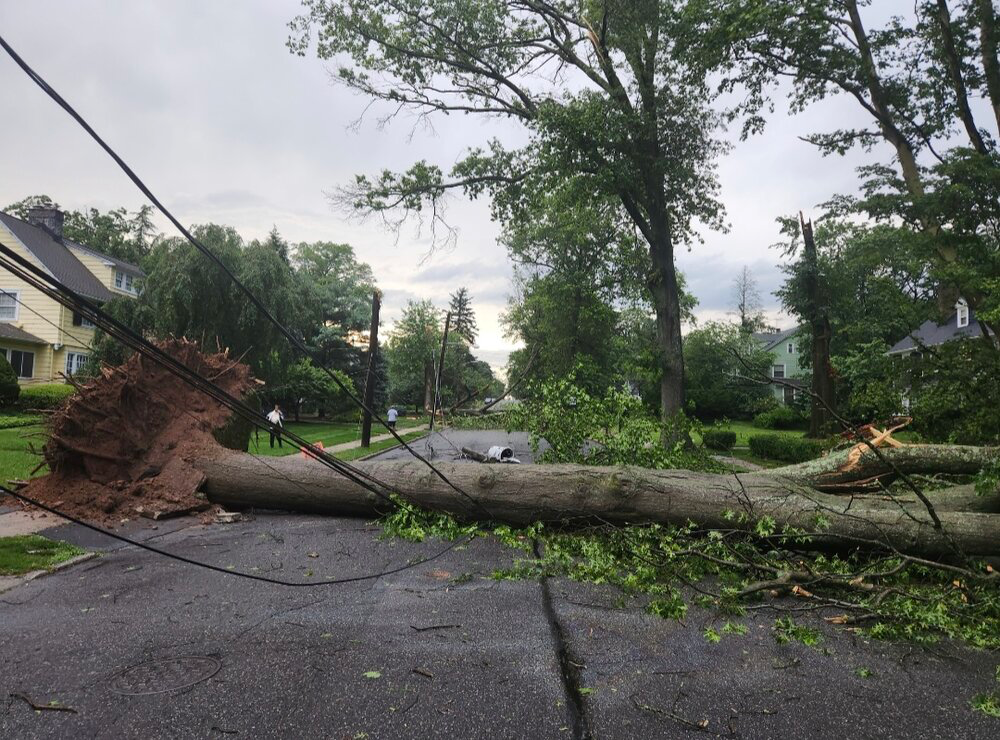
Figure 3. One among numerous large trees toppled by strong winds in Plainfield and vicinity on July 3rd (social media source unknown).
Widely-scattered storms occurred throughout NJ during the afternoon and evening of the 7th. Totals were mostly on the light side, though Denville Township (Morris) caught 1.51”, Hardyston Township (Sussex) 1.31”, and eleven stations saw 0.50”–0.99”. An afternoon thunderstorm in the northwest on the 8th generated a lightning strike that killed an individual seeking cover at a golf course in Sandyston (Sussex). This storm saw three Vernon Township (Sussex) gauges receive 1.33”, 1.19”, and 0.92”. During the evening, southern storms brought Willingboro (Burlington) 1.27”, Jackson Township 1.25”, and Deerfield (Cumberland) 1.20”. Only 11 stations received more than an inch, with 51 catching 0.50”–0.99”. Wind gusts to 58 mph were observed at Fortescue, Sea Girt 50 mph, and 42–47 mph at three other NJWxNet stations.
Continuing the stormy July pattern, the south saw evening thunderstorms on the 9th end during the predawn hours of the 10th. A quite localized total of 4.13” accumulated in Hamilton Township (Atlantic), while Logan Township (Gloucester) came in with 2.08”, three Middle Township (Cape May) stations reporting 2.01”, 1.95”, and 1.64”, 32 stations seeing 1.00”–1.99”, and 72 from 0.50”–0.99” (Figure 4). Winds gusted to 55 mph at Atlantic City Marina (Atlantic) and 44 mph in Little Egg Harbor Township.
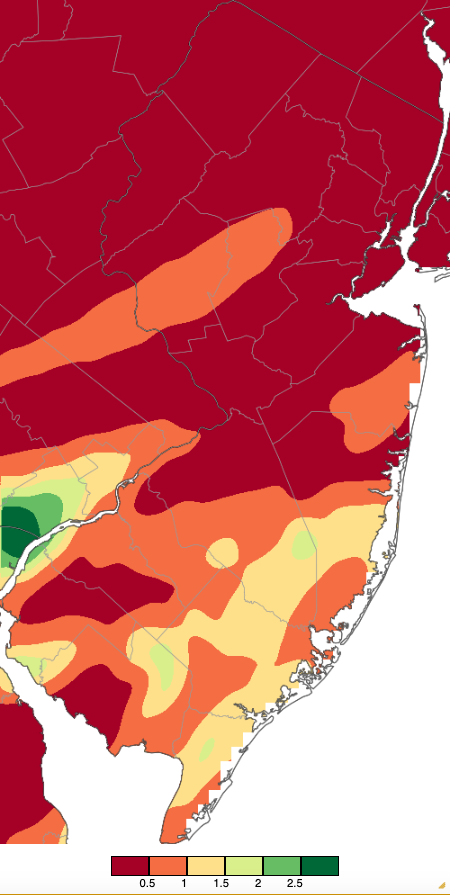
Figure 4. Precipitation across New Jersey from 8 AM on July 9th through 8 AM July 10th based on a PRISM (Oregon State University) analysis generated using NWS Cooperative, CoCoRaHS, NJWxNet, and other professional weather station observations. The scale in inches beneath the map is the same as in Figure 2.
Heavy rain returned to the south during the second half of the 10th into the predawn of the 11th. Widely-scattered, impressive totals included Little Egg Harbor Township 4.21”, Hamilton Township (Atlantic) 2.85”, three Galloway Township (Atlantic) sites with 2.64”, 2.49”, and 2.31”, two Egg Harbor City (Atlantic) gauges with 2.32” and 1.89”, and Port Republic (Atlantic) 2.18”. However, only seven locations saw between 1.00”–1.99” and 16 from 0.50”–0.99”, once again indicative of how localized some of the heaviest rains fell this month.
An extremely moist atmosphere, an approaching front, daytime heating, and a sluggish July atmosphere conspired to deliver exceptional rainfall to parts of the state during the late afternoon and evening of the 14th. The result was flash flooding that took the lives of two individuals when their car was washed into a raging stream. Considerable home, business, and road damage occurred as well. In just several hours, rainfall totaled 6.67” and 6.12” at two Clark Township (Union) locations, Green Brook Township (Somerset) 6.31”, Westfield (Union) 6.24”, New Providence (Union) 5.55”, Piscataway Township (Middlesex) 5.45”, Edison Township (Middlesex) 5.35”, Middlesex (Middlesex) 5.20”, and Linden (Union) 5.08”. Ten stations received 4.00”–4.99”, 17 from 3.00”–3.99”, 30 from 2.00”–2.99”, and 72 from 1.00”–1.99” (Figure 5a and 5b). In less than three hours, the USGS/NOAA Green Brook stream gage in Plainfield rose 11.82’ (from 0.91’ to 12.73’) (Figure 6a). The flood crest was the second highest in a record that extends back at least to the early 1970s. The record crest remains 13.6’ on August 2, 1973, a flash flood that resulted in six deaths. The Bound Brook gage in Middlesex rose 10.87’ between early evening and 2:00 AM on the 15th (from 1.77’ to 12.64’; Figure 6b). This marked the 5th highest crest in at least 30 years, with the top crest remaining 14.11’ on September 2, 2021.
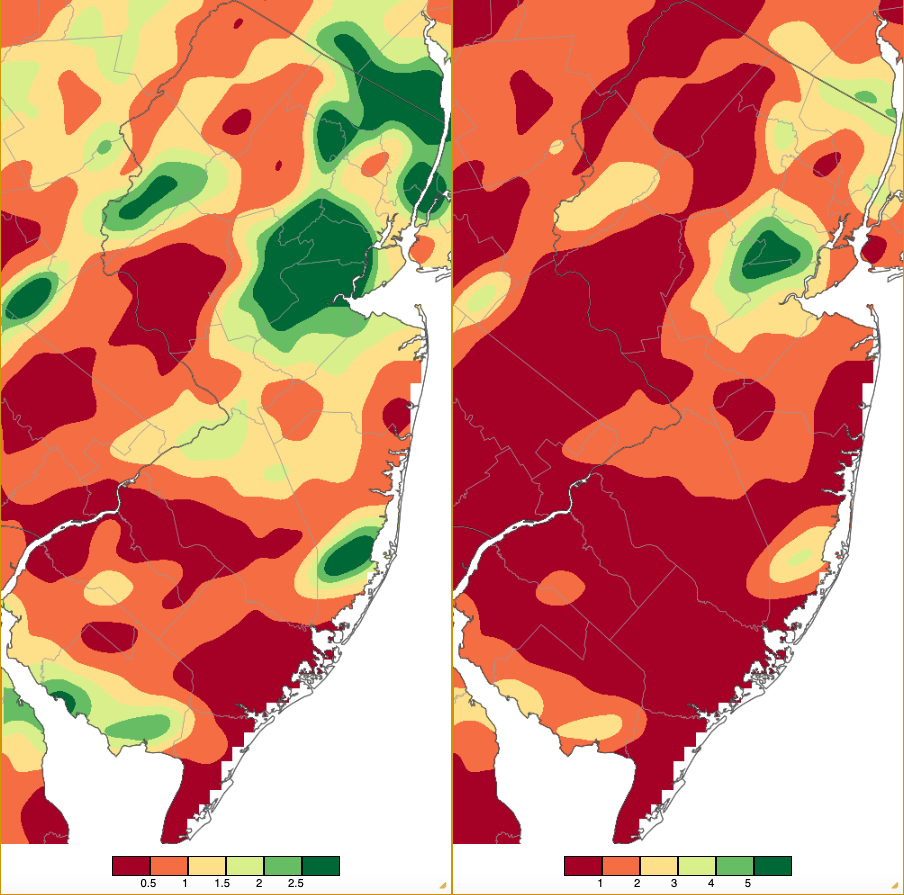
Figure 5. Left: Precipitation across New Jersey from 8 AM on July 14th through 8 AM July 15th based on a PRISM (Oregon State University) analysis generated using NWS Cooperative, CoCoRaHS, NJWxNet, and other professional weather station observations. Note that the scale in inches beneath the map is the same as in Figures 2 and 4.
Right: Precipitation during the same interval but employing a broader scale that better depicts the localized exceptional totals in Union, far eastern Somerset, and far northern Middlesex counties.
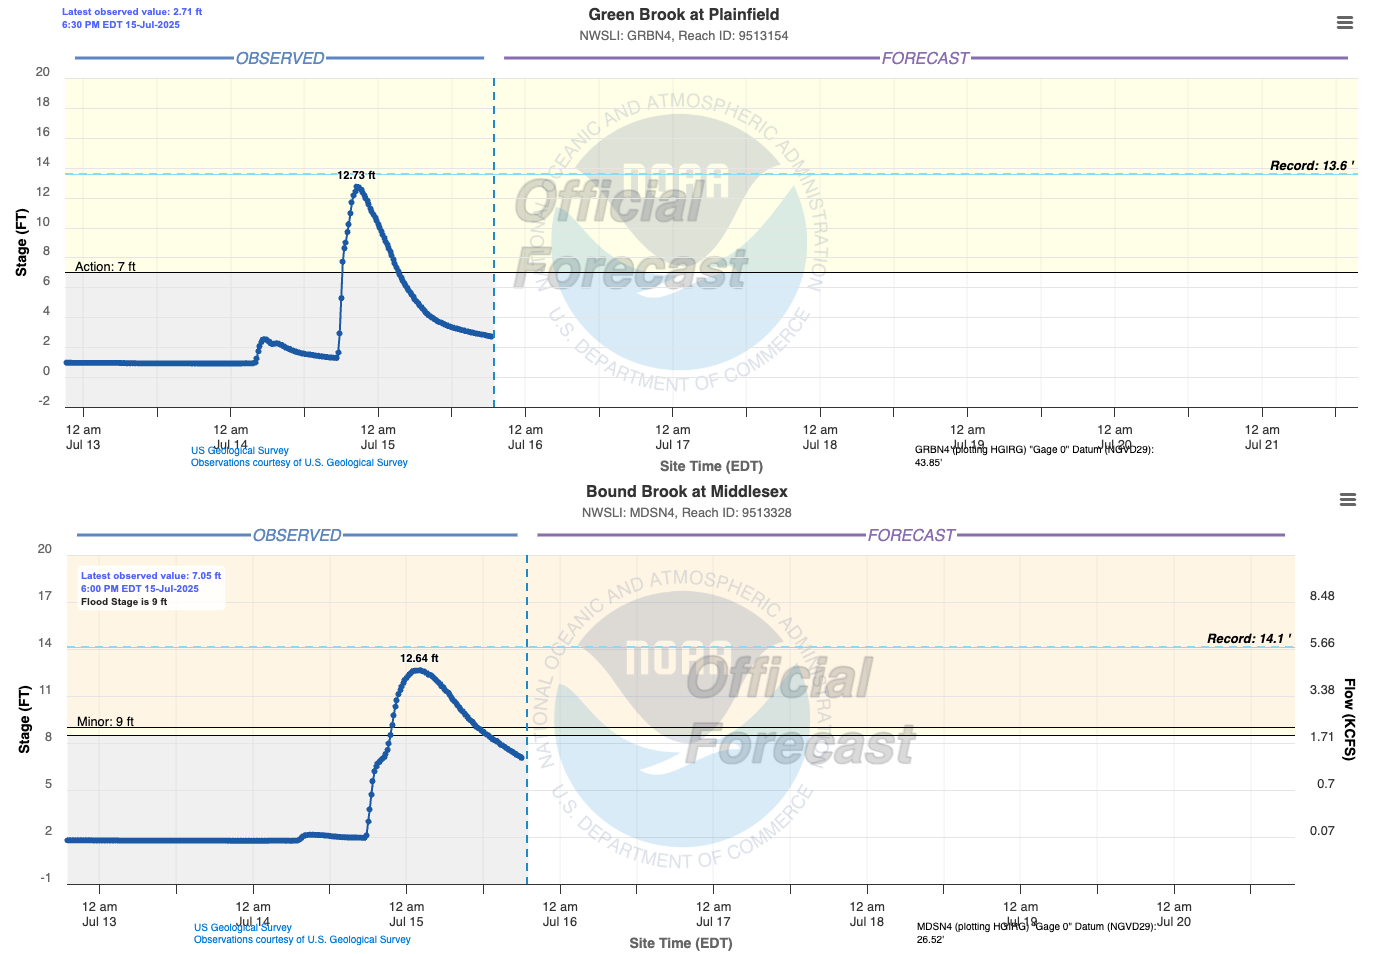
Figure 6. Water levels at the Green Brook gage in Plainfield (top) and Bound Brook gage in Middlesex (Middlesex; bottom) between the evening of July 13th and 6:30 PM on the 15th. Courtesy of the US Geological Survey and NOAA.
Just two days following the 14th deluge, soaking rain fell at locations south of the flood zone on the 16th. This included 2.20” at North Brunswick, Helmetta (Middlesex) 1.74”, Brick Township (Ocean) 1.74” and 1.28”, Howell Township 1.68”, and Jackson Township 1.63”. Only nine gauges caught 1.00”–1.99” and 17 from 0.50”–0.99”. Further south, a gust of 47 mph was recorded in Lower Alloways Creek Township.
The 22nd brought isolated midday showers to the central coast that, at most, totaled 0.38” in Beachwood (Ocean) and 0.27” in both Lacey Township (Ocean) and Berkeley Township (Ocean). Of note this day was a waterspout close to shore. As recorded by several observers, the spout briefly came ashore in Island Beach State Park (Ocean), thus becoming classified as a landspout/weak tornado (Figure 7). The NWS classified this as an EFU (EF-Unknown) event, as the absence of recognizable damage did not permit an estimation of wind speed.
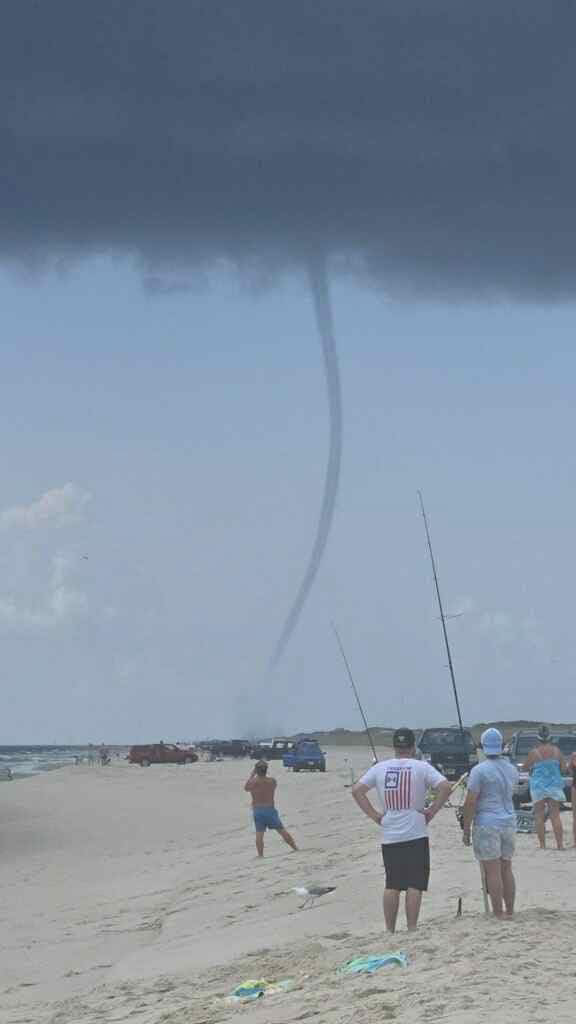
Figure 7. Waterspout making landfall and becoming a landspout at Island Beach State Park on July 22nd (social media source unknown).
The 25th brought even more scattered afternoon thunderstorms to the state. And yet another waterspout was seen off the Long Beach Island coast, while winds gusted to 66 mph at Seaside Heights (Ocean), Little Egg Harbor Township 54 mph, Fortescue 46 mph, and Cream Ridge (Monmouth) 40 mph. Modest rain totals of 1.30” and 1.21” were observed in Cranford Township (Union) and New Brunswick (Middlesex) 1.05”. Just six gauges caught 1.00”–1.30” and 33 saw 0.50”–0.99”.
Early morning rain on the 27th delivered 1.98” to Logan Township, Woodstown (Salem) 0.97”, Greenwich Township (Warren) 0.52”, and Hopewell (Mercer) 0.50”. Later that afternoon, Barrington (Camden) saw 1.61” and 1.04” at two sites, Little Egg Harbor Township 1.58”, Evesham Township (Burlington) 1.37”, and just four stations from 0.50”–0.99”, yet again exemplifying the localized nature of many of this month’s precipitation events.
Scattered heavy rainfall totals during the late morning and afternoon on the 31st brought as much as 5.18” to Fort Dix (Burlington), Manchester Township (Ocean) 4.30”, Montague (Sussex) 3.91”, Long Hill Township (Morris) 3.57”, Greenwich (Cumberland) 3.56”, 18 stations from 2.00”–2.99”, and 68 from 1.00”–1.99”. However, these totals usually do not count toward July precipitation totals, as explained earlier in this report when mention was made of post-morning observation time June 30th rainfall being accounted for in July 1st reports.
The highest barometric pressure observed in July was between 30.25” and 30.30” on the 23rd. Lowest pressures fell between 29.70” and 29.80” on both the 1st and 20th.
Temperature
High temperatures at one or more NJWxNet stations reached 90° on 24 July days, with the 95° or higher mark reached on eight of those days. The first 95° day was on the 1st with Hammonton (Atlantic) up to 95°. A week passed with highs in the low 90°s each day, but not until the 8th did Seaside Heights reach 99°, Berkeley Township and Woodland Township at 98°, and 33 NJWxNet stations topping out at 95°–97°. Wantage (Sussex) had the mildest high at 84°. The low 90°s returned for six of the next seven days until Seaside Heights again led the way at 95° on the 17th. Yet another retreat into the low 90°s, even some 80°s, occurred from the 19th–24th until Berkeley Township, Jersey City (Hudson), and Woodland Township all reached 99° on the 25th. Some 46 stations followed at 95°–98°, with Harvey Cedars (Ocean) least warm at 86°.
After two more low 90°s days, an end-of-month surge of excessive heat began on the 28th with Jersey City and West Deptford (Gloucester) up to 97° and 18 sites at 95°, while Sea Girt and Seaside Heights were least warm at 86°. The 29th was the hottest July day, with Haworth (Bergen) up to 101°, Little Falls (Passaic), Mansfield (Burlington) and West Deptford (Gloucester) all at 100°, ten stations at 99°, and 38 peaking from 95°–98° (Figure 8). Harvey Cedars was least warm at 86°. The daytime heat was slow to relinquish its grip late into the evening of the 29th, particularly in urban locations, as witnessed by post-11 PM temperatures still in the mid to upper 80°s (Figure 9). Torrid conditions continued on the 30th, with Little Falls (Passaic) up to 99° and 37 stations from 95°–98°. Before heatwave-breaking showers arrived on the 31st, four stations made it to 95°, though in the northwest, where clouds and showers arrived shortly after dawn, Wantage only made it to 72°.
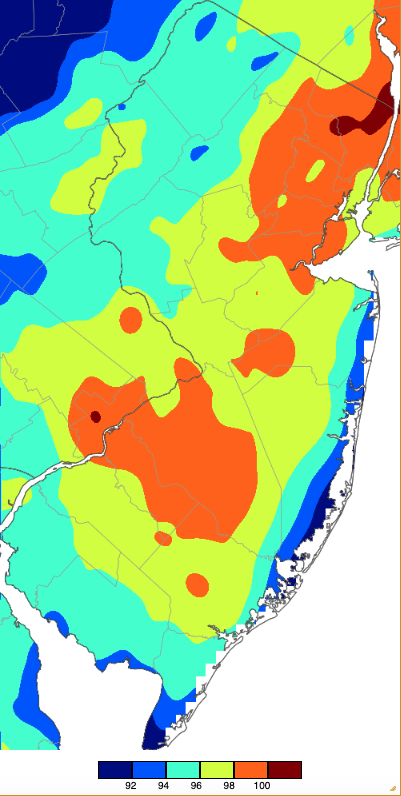
Figure 8. Maximum temperatures on July 29th based on a PRISM (Oregon State University) analysis generated using NWS, NJWxNet, and other professional weather stations. Note the 2° scale beneath the map.
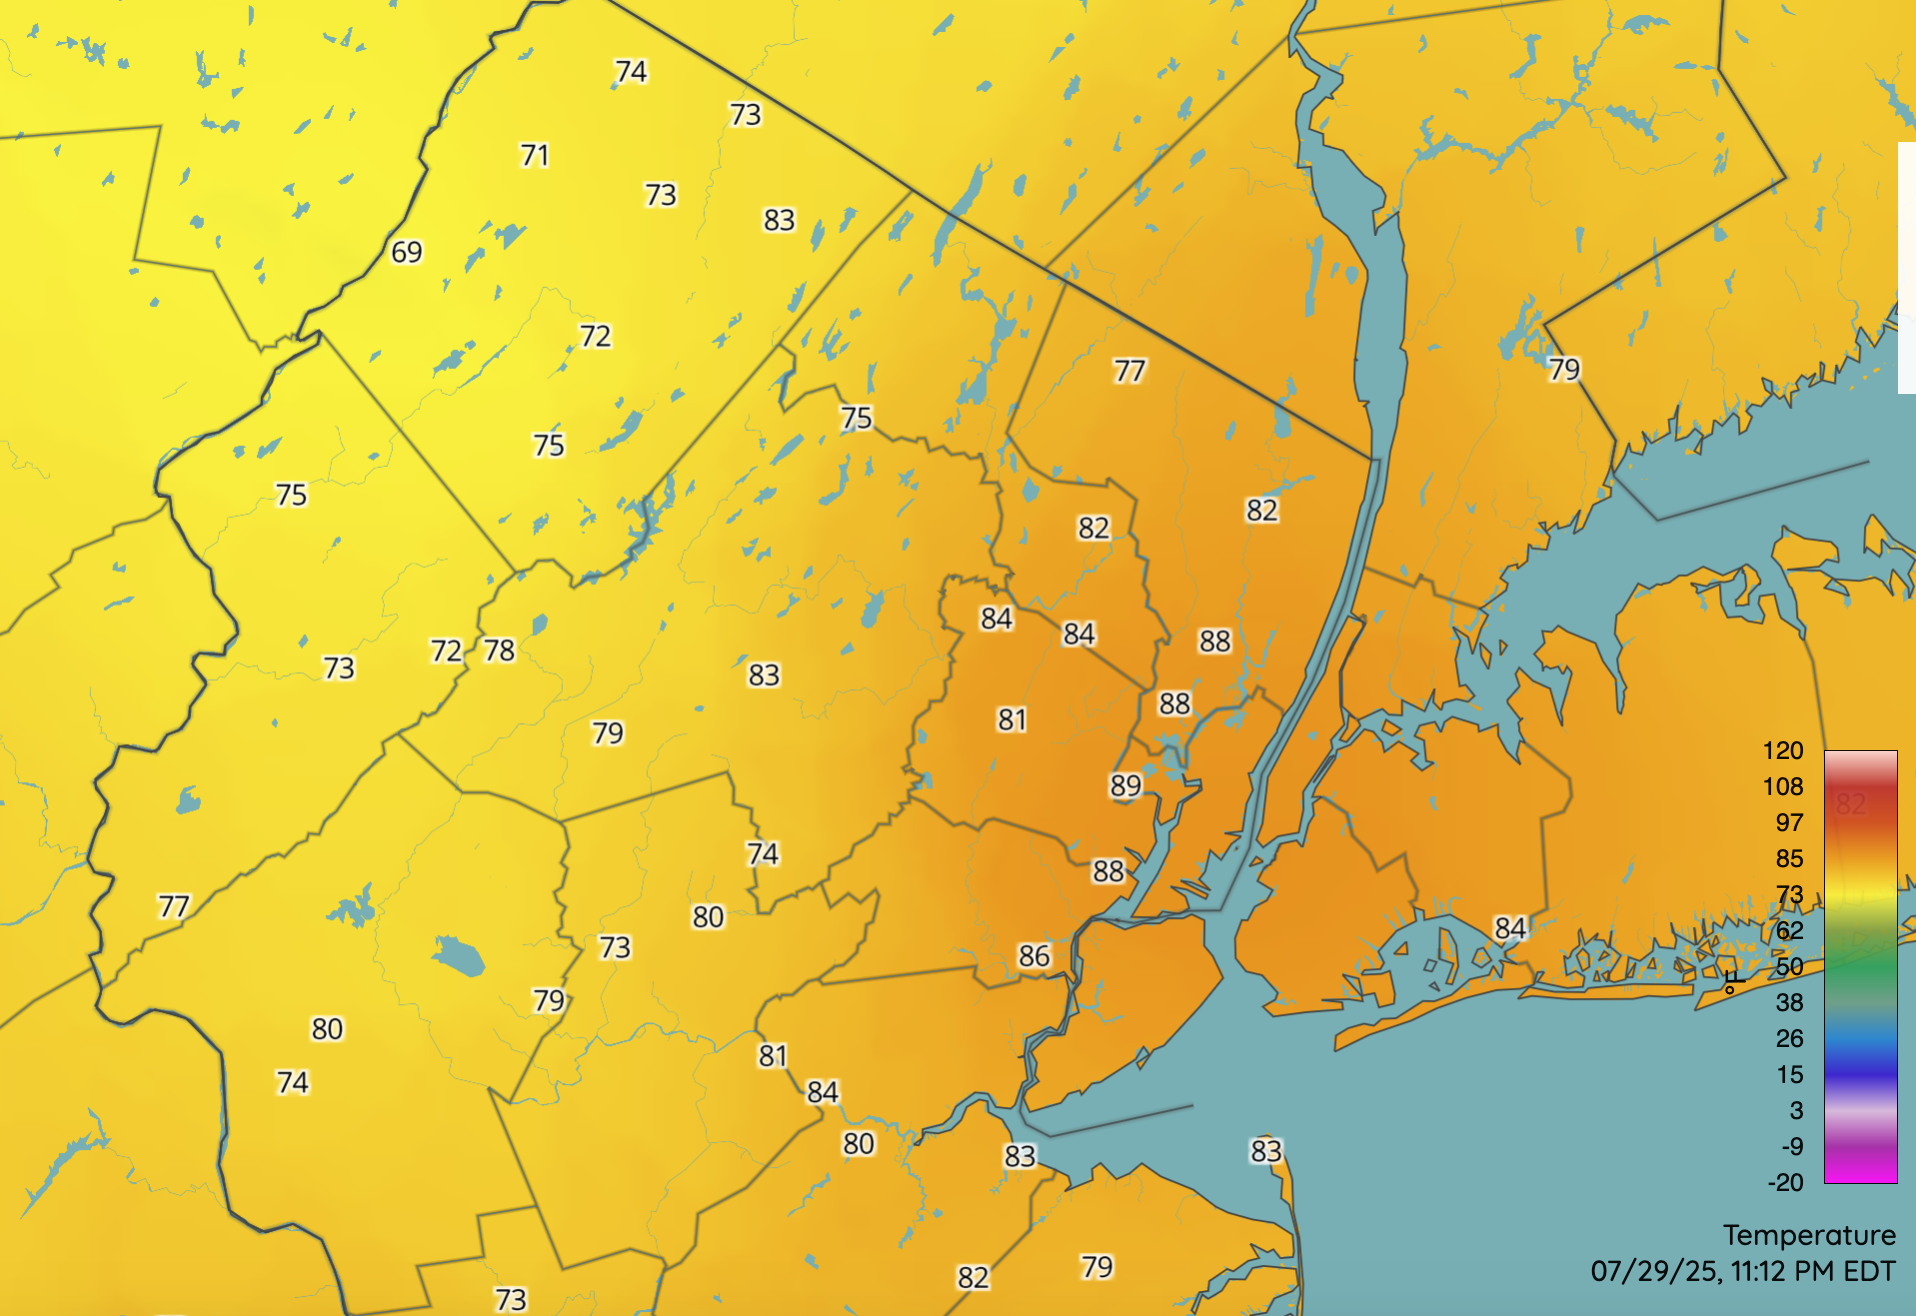
Figure 9. Temperatures across northern NJ and nearby areas at 11:10 PM on July 29th. Observations are from NJWxNet stations and several NWS airport sites.
Low temperatures across NJ during July proved quite interesting. In part due to dryer conditions in the northwest, the coolest lows were most often found in valley locations. Twelve days saw lows at one or more NJWxNet station falling below 60°. Seven of these days found stations at 55° or cooler. The first of these was the 5th, with Sandyston down to 55°. This location was 51° on the 4th, with three stations at 55°. The 5th was the coolest July morning, as Walpack (Sussex) dropped to 49°, Sandyston 50°, and eleven locations were 52°–55° (Figure 10). Both Atlantic City Marina and Harvey Cedars only fell to 70° that morning.
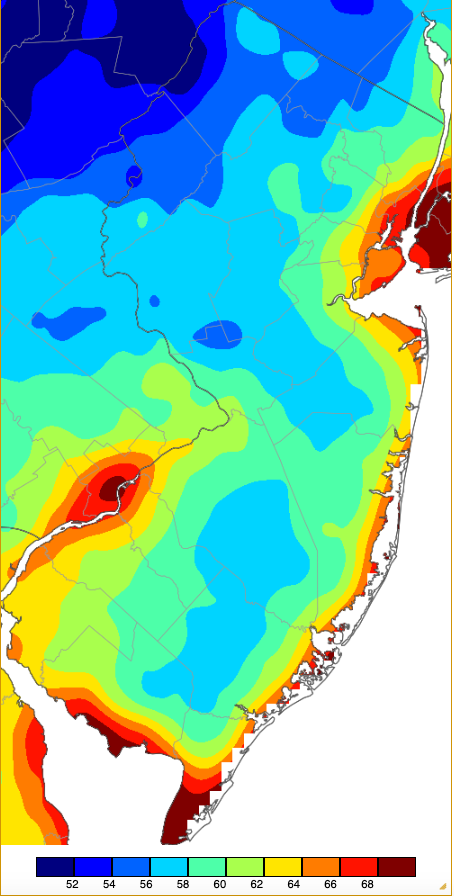
Figure 10. Minimum temperatures on July 5th based on a PRISM (Oregon State University) analysis generated using NWS, NJWxNet, and other professional weather stations.
Two weeks passed before Walpack and Sandyston dropped to 53° on the 19th. A three-day run of cool mornings first found Walpack at 55° on the 21st, Sandyston 51°, Walpack 52°, Pequest (Warren) 54°, and Wantage and High Point Monument (Sussex) each 55° on the 22nd, while Harvey Cedars only fell to 74°. Walpack reached 55° on the 23rd.
Every July day found at least one NJWxNet station with a low of 70° or warmer. Twenty-one days had at least one station no cooler than 75°, three with maximum lows of 78°, the 29th with Lower Alloways Creek Township and Pennsauken (Camden) only down to 79°, and the 30th with Fortescue no lower than 82°, Lower Alloways Creek Township 80°, and five stations at 79°. On each of these days, the coolest location was either Walpack or Sandyston with lows of 63° or 64°.


