Above-average temperatures ruled in June. So, what else is new? As will be seen later in this report, the first half of 2024 ranked as the second warmest since statewide records commenced in 1895. June 2024 was also the 7th consecutive month with temperatures above the 1991–2020 average and 10th of the last 12 in that category. June itself came in as New Jersey’s 2nd warmest, tied with 1943 and just behind 2010 (Table 1). Six of the 11 warmest have occurred since 2005. The 73.6° average was 3.3° above normal. The average high of 85.1° was 4.1° above normal, tied for the 2nd warmest, and the average low of 62.0° was 2.4° above normal, ranking 4th warmest. Each of the three NOAA state climate divisions had their 2nd warmest June. The north averaged 71.7° (+3.1°), south 74.8° (+3.4°), and coast 73.8° (+3.3°).
| Rank | Year | June Avg. Temp. |
|---|---|---|
| 1 | 2010 | 73.9° |
| 2 | 2024 | 73.6° |
| 2 | 1943 | 73.6° |
| 4 | 2008 | 73.0° |
| 4 | 1925 | 73.0° |
| 6 | 1994 | 72.2° |
| 7 | 2005 | 72.1° |
| 8 | 1957 | 72.0° |
| 9 | 2011 | 71.9° |
| 10 | 2021 | 71.8° |
| 10 | 1934 | 71.8° |
Table 1. The 11 mildest Junes across NJ since 1895.
As often occurs during the warm season, the rainfall pattern was a mixed bag as the month progressed and also across the state on any given day. Overall, the state experienced a dry month, with the majority of the state considered Abnormally Dry (D0) in the last US Drought Monitor assessment of the month. With some rain falling after the June 30th approximate 7–8 AM observing time of most National Weather Service Cooperative and Community Collaborative Rain, Hail, and Snow Network (CoCoRaHS) stations, any daytime or evening rain is entered into the record book as falling on July 1st. Thus, the official map below (Figure 1) does not include some of the heavy post-observing time heavy rain in Cape May County the morning of the 30th nor rain occurring elsewhere in the state later in the day. For the month, the state average 2.74”, which is 1.56” below normal and ranks 28th driest. The north averaged 2.23” (-2.38”, 13th driest), south 3.07” (-1.07”, 49th driest), and coast 2.84” (-1.01”, 51st driest).
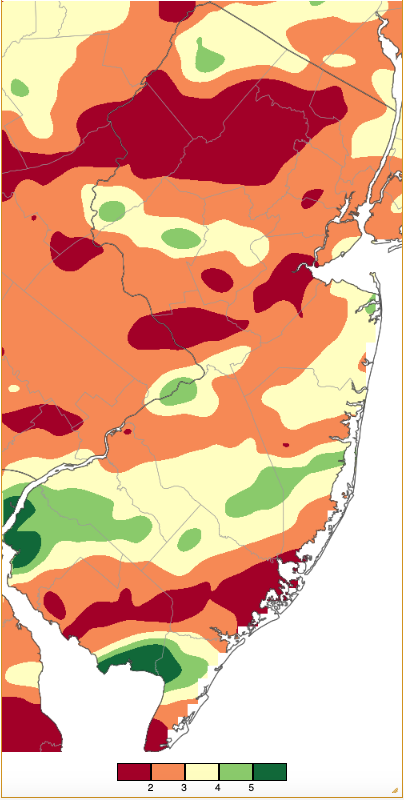
Figure 1. June 2024 precipitation across New Jersey based on a PRISM (Oregon State University) analysis generated using NWS Cooperative, CoCoRaHS, NJWxNet, and other professional weather station observations from 8 AM on May 31st to 8 AM on June 30th. Note the scale in inches at the bottom of the map. Totals range from 1.00”–1.99” (dark red) to 4.00”–4.99” (dark green).
Temperature
This warm June started on the cooler side so the more notable daily low temperatures are discussed first. This includes the 1st, which proved to be the coolest morning of the month. Walpack (Sussex County) dipped to 39°, with 26 of the 68 Rutgers NJ Weather Network (NJWxNet) locations in the 40°s (Figure 2). Coastal areas were mildest, with Lower Alloways Creek Township (Salem) the warmest at 61°. There were ten other days with lows in the 40°s at one or more NJWxNet stations, with Walpack among the coolest on every occasion. This included the 2nd with Walpack at 45° and seven locations from 40°–49°. Sandyston (Sussex) was coolest on the 8th at 46°. Walpack fell to 49° on the 9th, 45° on the 10th, and 44° on the 11th when eight other stations ranged from 46°–49°. Sandyston and Walpack were coolest on the 12th at 46° and 47° on the 13th. The latter morning found Fortescue (Cumberland) a mild 70°. Walpack dipped to 41° on the 16th with eight locations from 44°–49°, while Seaside Heights (Ocean) was 65°. Later in the month, Walpack reached 49° on the 25th and a chilly 44° on the 28th when Sandyston was 47° and Pequest (Warren) 49°.
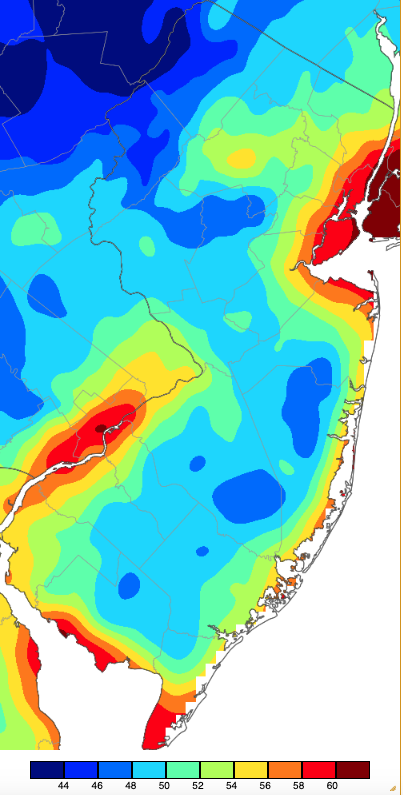
Figure 2. Minimum temperatures on June 1st based on a PRISM (Oregon State University) analysis generated using NWS, NJWxNet, and other professional weather stations. Note the 2-degree scale beneath the map.
Twelve June afternoons found the 90° mark equaled or bested at one or more NJWxNet stations. Eight of these days featured more than half of the NJWxNet stations over 90°. The barrage of such days did not begin until the 14th, when four stations reached 93° and 19 from 90°–92°. Ten of the 11 days from the 17th–27th found the 90° threshold reached. Fort Dix (Burlington) and Pennsauken (Camden) reached 91° on the 17th. Hillsborough-Duke (Somerset) hit 95° on the 18th, with 36 sites from 90°–94°. Harvey Cedars (Ocean) on Long Beach Island only made it to 74° due to a sea breeze blowing air cooled by the underlying sea surface onshore. This was a pattern seen on most subsequent days. Fort Dix led with 94° on the 19th, with 32 other stations in the low 90°s. Hillsborough-Duke and Berkeley Township (Ocean) ranked at the top with 95° highs on the 20th. They repeated this ranking on the 21st at 98°, with 57 other stations from 90°–97°.
The 22nd was the hottest day of the month and the hottest June day since the 30th in 2021. Eight NJWxNet stations reach 100°, 30 from 95°–99°, and 17 from 90°–94° (Figure 3). Even the High Point Monument (Sussex) station reached 90°, the first time since July 3, 2018. Yet Harvey Cedars only rose to 76°.
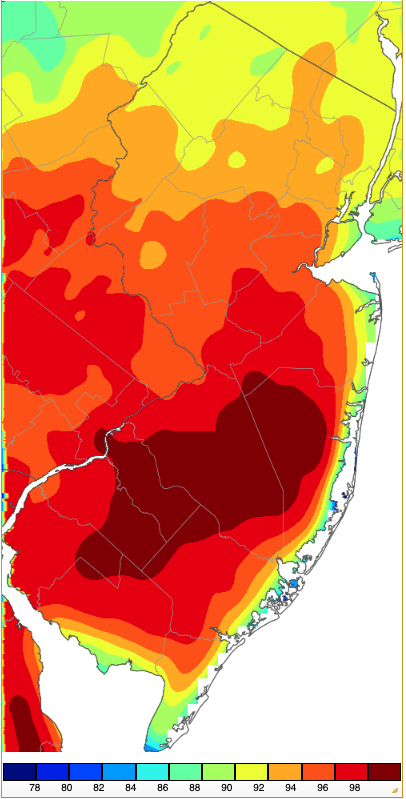
Figure 3. Maximum temperatures on June 22nd based on a PRISM (Oregon State University) analysis generated using NWS, NJWxNet, and other professional weather stations.
Figures 4 includes three regional maps of air temperature, dew point temperature, and the heat index (derived from temperature and dew point) at approximately 2:00 PM on the 22nd. Local showers had already cooled portions of Sussex and Bergen counties, but otherwise, the coast had to be visited to find some level of comfort. Dew points were mainly in the upper 60°s and low 70°s. The combination of the heat and humidity resulted in heat index values running between 100°–110° over most of New Jersey, a dangerous situation for all.

Figure 4. Surface air temperature (top), dew point (middle), and heat index (bottom) around 2:00 PM on June 22nd. Observations are from Rutgers NJ Weather Network, National Weather Service airport stations, Shrewsbury Weather Network, and Delaware Environmental Observing System Network, with the heat index calculated from the observed temperature and humidity data (only displayed if 80° or higher).
A comparison of time series of temperature between Hammonton (Atlantic), situated less than 30 miles from the coast, and Harvey Cedars shows how very different the journey over the course of a 24-hour period is between inland and coastal stations (Figure 5). Hammonton was in the 90°s on the afternoons of the 21st and 22nd, with slight variations in afternoon temperature profiles mostly due to lightly-scattered clouds. Rapid cooling during the evening of the 21st and then a gradual decline until dawn on the 22nd dropped the thermometer to a still quite warm 70°, with temperatures kept high from excessive humidity as dew points were near 70°. The thermometer on the 22nd shot up during the morning and early afternoon to the high 90°s. Meanwhile, at Harvey Cedars, a sea breeze on the afternoon of the 21st kept temperatures in the upper 60°s to low 70°s. Come early evening, as the sea breeze weakened, the temperature rose to the upper 70°s, later declining only slightly to a rather persistent 73°–75° range overnight. While dew point observations are not available at this location, it is quite apparent that readings were similar to the air temperature. Come about 8 AM on the 22nd, the temperature rapidly fell to 70°, it being unclear if this was due to a brief incursion of the 70° inland air or a “false” start to the daily sea breeze. The temperature then rose back to the mid 70°s for a few hours before the sea breeze truly kicked in by mid-morning, keeping the temperature in the upper 60°s to just above 70° into midafternoon.
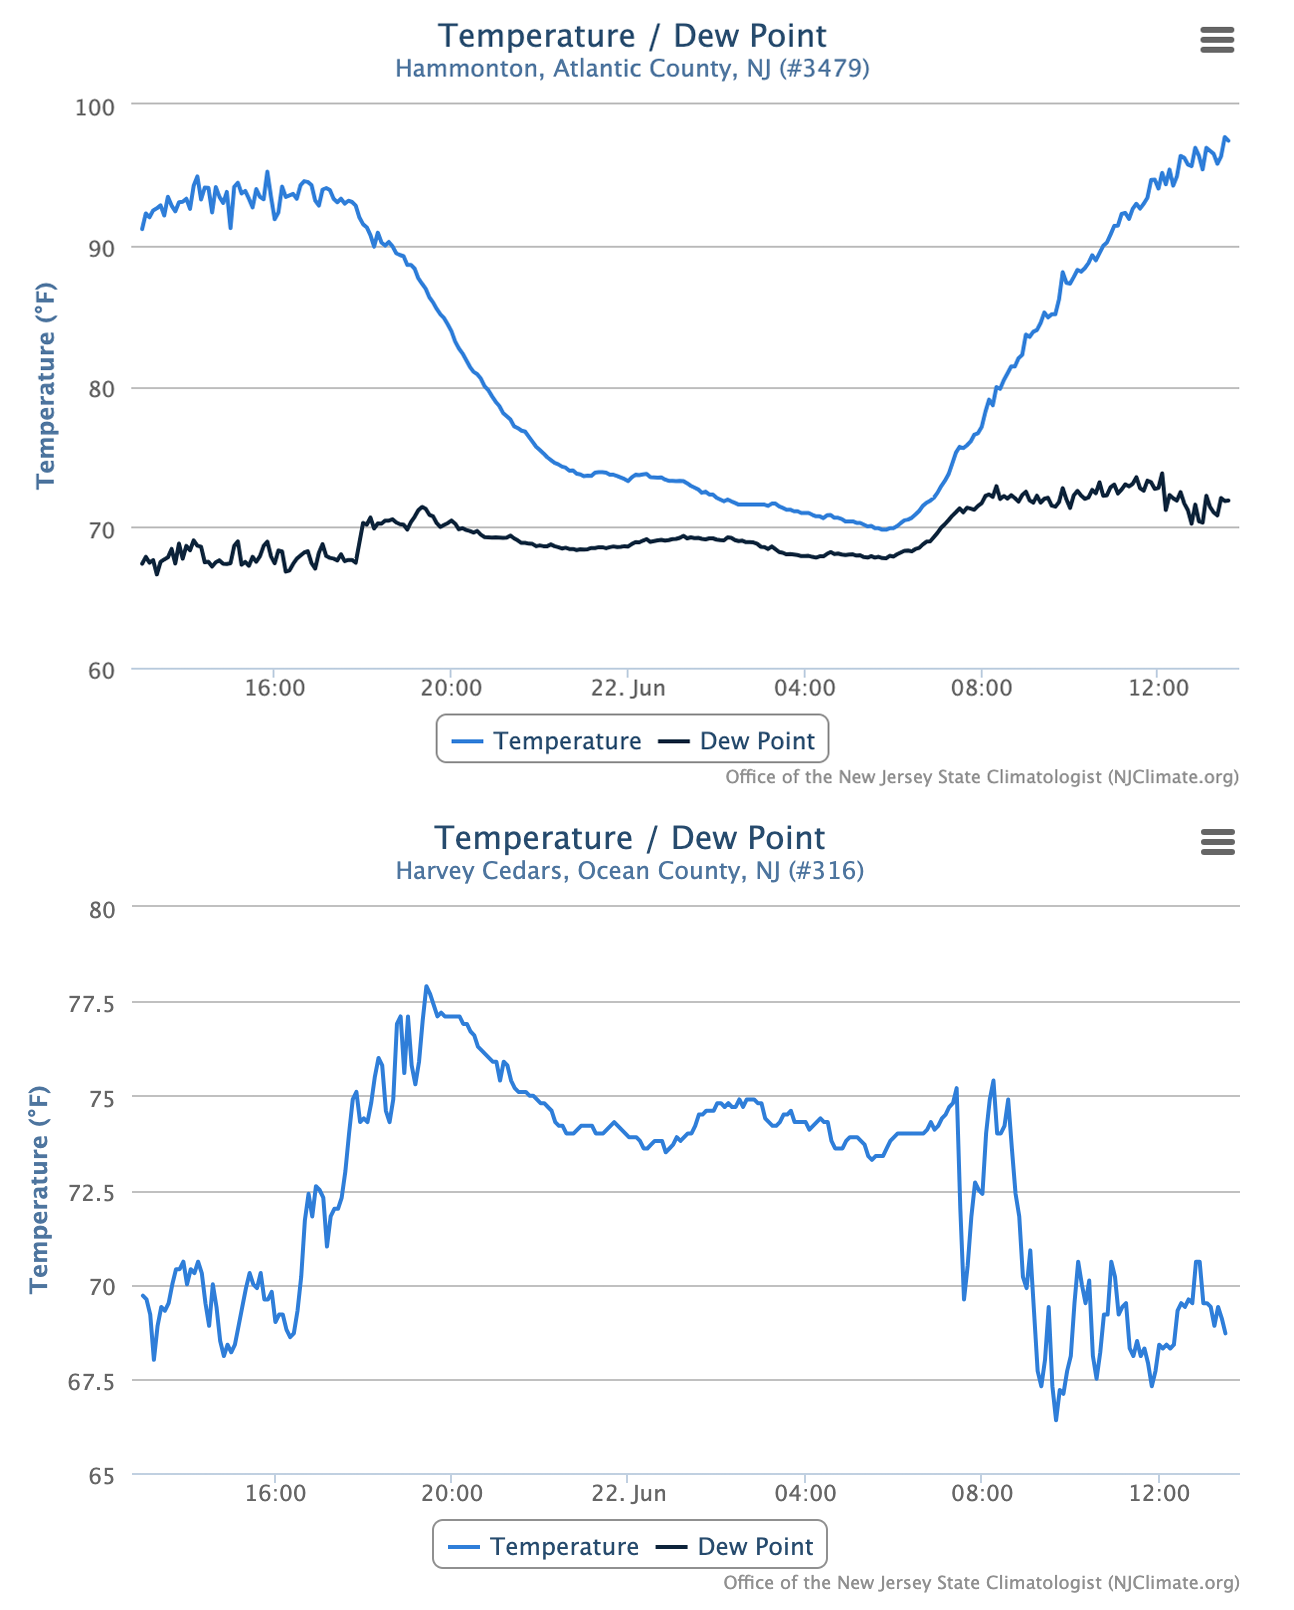
Figure 5. Time series of temperature and dew point at the Hammonton (top) and temperature at the Harvey Cedars (bottom) NJWxNet stations from approximately 2:00 PM on June 21st to 2:00 PM on June 22nd.
The 23rd remained exceptionally hot, with Berkeley reaching 100°, 35 stations from 95°–99°, and 19 from 90°–94°. Hillsborough-Duke and Wall Township (Monmouth) topped out at 93° on the 25th, with 34 NJWxNet stations up to 90°–92°. While a sea breeze eventually arose along the coast during the afternoon, its earlier arrival was delayed by offshore airflow, winds that kept Vernon Township (Sussex) in the northwest hills coolest for the day at 83°. Figure 6 illustrates the post-noon arrival of a sea breeze at three coastal locations. This occurred by 1:00 at Atlantic City Marina (Atlantic) and Harvey Cedars, while delayed until after 2:00 at Sea Girt (Monmouth). This helped Sea Girt make it to 90° while the other two sites didn’t make it out of the mid 80°s. The afternoon decline in temperature was most pronounced at Sea Girt (note the different temperature scale on the Sea Girt time series), and certainly had its ups and downs there and at Harvey Cedars.
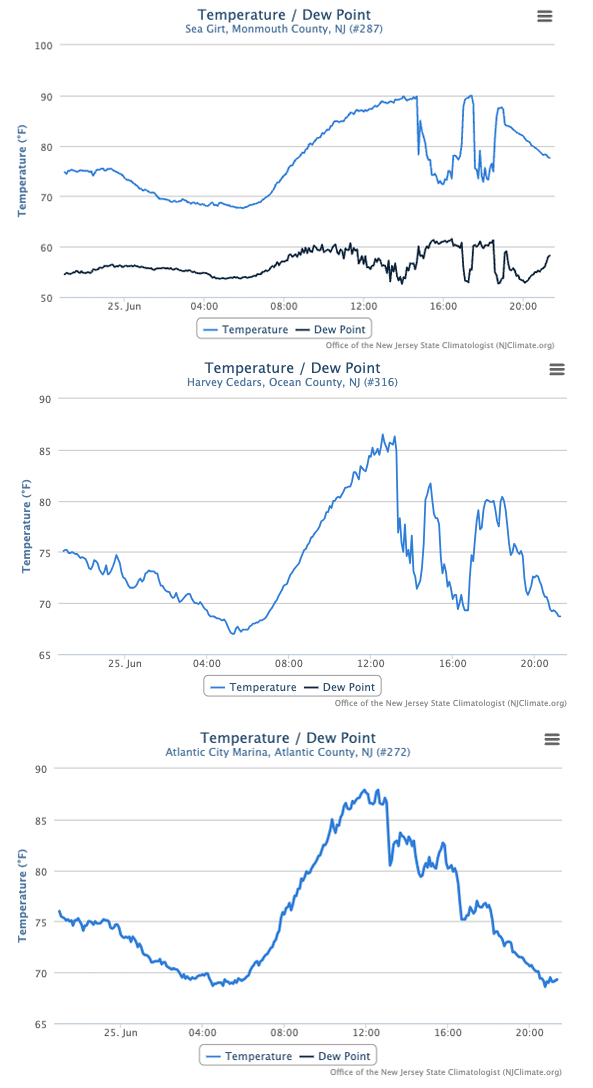
Figure 6. Time series of temperature and dew point at the Sea Girt (top), temperature at the Harvey Cedars (middle), and temperature at the Atlantic City Marina (bottom) NJWxNet stations from approximately 9:00PM on June 24th to 9:00PM on June 25th.
The final three days of June reaching 90° included the 26th with Cream Ridge (Monmouth) up to 98° and 50 stations from 90°–97°, the 27th when Lower Alloways Creek Township made it to 90°, and the 30th with Pennsauken and West Deptford (Gloucester) at 90°.
Precipitation and Storms
June precipitation totals (through approximately 7–8 AM on the 30th) at CoCoRaHS stations were as large as 6.01” in Salem (Salem), Hamilton Township (Atlantic) 5.73”, Woodstown (Gloucester) 5.34”, Hammonton 5.22”, Reading Township (Hunterdon) 5.06”, and Burlington (Burlington) 5.05”. On the dry side, two Brigantine (Atlantic) stations could only muster 0.95” and 1.06”, with West Milford (Passaic) 1.15”, Blairstown (Warren) 1.16”, Long Hill Township (Morris) 1.17”, Galloway Township (Atlantic) 1.20”, and Mt. Olive Township (Morris) 1.21”. There were nine rain episodes during the month that deposited over an inch of rain at multiple locations within the state. However, there were few state-wide wet episodes, thus overall increasing dryness and drought concerns. The hot conditions did not help either, increasing evaporation rates.
The 5th brought the first June rain, beginning with widely-scattered afternoon showers followed by heavy rain in the southwest from evening into the pre-dawn hours of the 6th. Of 276 CoCoRaHS reports, Salem topped all with 4.10”, followed by Pennsville (Salem) 3.32”, Woodstown (Salem) 3.03”, Glassboro (Gloucester) 2.76”, and Pitman (Gloucester) 2.62” and 2.48” (two stations; Figure 7). Little rain fell in the northwest, with Montague (Sussex) catching 0.01”.
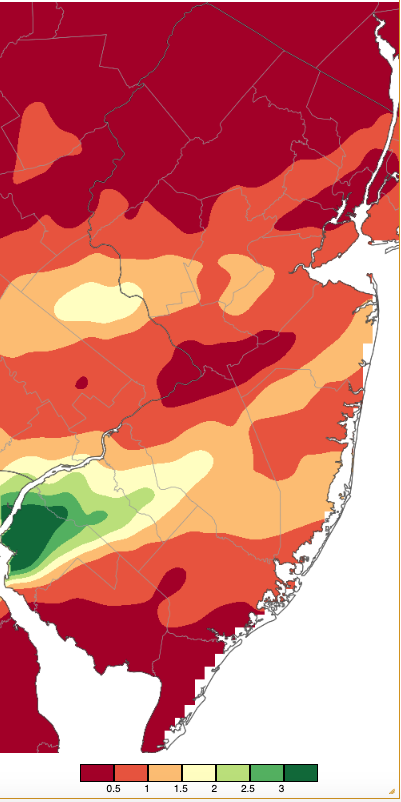
Figure 7. Precipitation across New Jersey from 8 AM on June 5th through 8 AM June 6th based on a PRISM (Oregon State University) analysis generated using NWS Cooperative, CoCoRaHS, NJWxNet, and other professional weather station observations.
Showers late on the 6th brought a portion of the northeast 1.53” and 1.39” at Little Falls (Passaic; two stations), Hawthorne (Passaic) 1.35”, and River Edge (Bergen) 1.26”. Afternoon and evening storms on the 14th were locally strong but not widespread. Burlington (Burlington) caught 2.49”, Little Silver (Monmouth) 1.97”, Hamilton (Mercer) 1.43”, and six other stations from 1.00”–1.30”. Small hail was reported in Warren and Bergen counties. Winds gusted to 68 mph at Fortescue, 60 mph in Columbus (Burlington), and 40–44 mph at six other NJWxNet sites. Twelve counties reported fallen trees and power outages. There also was the first National Weather Service confirmed tornado of 2024 (Figure 8). It touched down briefly in Lawrence Township (Mercer) from 5:59–6:00 PM. Rated EF-0 with 80 mph winds, its path length was 0.13 miles and maximum width 60 yards. Vehicle and tree damage occurred without any injuries.
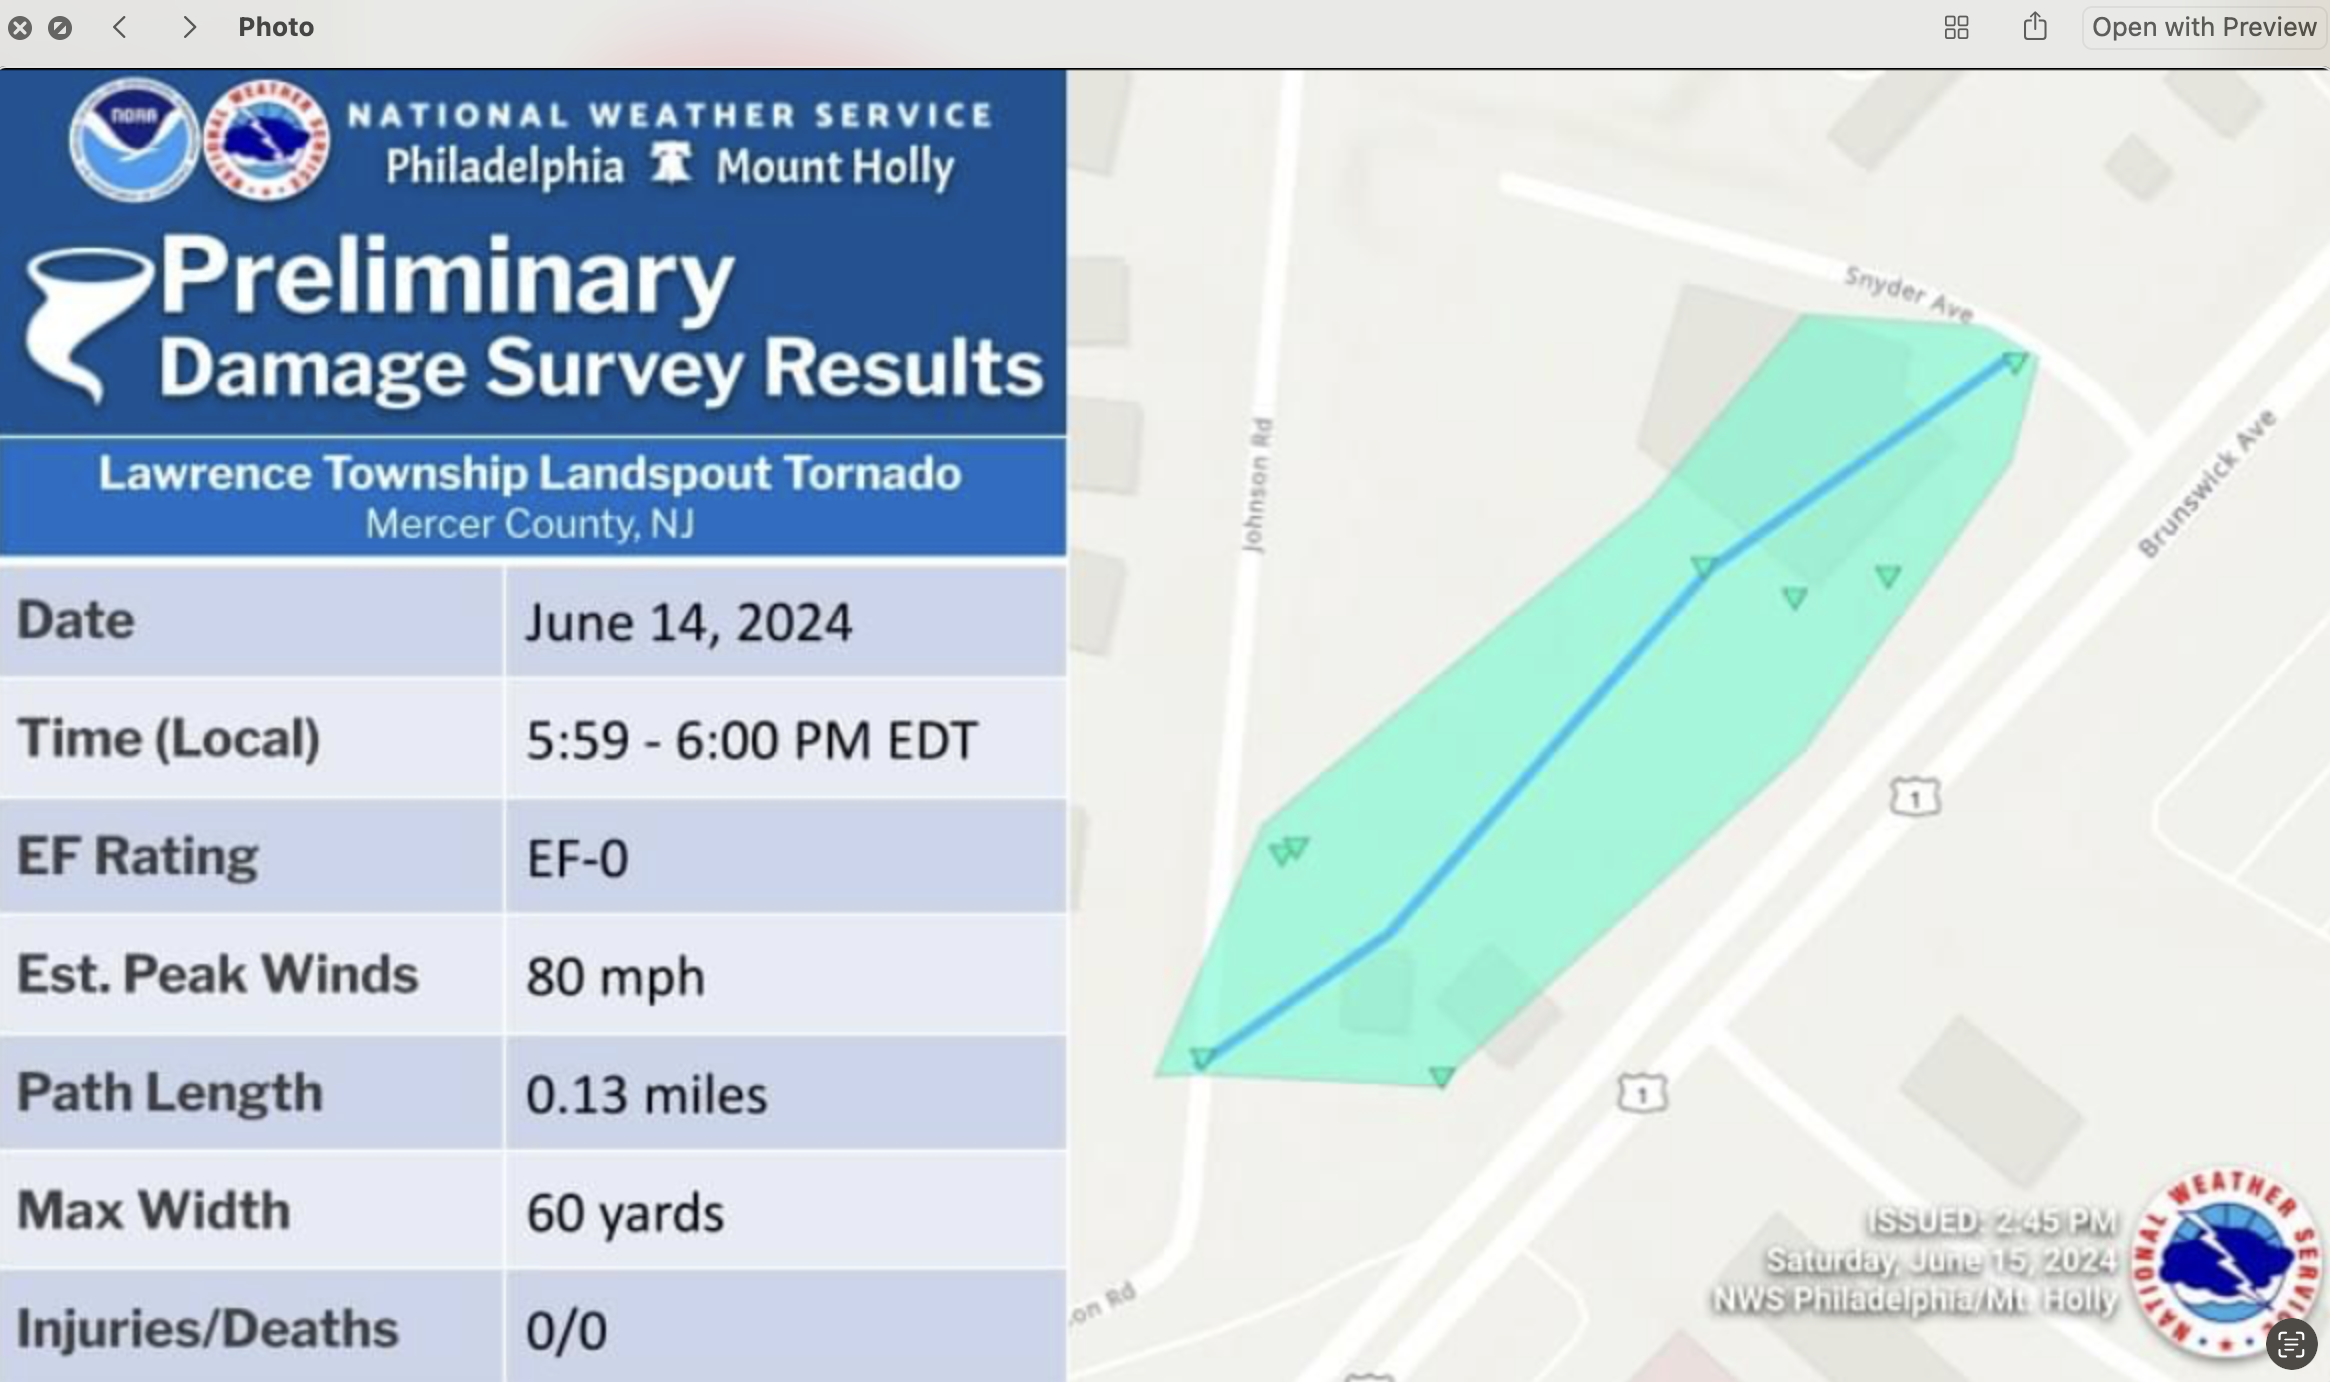
Figure 8. National Weather Service survey report for the EF-0 tornado in Lawrence Township on June 14th.
Evening storms in the northwest on the 21st deposited 1.61”, 1.48” and 0.76” at three Vernon Township locations, with the next largest report 0.29” at Stillwater (Sussex). Localized showers over central and northern areas during the evening of the 22nd mainly focused on an area of Hunterdon and western Somerset counties near Interstate 78. Isolated pea-size hail was reported in Somerset and Morris counties, but the main event was in the southern half of Lebanon Township where two CoCoRaHS stations reported 5.59” and 5.22”. Elsewhere in the township, stations reported 1.92”, 1.44”, and the most northern station 0.65”. Some roadside water rescues resulted from the deluge. A NWS radar estimate of rainfall in the general Hunterdon area is shown in Figure 9 (top). The bottom map zooms in on the heaviest hit region near Lebanon Township. There were strong storms elsewhere that resulted in reports of trees down and power out in locations within eight counties. Some pea to quarter inch diameter hail fell in Somerset and Morris counties. Some additional rainfall totals included Lopatcong Township (Warren) 3.06”, Greenwich Township (Warren) 2.92”, Readington Township 2.63”, and Bridgewater Township (Somerset) 2.06”, 1.58”, 1.12”, and 0.89” (4 stations).
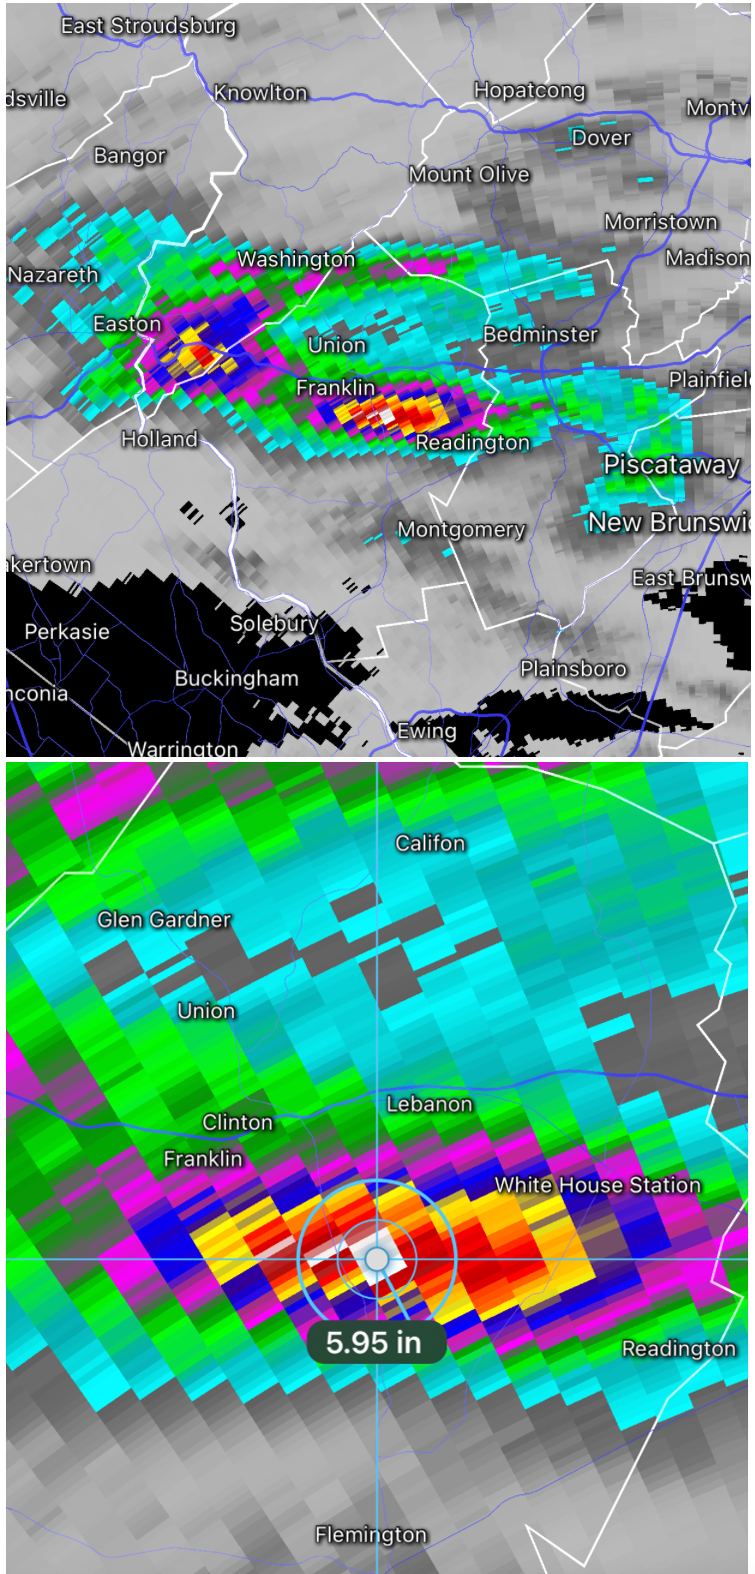
Figure 9. NWS radar-estimated rainfall for west central NJ and extreme eastern PA for June 22nd (top) and zoomed in for the Hunterdon County area (bottom).
The next day brought strong afternoon storms to south Jersey, resulting in damage reports filed for eight counties due to downed trees and power outages. A tragic lightning death occurred on the Seaside Heights beach during a strong storm that was ushered in by an impressive shelf cloud (Figure 10). There were some reports of small hail and rain amounted to as much as 2.80” in Berkeley Township (following a high of 100°), Hamilton (Atlantic) 2.73”, Mullica (Atlantic) 1.76”, Hammonton 1.71”, and 1.61” at both Monroe Township (Gloucester) and Surf City (Ocean; Figure 11). Winds gusted to 54 mph in Logan Township (Gloucester), Pennsauken 50 mph, and 40–44 mph at six other NJWxNet stations.

Figure 10. Shelf cloud along the Seaside Heights coast as storm approaches during early evening on June 23rd. Photo courtesy of Eddie Podesta.
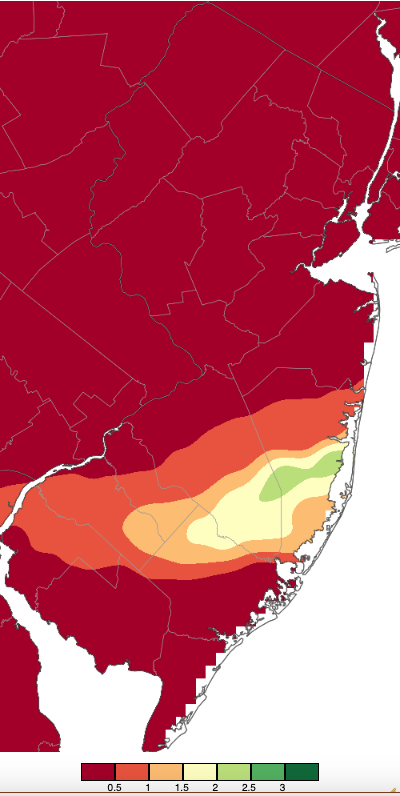
Figure 11. Precipitation across New Jersey from 8 AM on June 23rd through 8 AM June 24th based on a PRISM (Oregon State University) analysis generated using NWS Cooperative, CoCoRaHS, NJWxNet, and other professional weather station observations.
Rather deep low pressure accompanied this system. As the storm departed on the 24th, unusually strong winds blew for a fair-weather late June day. Seaside Heights saw a gust to 52 mph, seven NJWxNet stations reached 40–49 mph, and an impressive 32 stations gusted from 30–39 mph over the course of the day.
A squall line moved through the north during the early evening of the 26th. This was followed by more storms across most of NJ later in the evening into the early hours of the 27th. Rain totals ran as high as 1.93” in Manchester Township (Ocean), Ocean Township (Monmouth) 1.87”, Burlington 1.62”, and Brick (Ocean) 1.55” (Figure 12). Of 241 CoCoRaHS reports, 22 were from 1.00”–1.49” and 113 from 0.50”–0.99”. The storms on the 26th brought strong winds that gusted to 59 mph in Hackettstown (Warren), Lower Alloways Creek Township 55 mph, Columbus (Burlington) 52 mph, Stewartsville (Warren) 50 mph, and nine other NJWxNet stations from 40–49 mph. Fallen trees resulted in one death in Essex County and a serious injury in Bergen County. Nine counties reported damage and power outages. Winds on the 27th gusted to 49 mph at Sea Girt, Little Egg Harbor Township (Ocean) 48 mph, and 43 mph at both Fortescue and Upper Deerfield (Cumberland).
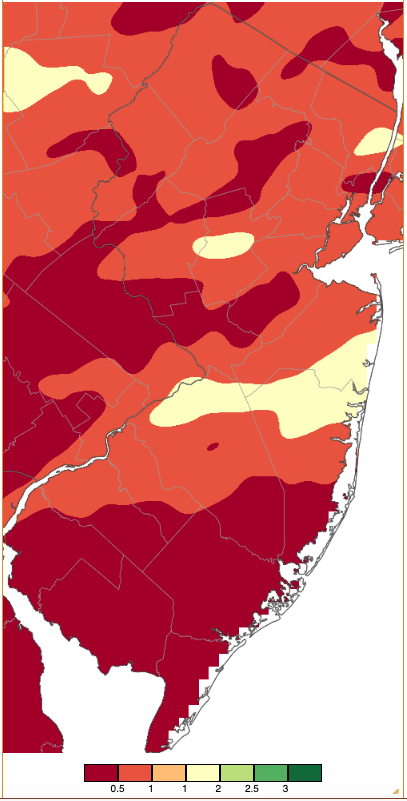
Figure 12. Precipitation across New Jersey from 8 AM on June 26th through 8 AM June 27th based on a PRISM (Oregon State University) analysis generated using NWS Cooperative, CoCoRaHS, NJWxNet, and other professional weather station observations.
The thermal impact of the arrival of one of the storms is seen in the time series from Hillsborough-Duke around 8:00 PM on the 26th (Figure 13). Within minutes, the temperature fell 20°, with a quick spike in the dew point that soon matched the air temperature (100% relative humidity) and remained for hours afterward.
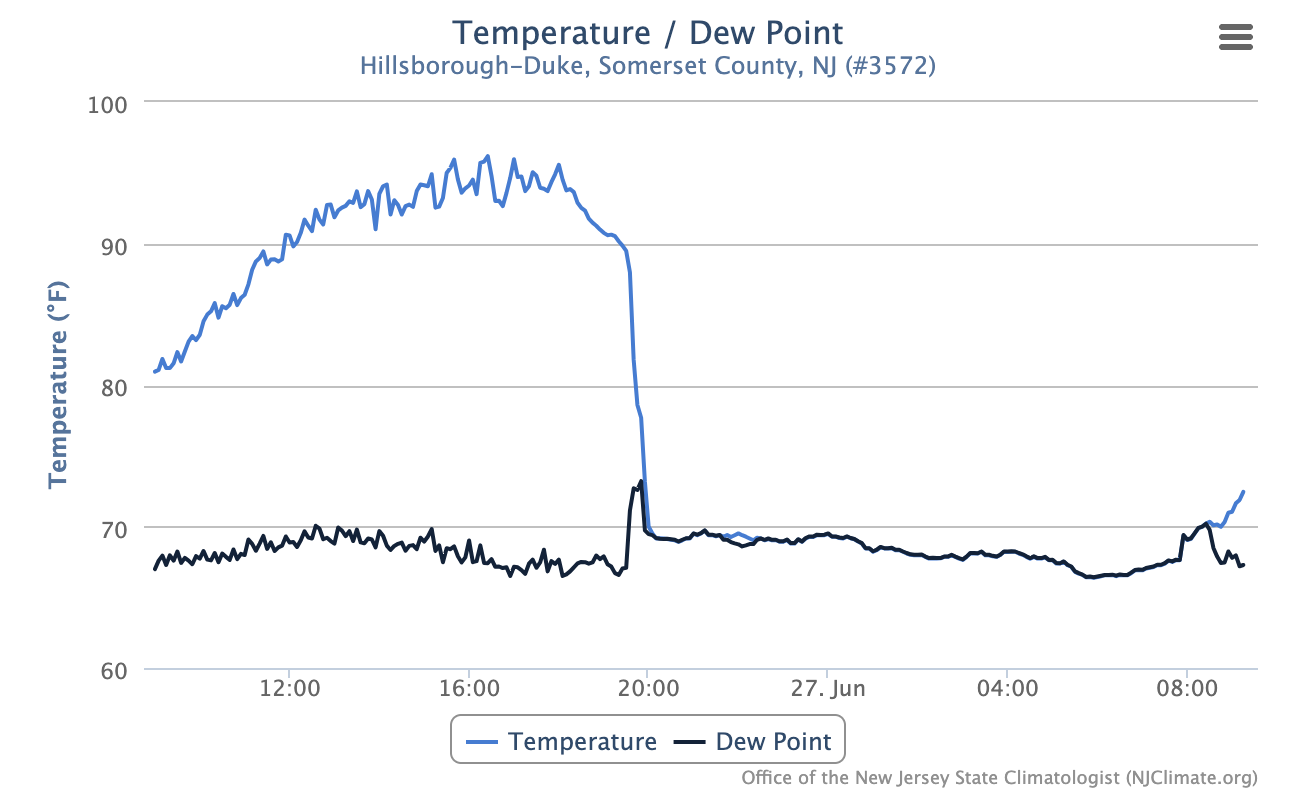
Figure 13. Time series of temperature and dew point at the Hillsborough/Duke NJWxNet station from approximately 9:00 AM on June 26th to 9:00 AM on June 27th.
Storms returned on the evening of the 29th, lasting past the morning observing time on the 30th. Up until observation time, which, as mentioned previously, served as the end of the June observing period, totals for the previous 24 hours included two Middle Township (Cape May) stations with 3.14” and 3.05”, Woodbine (Cape May) 2.24”, Ventnor City (Atlantic) and Somers Point (Atlantic) each at 2.21”, Egg Harbor Township (Atlantic) 2.14”, and Berlin (Camden) 2.03”.
Since the southern rain continued into the morning and later returned as other locations in the state received heavy totals (all ending before midnight on the 30th), Figure 14 is included showing combined June 30th and July 1st totals. Of 244 CoCoRaHS observations, 6.26” in Maurice River Township (Cumberland) led the pack. This was followed by Woodbine 5.09”, Middle Township 4.41” and 4.30” (two stations), two Somers Point stations at 4.06”, 11 stations from 3.00”–3.99”, 40 from 2.00”–2.99”, and 81 from 1.00”–1.99”. Winds on the 30th gusted to 51 mph at Lower Alloways Creek Township, Logan Township 49 mph, and 40–44 mph at five other NJWxNet stations.
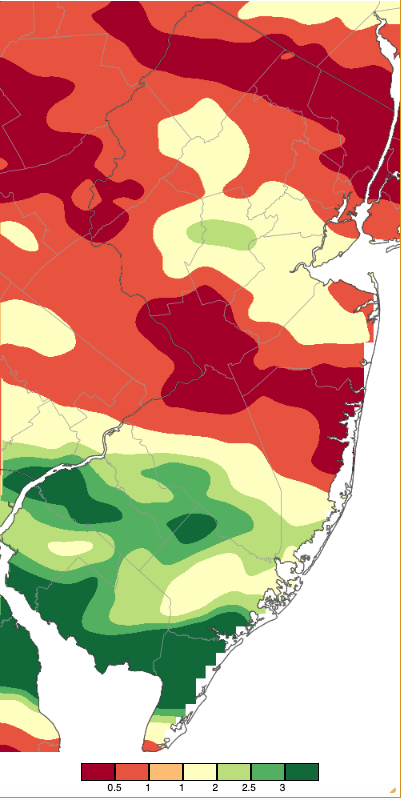
Figure 14. Precipitation across New Jersey from 8 AM on June 28th through 8 AM July 1st based on a PRISM (Oregon State University) analysis generated using NWS Cooperative, CoCoRaHS, NJWxNet, and other professional weather station observation. All rain fell before midnight on the 30th.
The highest barometric pressures of the month ranged from 30.25”–30.35” on the 18th and the lowest 29.45”–29.55” on the 6th. The six days with one or more NJWxNet stations gusting to 40 mph or greater were covered above.
The last US Drought Monitor map of June showed most of New Jersey categorized as Abnormally Dry (D0) on the 25th (Figure 15). Two southern areas were considered in the Moderate Drought range (D1) with two small areas not considered dry thanks to local heavier rains. Conditions improved in some areas with post 25th rains, though the state entered July with a need for continued timely ample rains.
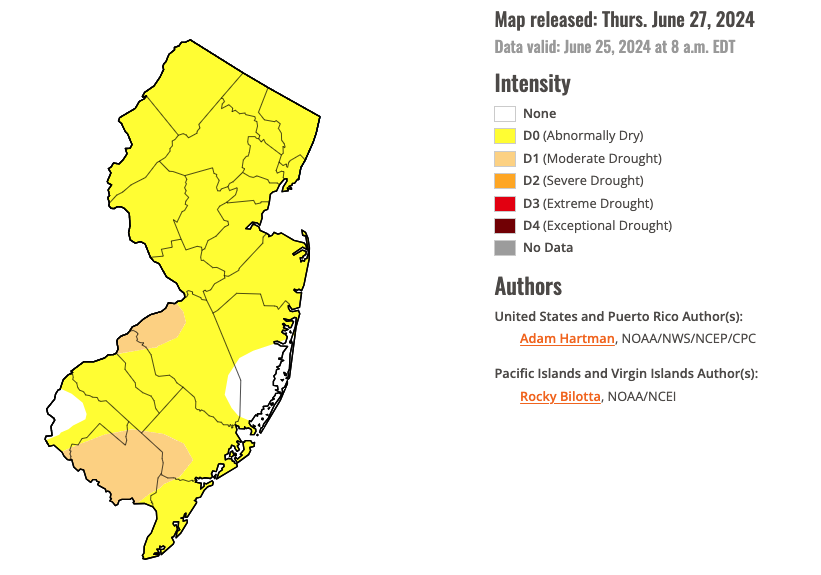
Figure 15. U.S. Drought Monitor map of conditions in NJ as of June 25th. Abnormally dry (D0) conditions have an expected recurrence interval of approximately 3–5 years while moderate drought (D1) conditions have an expected recurrence interval of approximately 5–10 years.
First Half of 2023 Overview
It should come as no surprise when noticing that each of the first six months of 2024 averaged above their 1991–2020 normals that the first half ranking would be high. In fact it was, coming in as the second warmest since records commenced in 1895 (Table 1). The 51.4° average was 3.1° above normal. Only 2012 was warmer and eight of the top ten warmest first halves have occurred since this century with the other two in the 1990s.
| Rank | Year | Jan.–June Avg. Temperature |
|---|---|---|
| 1 | 2012 | 52.0° |
| 2 | 2024 | 51.4° |
| 3 | 2023 | 51.0° |
| 4 | 1998 | 50.9° |
| 5 | 2020 | 50.3° |
| 5 | 2010 | 50.3° |
| 5 | 2017 | 50.3° |
| 8 | 2002 | 50.2° |
| 8 | 1991 | 50.2° |
| 10 | 2006 | 49.9° |
Table 2. The ten warmest January–June periods since 1895.
Statewide precipitation (rain and melted snow) for the first half of 2024 averaged 25.69". This was 3.39” above normal and ranks as the 21st wettest of the past 130 years. Totals were greatest in the northern Highlands and driest in the southwest and far south (Figure 16). Coming in with the most precipitation was Vernon Township (Sussex) 35.61”, followed by Mine Hill (Morris) 35.49”, Mt. Arlington (Morris) 34.58”, Lebanon Township (Hunterdon) 33.27”, and Berkeley Township (Ocean) 33.18”. On the low end was Lower Township (Cape May) 22.94”, followed by Upper Deerfield (Cumberland) 23.12”, Franklin Township (Gloucester) 24.72”, Galloway Township (Atlantic) 25.57”, and Barrington (Camden) 25.58”.
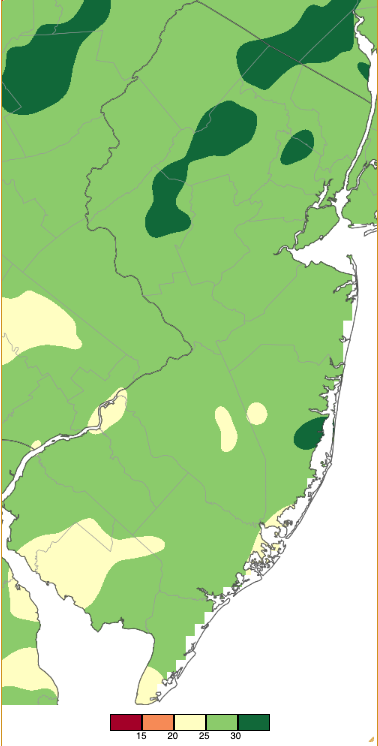
Figure 16. January–June 2024 precipitation across New Jersey based on a PRISM (Oregon State University) analysis generated using NWS Cooperative, CoCoRaHS, NJWxNet, and other professional weather station observations from 7 AM on December 31st to 8 AM on June 30th. Note the scale in full inches at the bottom of the map. Totals range from 22.00”–23.99” (dark red) to 32.00”–33.99” (dark green).


