record warm

Danger Lurks: July 2025 Recap

August 6, 2025 - 4:47pm -- Dave Robinson

Debris and rubble in the aftermath of flash flooding that occurred on July 14th in North Plainfield (Somerset County).

Tragically, this July demonstrated how weather danger lurks across the Garden State during summer months. July thunderstorm winds felled trees that resulted in three fatalities, lightning strikes killed two and injured others, and flash flooding took two lives and put countless others in perilous situations. No doubt, the often-relentless heat and humidity led to medical issues for those most vulnerable, be they old, young, infirmed, employed outdoors, or living in stifling locations devoid of air conditioning.

Temperature-wise, the July statewide average temperature of 78.1° was 2.7° above the 1991–2020 mean and ranked as the 6th warmest since records commenced in 1895. The average high of 87.7° was 2.0° above normal, ranking 12th warmest, while the average low of 68.5° was 3.4° above normal, ranking 3rd warmest. Eight of the ten warmest Julys have occurred since 2010 and twelve of fifteen since 1999. Only three Julys in the past 25 years have averaged below the 1991–2010 normal. The June–July average of 75.0° is the 5th warmest, only exceeded by 76.1° in 2010, 75.6° in 2024, and 75.2° in both 2020 and 2011.

The 5.44” statewide average July precipitation was 0.73” above normal, ranking 42nd wettest of the past 131 Julys. As is often seen during summer months, totals varied markedly over rather short distances, seen this month in both the north and south. Overall, the north averaged 4.62” (-0.10”, 64th wettest/68th driest), south 5.93” (+1.19”, 26th wettest), and coast 6.08” (+1.70”, 20th wettest).

Enigmas: June 2025 Recap, Plus First Half of 2025 Review

July 8, 2025 - 10:48am -- Dave Robinson

Photo of The Great Falls along the Passaic River in Paterson (Passaic County) on June 25th.

Looking back at the past month, or the first half of this year for that matter, “mysterious,” “puzzling,” or “difficult to understand” may best describe what has transpired when it comes to New Jersey’s weather and climate behavior. In other words, enigmas. More on the previous six months toward the end of this report. First a look at June, which followed a drought-busting (and hopefully not just interrupting) 7th wettest May, but resumed an only twice-broken string of months with below-normal precipitation back to May 2024 (August 2024 and May 2025). Then there were cool days that had some wondering when summer would ever arrive. That was answered with a vengeance later in the month with one of the more torrid June heatwaves on record. The worst of it ended by an unseasonable backdoor cold front.

When all was said and done, the statewide average temperature of 71.9° was 1.6° above the 1991–2020 normal. This ties with 2011 as the 9th warmest June since records commenced in 1895. Eight of the fifteen warmest Junes of the past 131 have occurred since 2005. The average high of 81.5° was 0.5° above normal and ranks 32nd warmest. The average low of 62.2° was 2.6° above normal and ranks 3rd warmest.

Rainfall was quite sparse, especially in the south. Statewide, precipitation averaged 2.64”. This was 1.66” below normal and ranks as the 25th driest June on record. This was the fourth June this century to rank so dry. While these low totals are concerning, especially in a hot summer month, the near-average rains of early spring and the wet May led the NJ Department of Environmental Protection to lift the statewide Drought Warning issued in November 2024, only retaining a Drought Watch in the Coastal South division. This retention was the result of continuing below-normal groundwater levels in this region with its sandy substrate.

Pressure/Warmth Prevails as Drought Arrives: December/Annual 2024 Report

January 8, 2025 - 8:27pm -- Dave Robinson

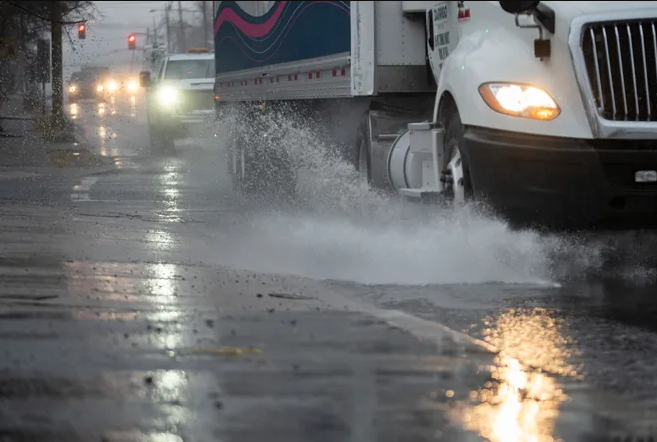
A truck splashes a puddle on Route 46 in Ridgefield Park (Bergen County) on December 9th, 2024. December helped ameliorate drought conditions, but not eliminate it. Photo by Julian Leshay Guadalupe/NorthJersey.com

The theme of “pressure” was selected to define the last month of 2024. In an absolute sense, this refers to a mid-December period with the highest atmospheric pressure recorded in New Jersey in over 40 years. It can also be linked with pressure differentials over the course of the month that resulted in many windy days. In a relative sense, it refers to the need to recoup the substantial precipitation deficit for the second half of the year in hopes that water resources will rebound, and by spring, drought will not be of great concern. Some progress in that direction was made from late November through December, but far more is needed in upcoming months. Following a recap of December conditions, this report will conclude with an overview of the Garden State’s weather/climate of 2024, including a link to our annual top 10 event list.

Statewide, December precipitation was more plentiful than any month since August, though still below the 1991–2020 normal. The rain and melted snow averaged 3.67”. This was 0.60” below normal and ranks as the 65th driest (66th wettest) since statewide records commenced in 1895. As seen most often throughout 2024, south Jersey was drier than the north in December. The southern climate division (Mercer/Middlesex/Monmouth south, except east of the Garden State Parkway) averaged 3.55” (-0.73”, 63rd driest/68th wettest), the coastal division (east of the Parkway) came in at 3.21” (-1.15, 55th driest/76th wettest), and the northern division (Hunterdon/Somerset/Union and north) averaged 3.92” (-0.33”, 70th driest/61st wettest).

The Lion Roars: March 2024 Recap

April 5, 2024 - 8:04pm -- Dave Robinson

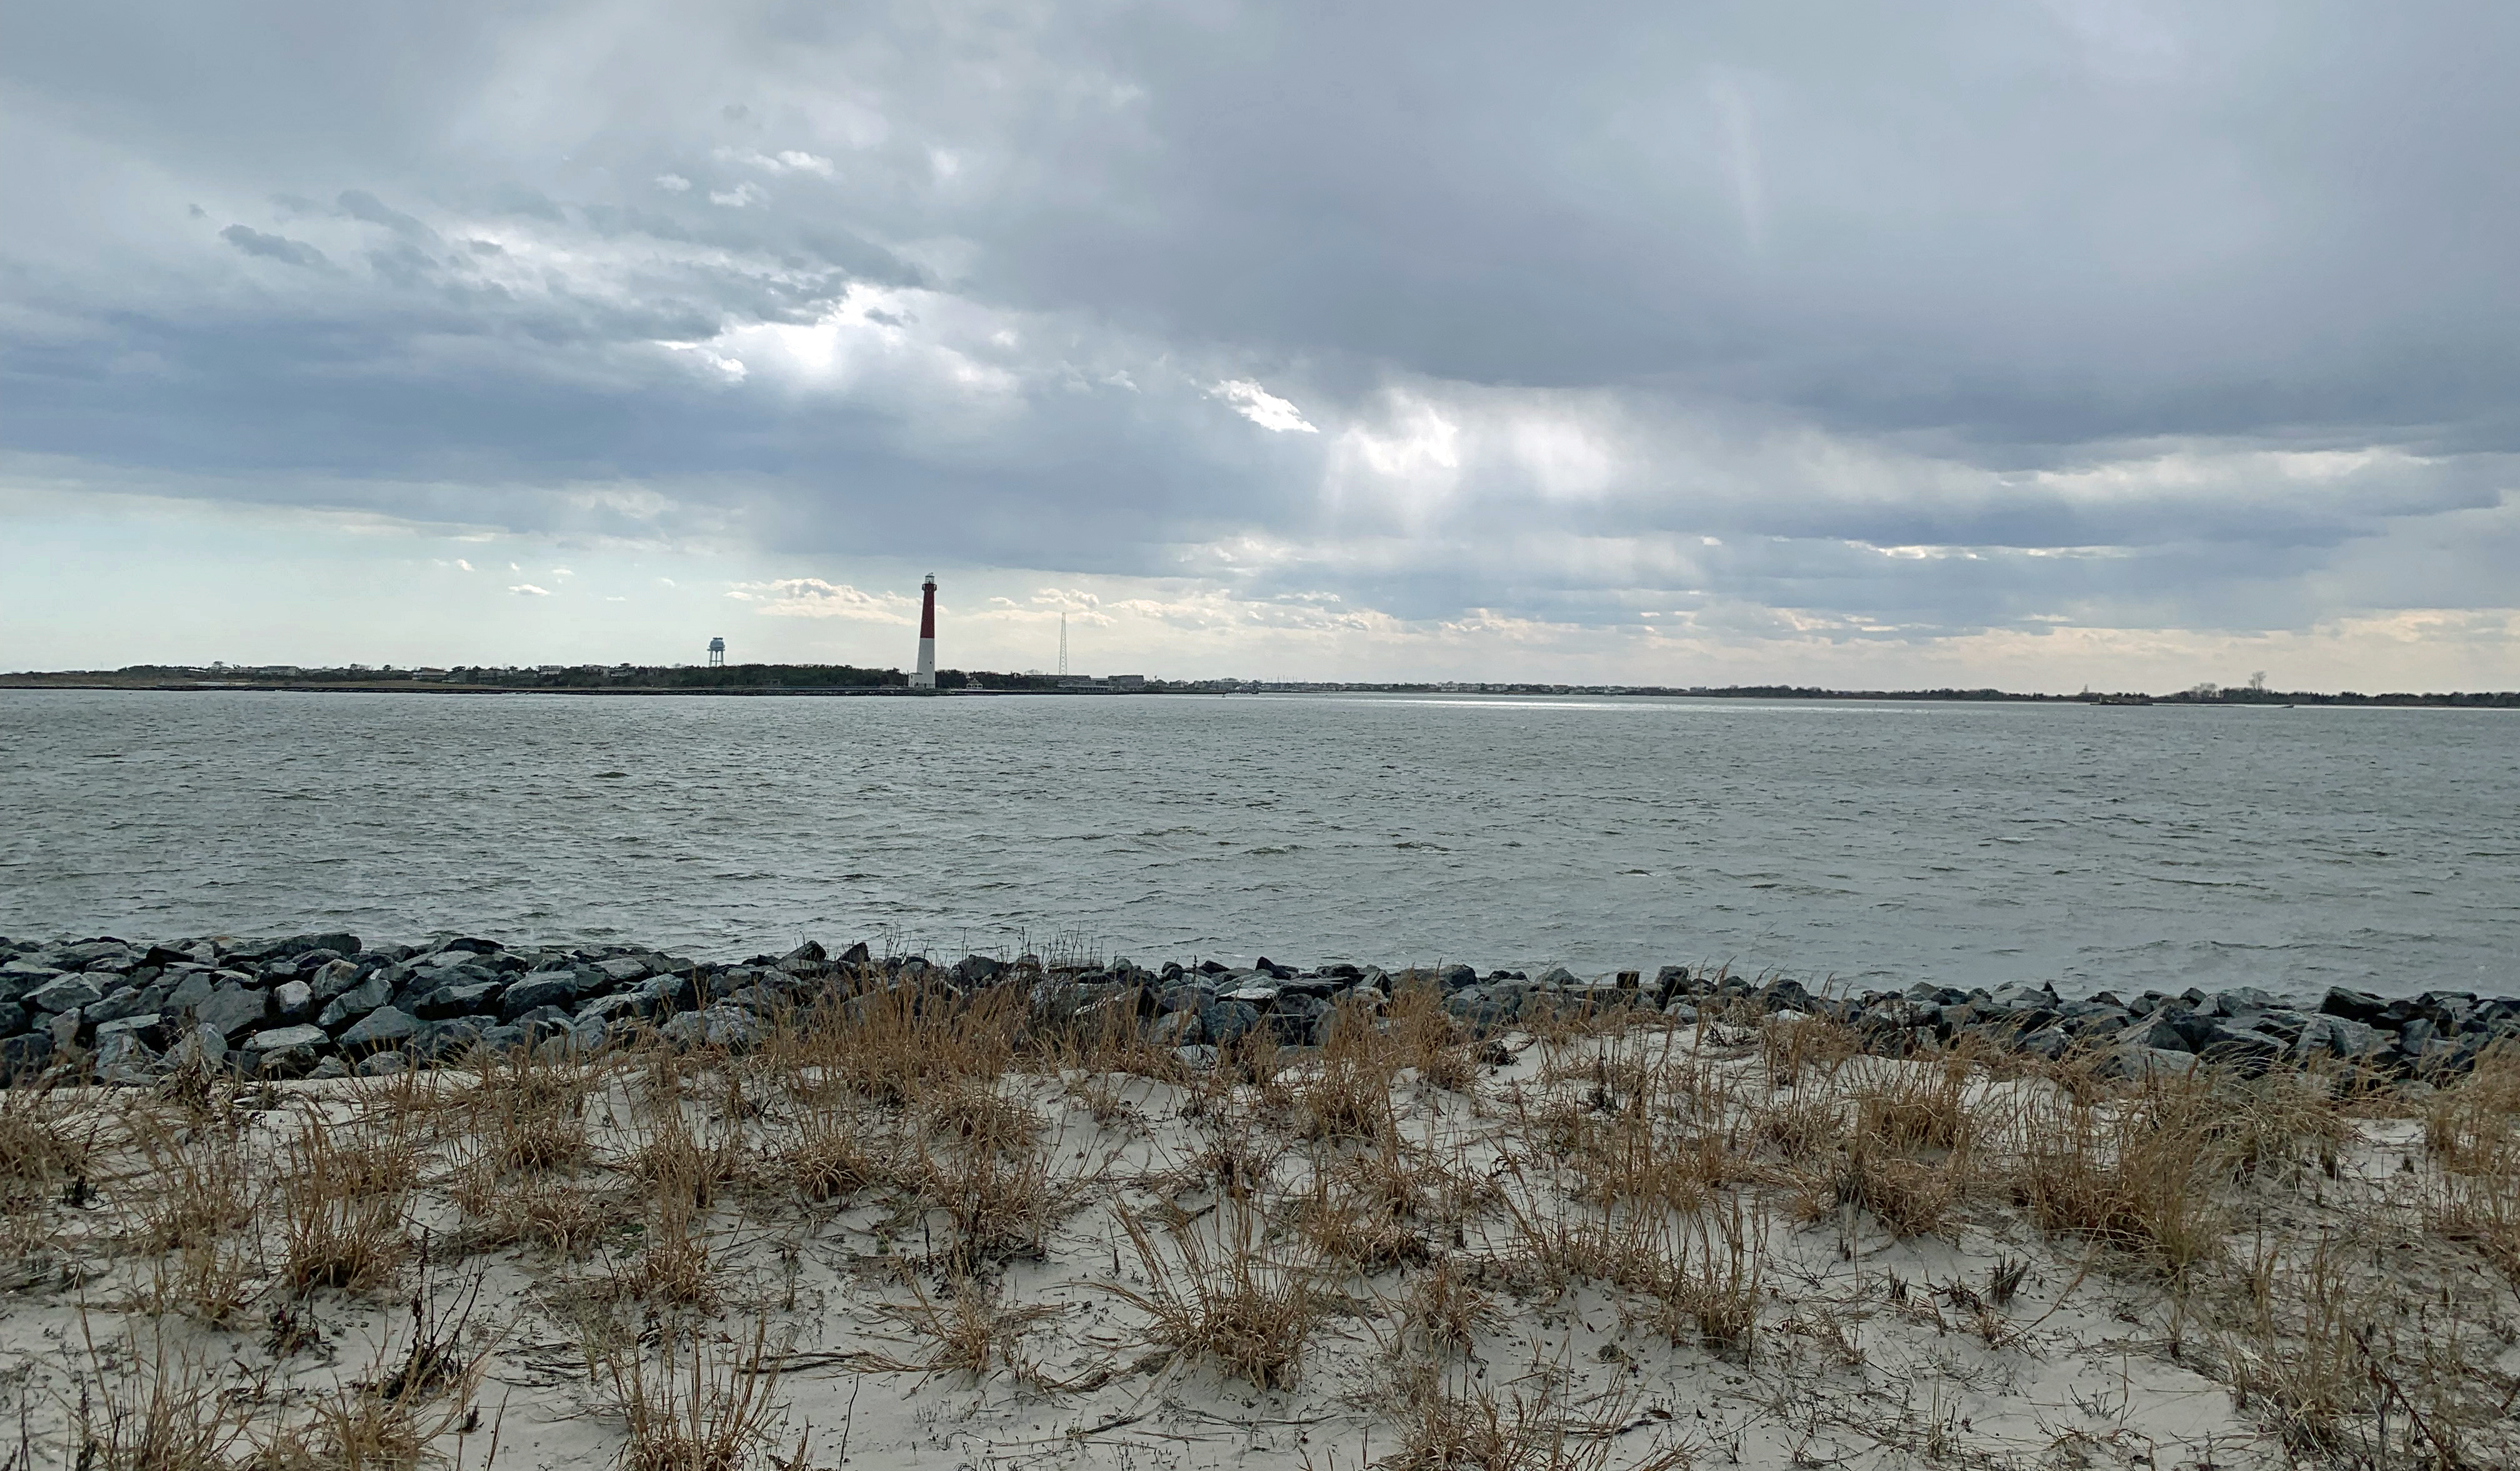
Looking south from Island Beach State Park toward Long Beach Island and the Barnegat Lighthouse on March 20th (photo by Dave Robinson).

So much for March flipping from lion to lamb or vice versa. March 2024 was often a lion throughout, with frequent roaring winds and multiple rain events producing a near-record monthly precipitation total and occasional flooding. The first half of the month ran at a record-warm pace, the monthly average later to be tempered by a second half that was cooler than the first. Still, the month emerged as the 9th mildest on record. Befitting the overall mild conditions, snowfall was scarce to non-existent.

Winds gusted to 35 mph or higher at one or more Rutgers NJ Weather Network (NJWxNet) station on 16 days, exceeding 40 mph on 11 of those days. Precipitation (rain and the water equivalent of the very little snow that fell) averaged 7.76” across the state. This is 3.56” above the 1991–2020 normal and ranks as the third wettest March since records commenced in 1895. The northwest was least wet with 6.00”–7.00” falling. Totals increased to the southeast where near coastal areas received 9.00”–10.00”. The northern climate division averaged 7.01” (+3.00, 6th wettest), the southern division 8.15” (+3.83”, 3rd wettest), and the coastal division 8.98” (+4.56, 2nd wettest).

The statewide average March temperature was 46.0°. This is 5.0° above normal and ranks as the 9th mildest of the past 130 years. The average high temperature of 55.6° was 4.7° above normal and ranks 10th mildest. The average low of 36.3° was 5.1° above normal and ranks 4th mildest. The northern division averaged 43.9° (+5.1°, 9th mildest), southern division 47.2° (+4.8°, 8th mildest), and coastal division 47.0° (+4.8°, 7th mildest).

ONJSC's Top 10 NJ Weather and Climate Events of 2022

January 3, 2023 - 7:14pm -- Dave Robinson

Trees and grass impacted by excessively dry conditions on Livingston Campus at Rutgers University in Piscataway (Middlesex County), as the summer drought ranked as the #1 most impactful weather/climate events of 2022 . Photo taken by D. Robinson on August 1st, 2022.

For the 14th consecutive year, we in the state climate office have evaluated the myriad daily, monthly, and annual observations gathered across New Jersey during the course of the year to choose what we feel were the most significant and impactful 10 weather and climate events of 2022. More about each event can be found in the monthly narratives posted on our website. You might be tempted to rearrange the rankings, particularly as some of the events on the list may have affected you more than others ranked higher. Or perhaps you best recall one that didn't make the list. That's the enjoyment and frustration of lists! Unless stated otherwise, statewide values are based on an average of several dozen stations. The period of record for monthly, seasonal, and annual departures is 1991–2020; while for extremes and rankings it is from 1895–present. Observations are mainly drawn from National Weather Service Cooperative Observing Program stations, Rutgers NJ Weather Network stations, and NJ Community Collaborative Rain, Hail, and Snow Network locations.

Subscribe to RSS - record warm