Fall

A Tale of Two Novembers, and Leaning Warmer and Wetter Than Normal: November and Fall 2022 Recap

December 12, 2022 - 4:31pm -- Dave Robinson

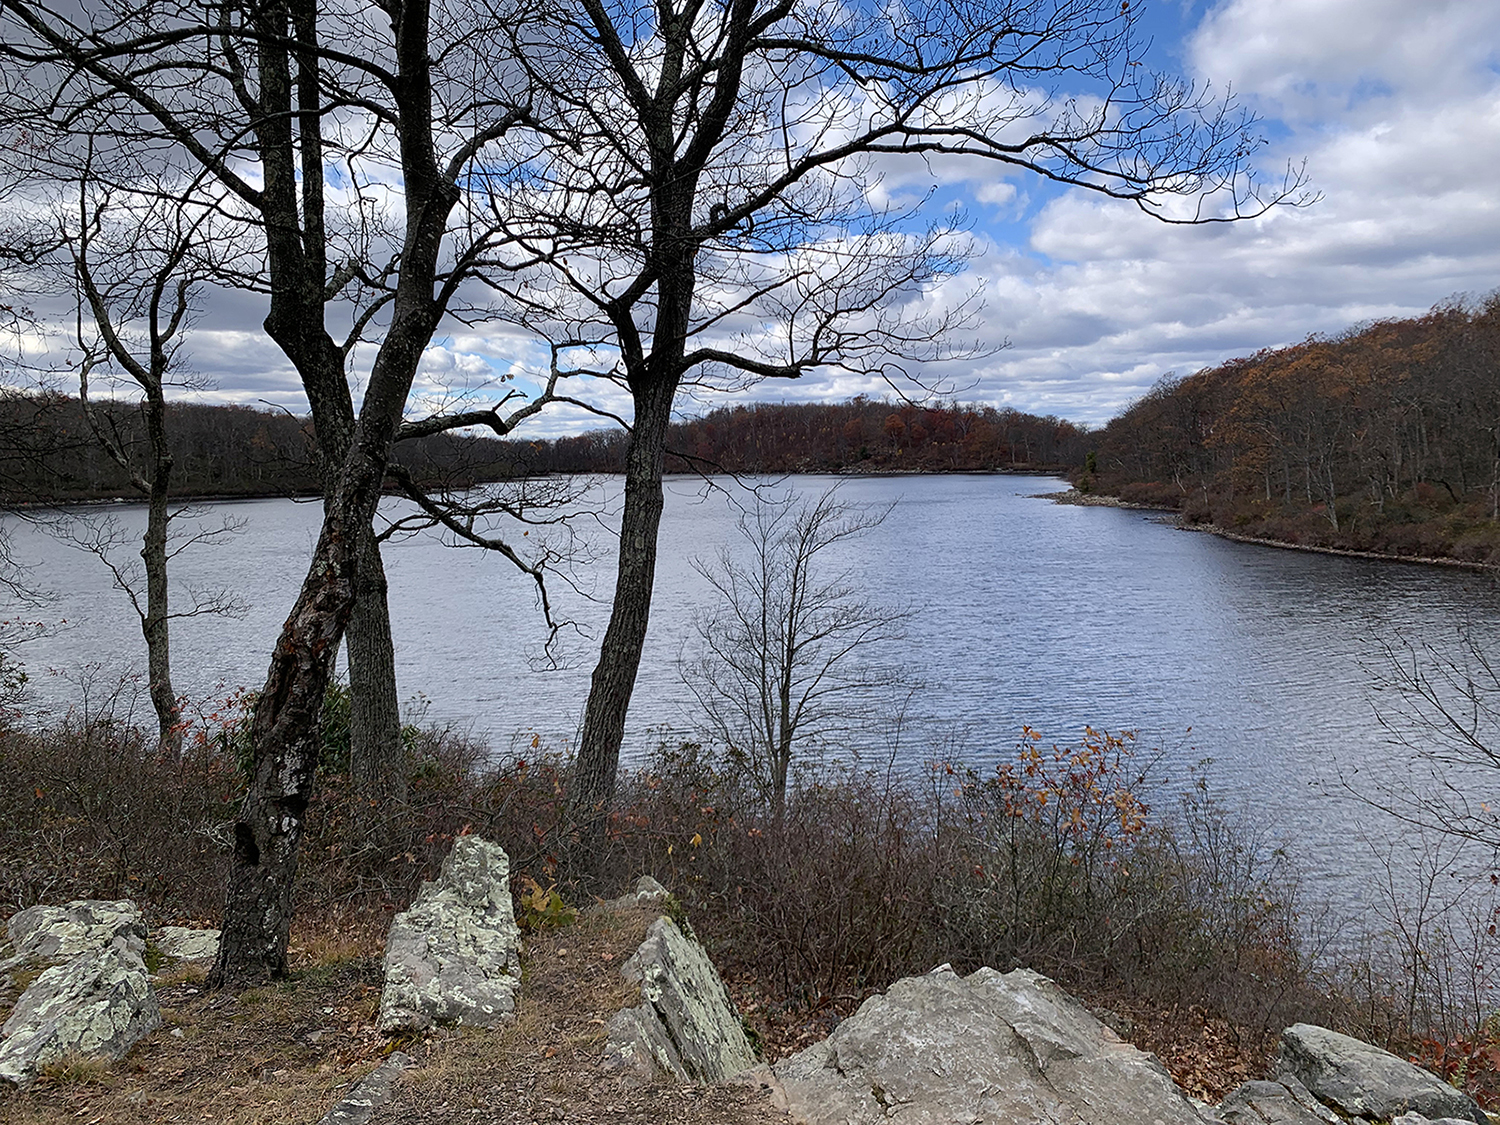
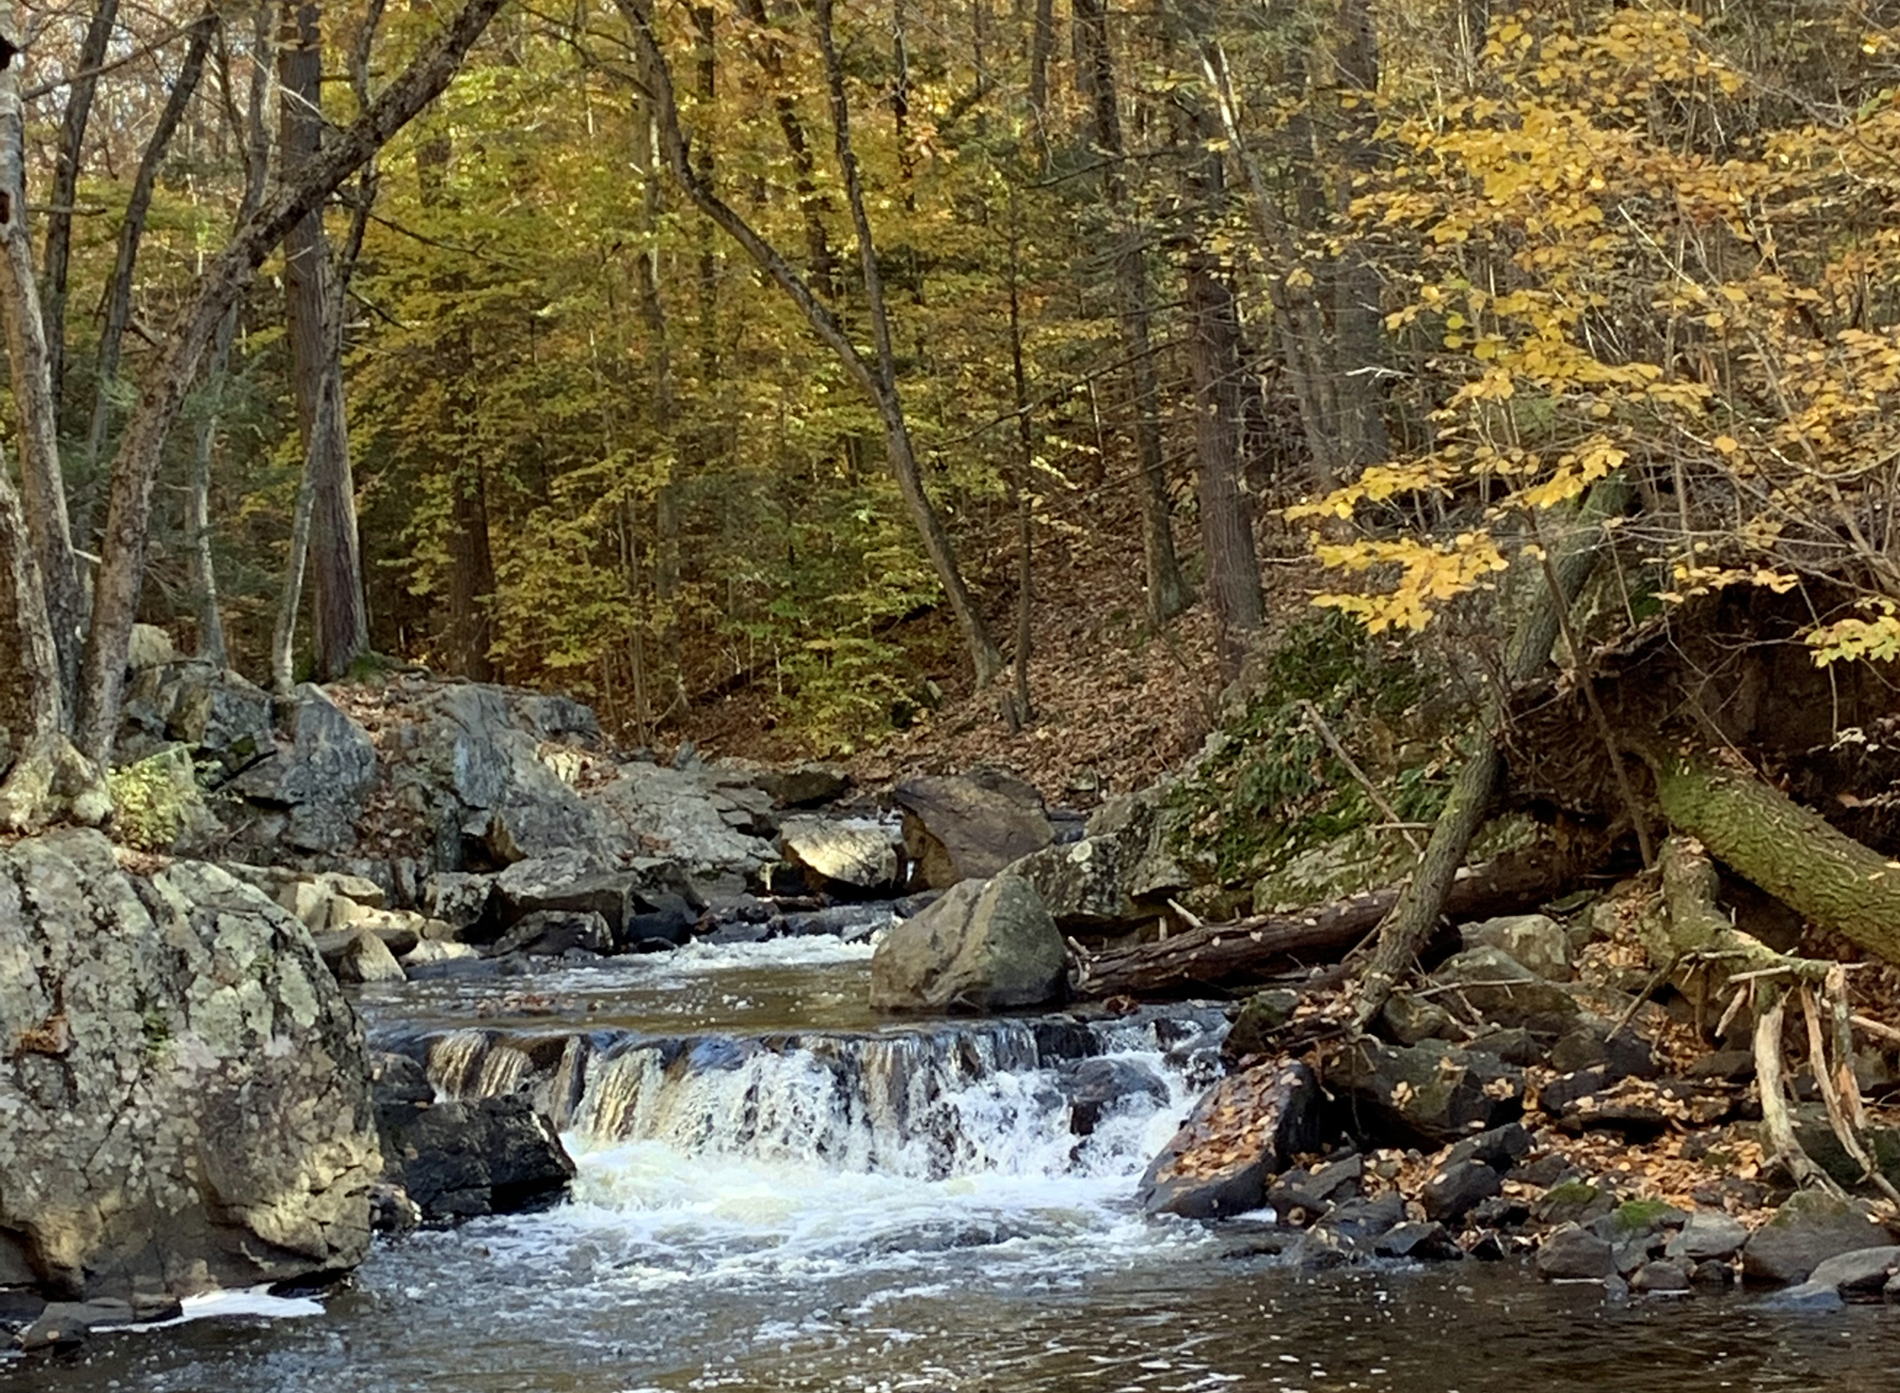
An autumnal view along the Lamington River in Hacklebarney State Park on the border of Chester Twp. and Washington Twp. (Morris County). Photo by Dave Robinson.

Last month’s report spoke of how “classic” the weather was during October. November’s weather could be classified as being anything but such. The month began with perhaps the warmest first ten days of November on record in the Garden State, an interval that ranked up there with early November 2020. Then came winter-like temperatures for about ten days leading up to Thanksgiving before the month ended on a closer-to-normal note. There were only two mid-month events that brought more than an inch of rain to parts of the state, one associated with the remnants of a late-season hurricane that struck Florida. Portions of central and northern NJ saw the first snowflakes of the season during the cold spell, though aside from some minor accumulations at higher elevations, mostly traces were observed.

With the ups and downs of temperature, November came out averaging 47.5° for the state as a whole. This is 2.4° above the 1991–2020 normal and ties as the 15th mildest eleventh month on record. Ten of the twenty mildest Novembers since 1895 have occurred since 2001. The statewide average high temperature of 58.1° was 3.4° above normal, ranking 10th mildest. The average low of 36.9° was 1.4° above normal, ranking 20th mildest. North Jersey averaged 45.2° (+2.1, 15th mildest), south Jersey 48.7° (+2.4°, 17th mildest), and the Jersey coast 50.0° (+2.7°, 13th mildest).

Statewide precipitation averaged 3.08”, which is 0.28” below normal and ranks as the 63rd driest (66th wettest) on record. The north averaged 2.98” (-0.28”, 63rd driest), south 3.14” (-0.15”, 71st driest), and coast 3.14” (-0.20”, 68th driest). As the monthly map shows, central and northern coastal areas were wettest, while the driest areas were scattered in the far south, central, and north. It must be noted that the rain falling during the second half of the 30th is not included in the monthly totals for the state, regions, or individual stations presented later in the report. By convention, the reporting day for most National Weather Service (NWS) Cooperative and Community Collaborative Rain, Hail, and Snow Network (CoCoRaHS) stations used in this report ends at morning observation time on the last day of the month. Totals from the afternoon of the 30th, to be included in December totals, ranged as high as about an inch, though mainly 0.25”–1.00”.

True Fall Colors: October 2022 Recap

November 7, 2022 - 6:00pm -- Dave Robinson

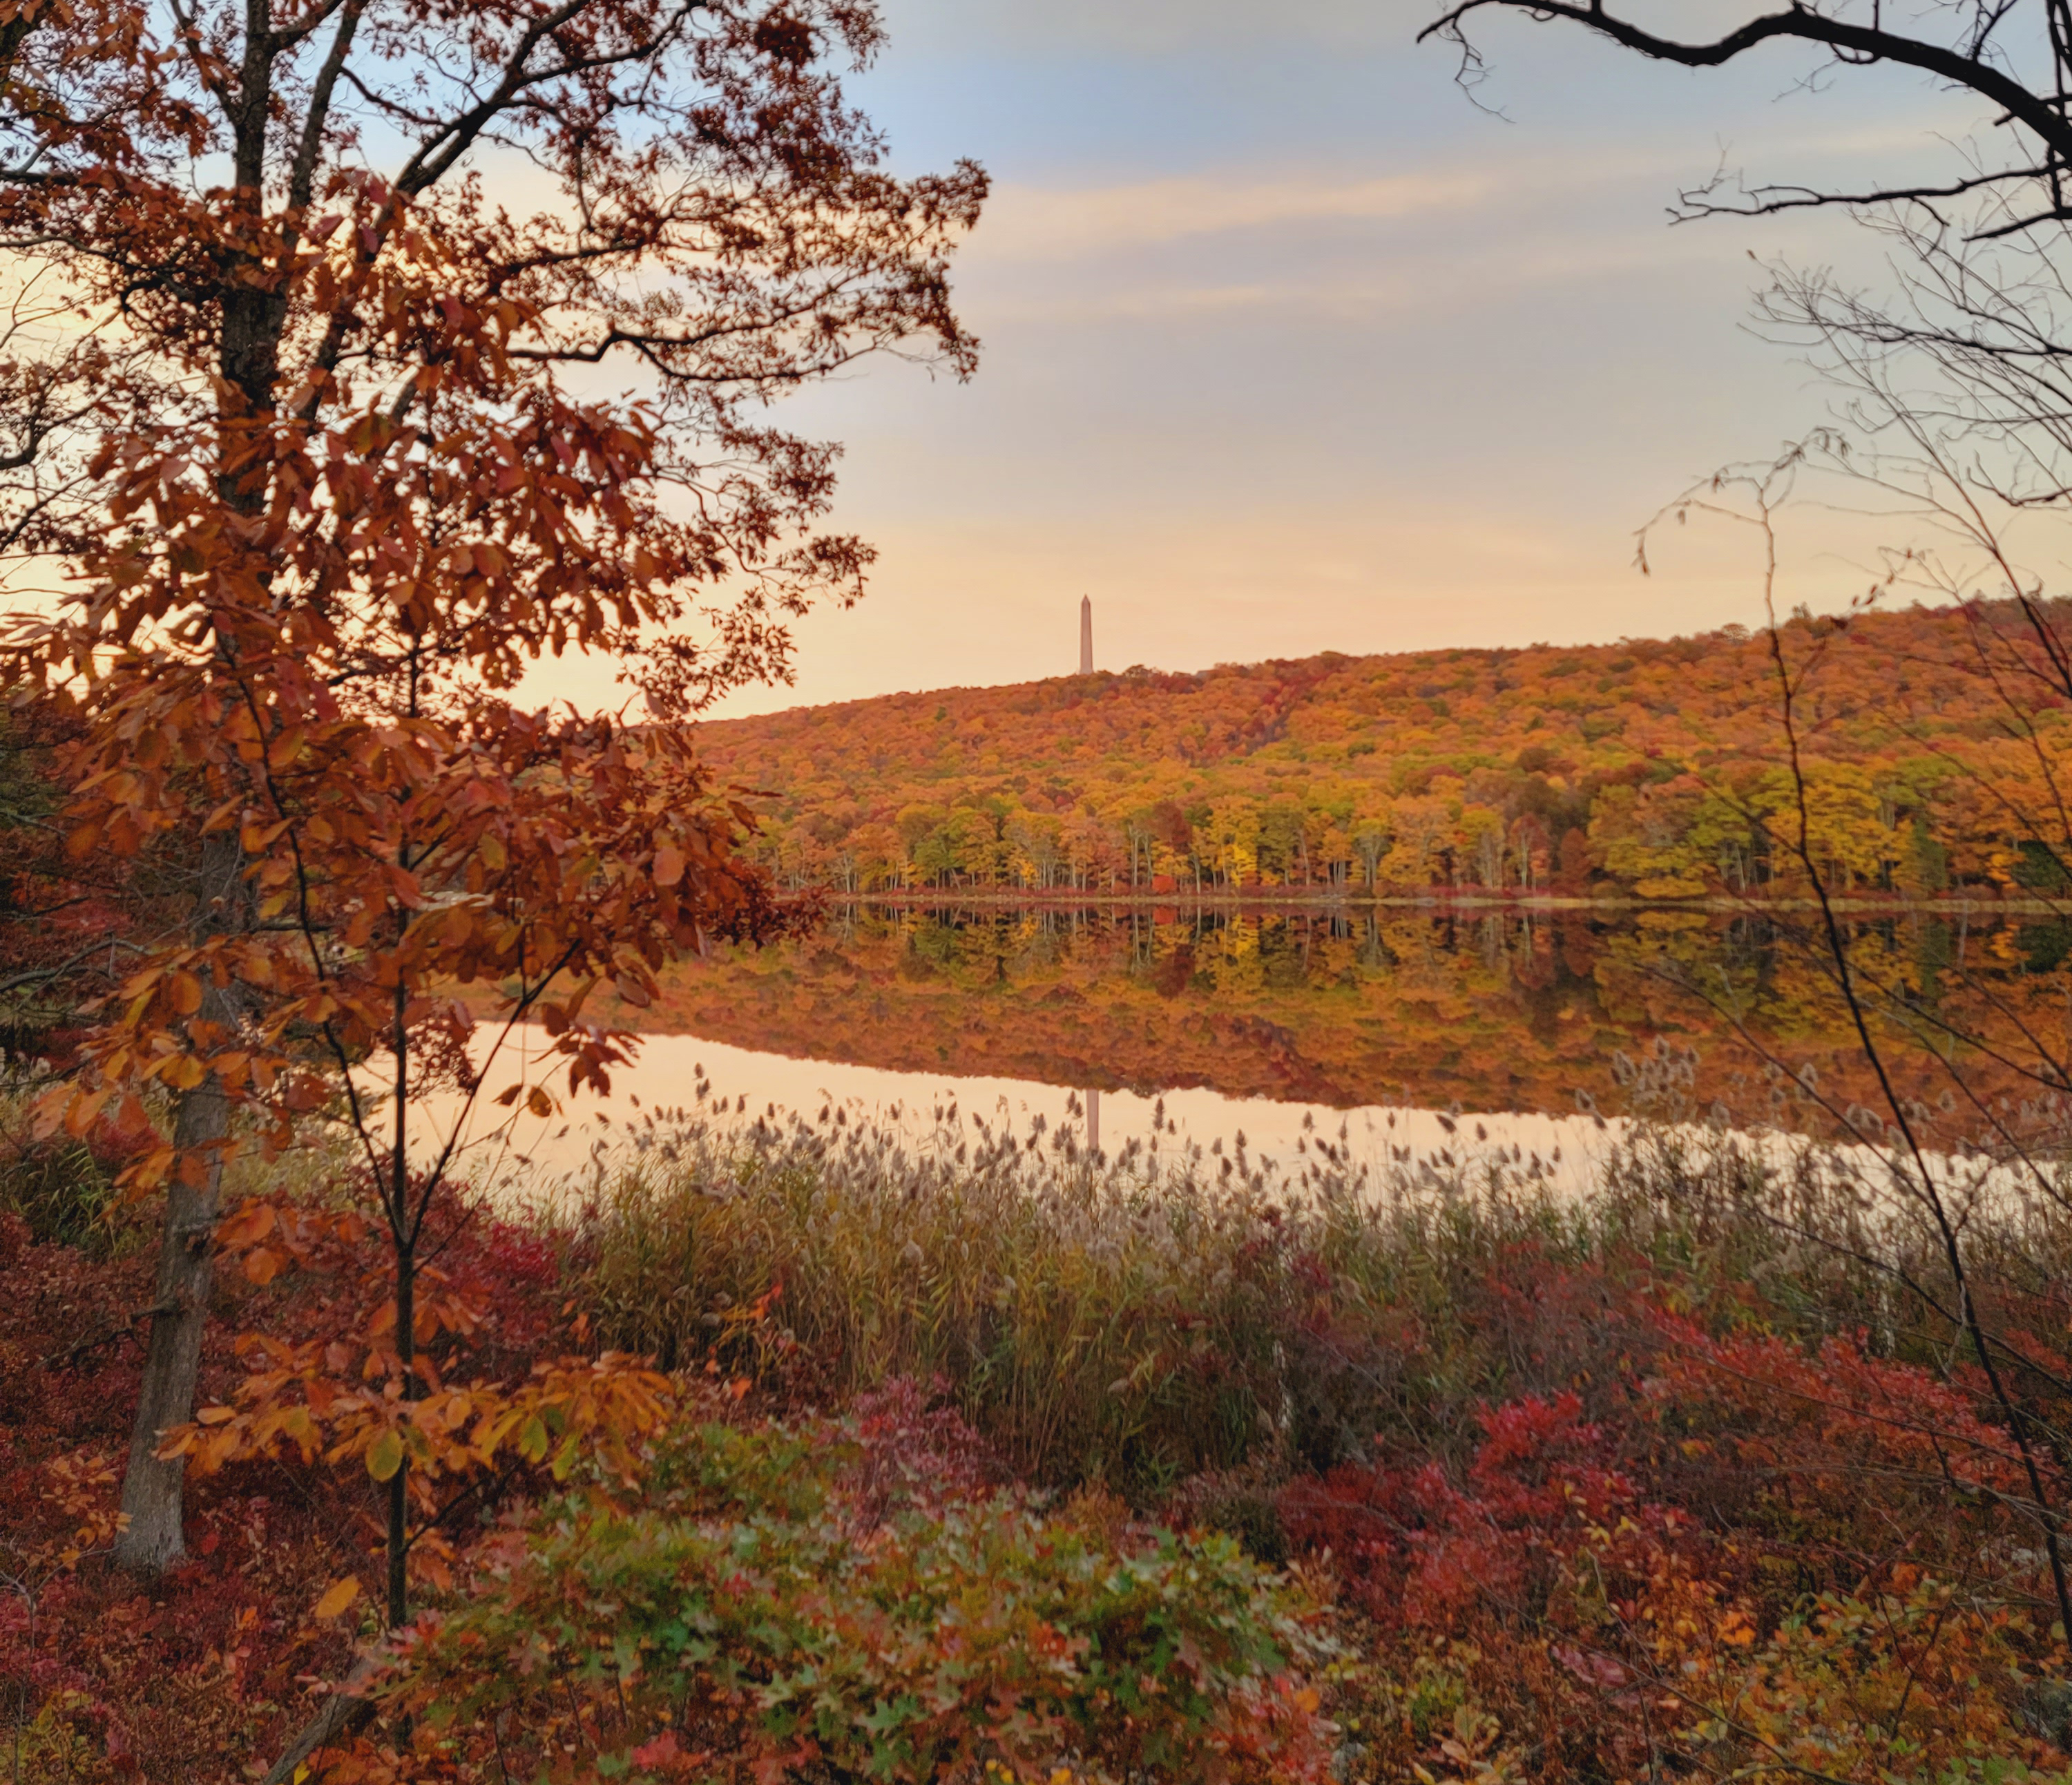
Brilliant fall foliage looking up towards High Point Monument (Sussex County) on October 22nd. Photo courtesy of Chris Stachelski.

There are years when many say that New Jersey didn’t experience “classic” fall weather. This October is not one of those years, as the month included rain, wind, and coastal flooding from the persistent remnants of a hurricane, many locations received their first frost and freezing temperatures to end the growing season, and there were days with a cloud-free deep-blue sky. October certainly showed its true fall colors.

October temperatures averaged 54.1° across NJ. This is 1.3° below the 1991–2020 normal and was the coolest October since 2009. It was the 57th coolest (tied with 4 other years) of the 128 since 1895. The average high was 64.5° which is 1.3° below normal and is the 48th coolest (tied with 3 years). The average low of 43.6° is 1.3° below normal and ranks 65th coolest (tied with 4 years). Northern NJ averaged 52.1° (-1.2°, 59th coolest [tied with 2 years]), southern 55.1° (-1.4°, 56th coolest [tied with 3 years]), and coastal 56.6° (-1.0°, 70th coolest [tied with 1 year]).

Rainfall was abundant, averaging 6.45” statewide. This is 2.26” above normal and ranks 10th wettest on record. It was the wettest since the record October 2005. Ten different decades are found in the top 15 years. The north averaged 5.88” (+1.43”, 21st wettest), south 6.75” (+2.72”, 6th wettest), and coast 7.53” (+3.44”, 3rd wettest). Coastal Monmouth, Ocean, and Atlantic counties were wettest, coming in at two to three times normal totals. While coming in close to normal, the driest areas were in the north central, far southern, and southwest regions.

Flipping the Seasonal Switch: September 2022 Recap

October 6, 2022 - 11:47am -- Dave Robinson

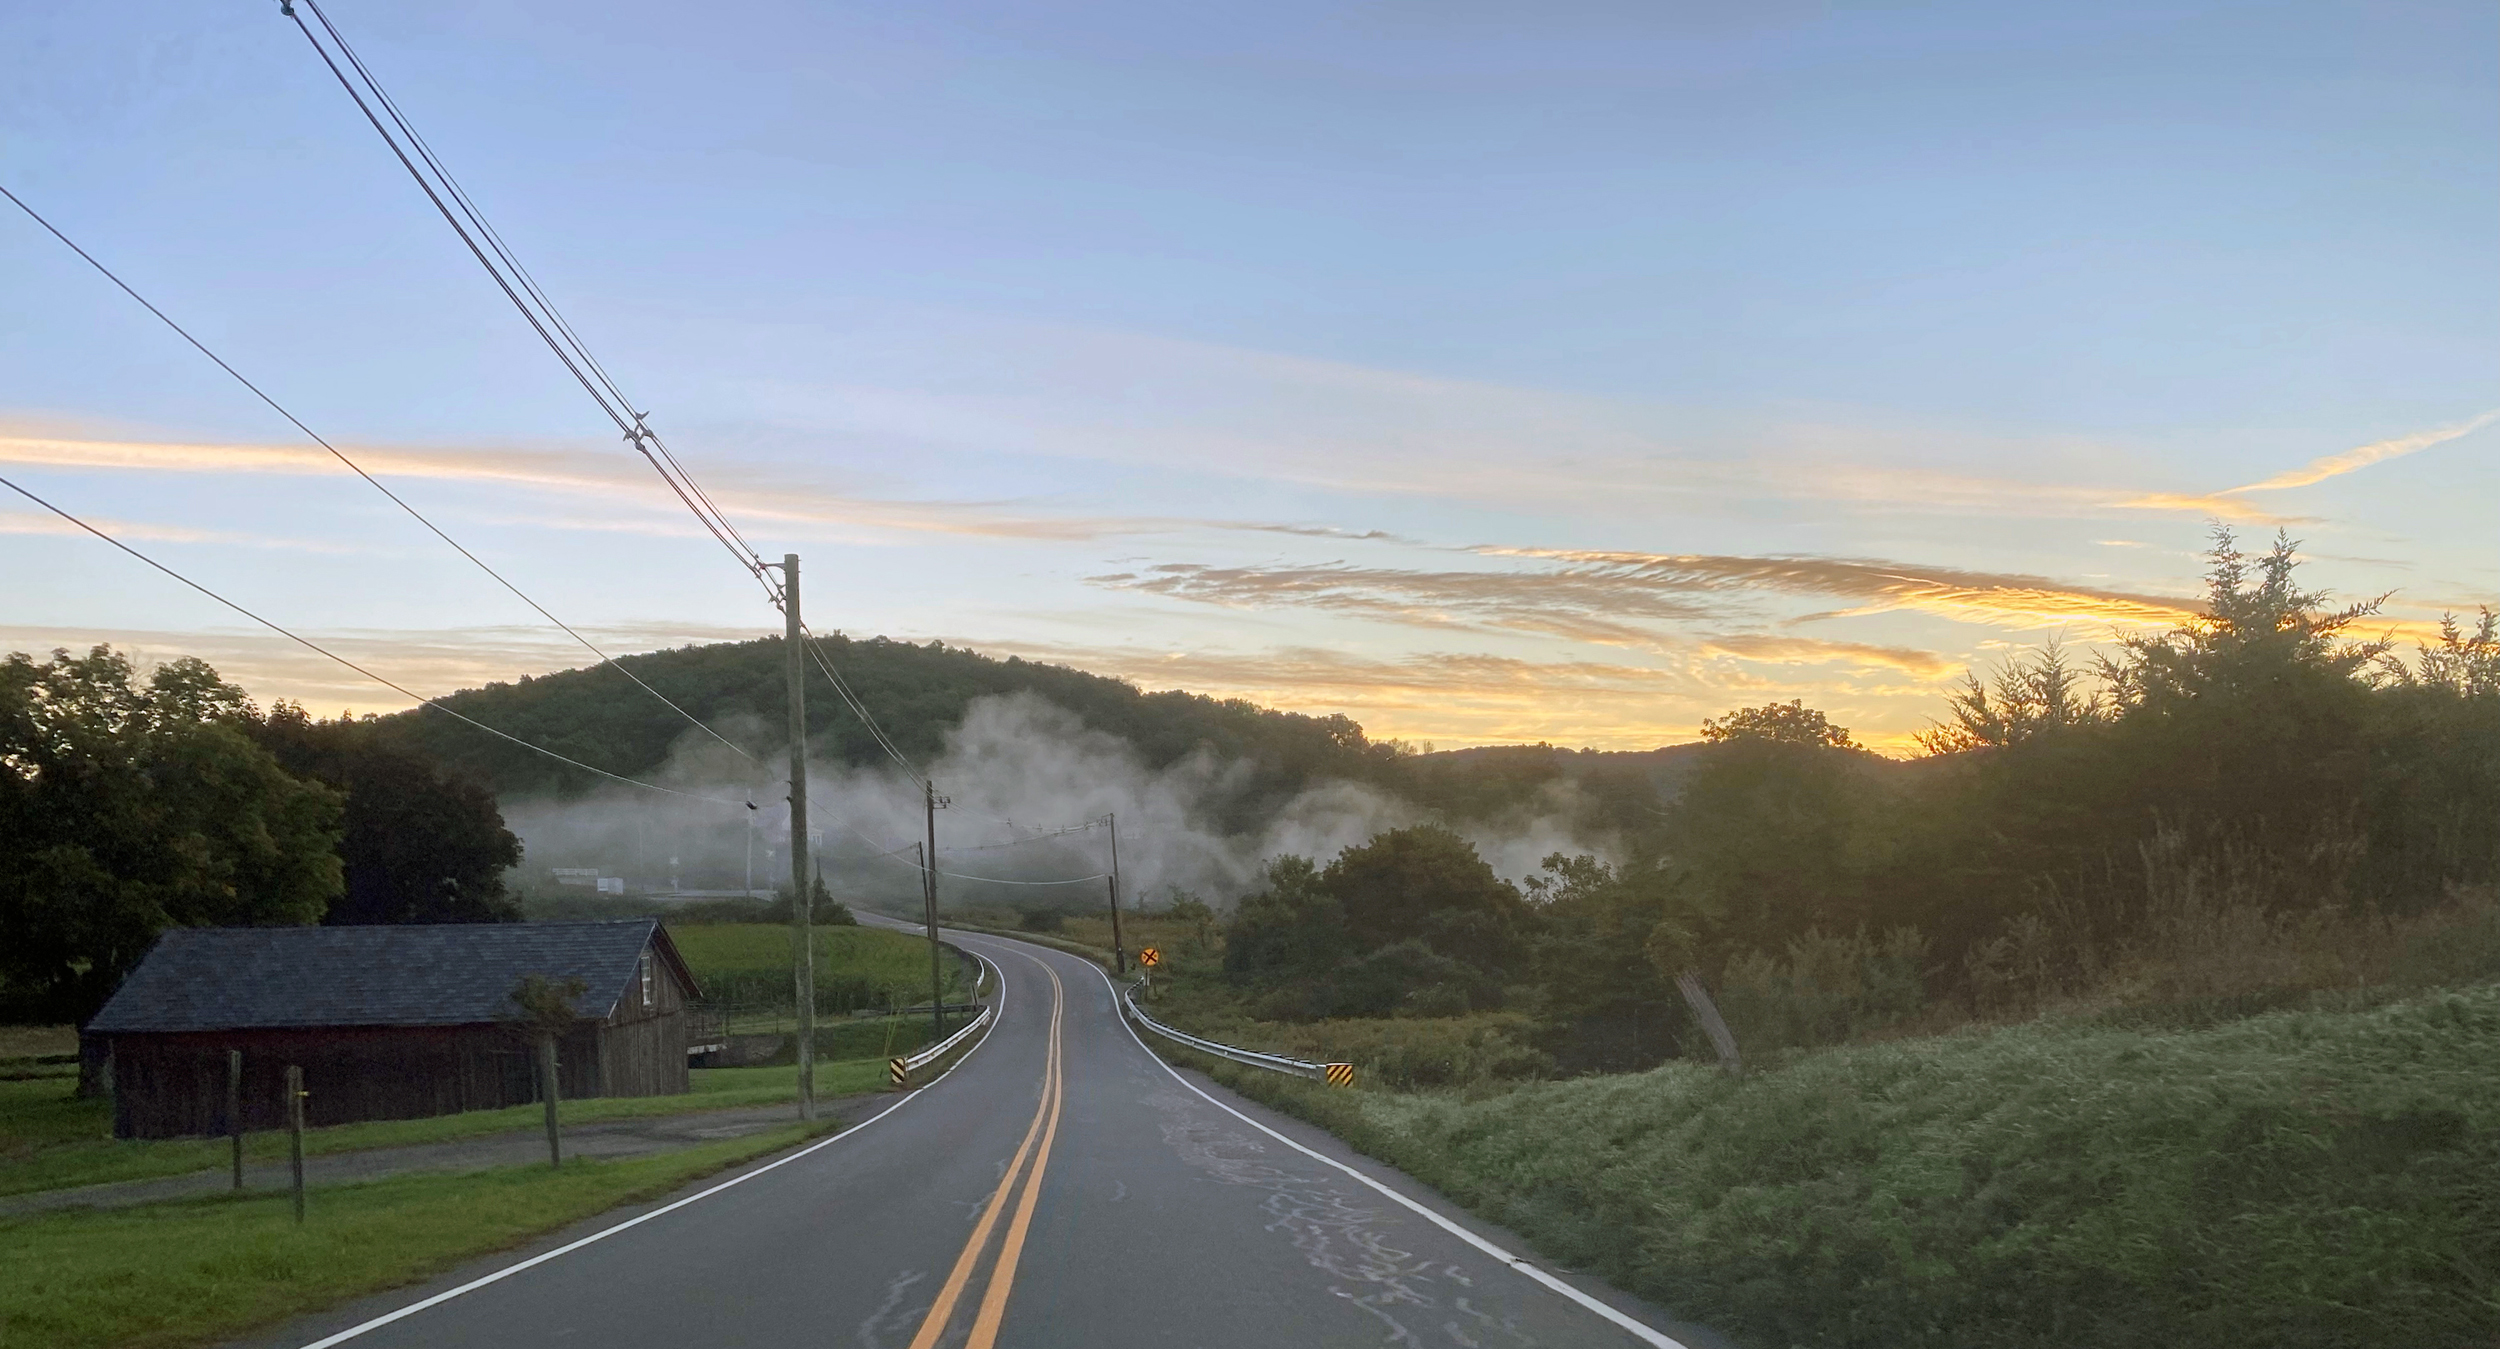
Low-lying radiation fog crossing the road in Sparta on the morning of September 24th.

Following a hot and dry summer, the questions of the day in September were when the temperature would begin to cool and would more abundant rainfall arrive. Signs of a rainfall resurgence were mixed, with drought conditions diminishing in spots but worsening in others. The temperature answer came in almost a flash on the 22nd (the first day of astronomical fall!) when a powerful cold front sent the thermometer quickly downward with an early-fall-like pattern arriving and remaining through month’s end.

September temperatures averaged 67.8° across NJ. This is 0.9° above the 1991–2020 normal and ties as the 22nd mildest September since statewide records commenced in 1895. The average high temperature was 78.2°, which is 1.0° above normal and tied for 23rd warmest. The average low was 57.3°, 0.7° above normal and ranking 23rd warmest. North Jersey came in at 65.7° (+0.8°, tied for 23rd warmest), the south 69.0° (+0.9°, tied for 21st warmest), and the coast 69.7° (+1.0°, 15th warmest).

NJ precipitation averaged 3.16” for September, which is 1.00” below normal and ranks as the 57th driest of the last 128 years. The north was wettest at 3.64”. This is 0.82” below normal, though ranks as just the 67th driest. The south came in with 2.86” (-1.13”, 51st driest) and the coast 2.98” (-0.91”, 57th driest).

It’s Been A While: November 2021; A Common Theme: Fall 2021 Recap

December 7, 2021 - 4:32pm -- Dave Robinson

The season’s first measurable snow at High Point on November 15th. Photo courtesy of N. Stefano.

November was the first month since May 2020 with both averages of precipitation and temperature below 1991–2020 normals. The last drier-than-normal month was this past June while the last cooler-than-normal month was this past May. However, it’s been a while, 19 months, since the two anomalies teamed up. And dry it was, with the statewide average of 1.06” running 2.29” below normal. This ranks as the 7th driest November since records commenced in 1895. Only two other Novembers since 1936 fall in the top 10.

The statewide average November temperature of 43.9° was 1.2° below the 1991–2020 normal and ranked as the 73rd coolest of the past 127 years. This was 17.2° cooler than the mild average of this past October. The normal difference between the months is 10.2°. The average maximum was 54.5° (-0.2°, 84th coolest) and the average minimum was 33.2° (-2.3°, 47th coolest). The north averaged 41.9° (-1.2°, 74th coolest), the south 44.9° (-1.4°, 68th coolest), and the coast 46.0° (-1.3°, 70th coolest). The first Rutgers NJWxNet or NWS Cooperative station to reach the freezing point this season was Pequest (Warren County), late on the 2nd. This was the latest first freeze in NJ since at least 1900 (based on Coop records). The last location to reach freezing was West Cape May (Cape May) on the 28th, on the late side but not unusually so.

A Slow Crawl into Fall: October 2021 Recap

November 8, 2021 - 5:43pm -- Dave Robinson

Colorful foliage surrounding Lake Hopatcong (Sussex County) on October 31st, bringing a tranquil close to a turbulent end of October. Photo courtesy of Kelly Wallis.

October was the second mildest on record in the Garden State since records commenced in 1895. This follows on the heels of the 11th warmest September, leaving most residents wondering when cool weather would arrive and leaves would turn and fall. For the first time since at least 1900, not a single weather observing station in New Jersey recorded a freezing low temperature on any day in either September or, as is climatologically most common, October. All of this resulted in a leaf season that was delayed by one to two weeks.

The statewide average October temperature of 61.1° was 5.7° above the 1991–2020 normal, a mark only surpassed in 2007. The average daily maximum of 70.1° (+4.3°) ranked 5th mildest (tied with 1920), and the average minimum of 52.0° (+7.1°) tied with 2007 as the mildest. These temperatures are close to what Norfolk, Virginia, normally experiences in October. In fact, despite the mean temperature normally declining 11.5° from September to October, this year’s mean was warmer than four previous Septembers since 1895 and the minimum was milder than 14 earlier Septembers. The state’s three climate divisions all ranked second mildest, with the north at 59.0° (+5.7°), south 62.3° (+5.8°), and coastal 63.2° (+5.6°).

Unprecedented: September 2021 Recap

October 11, 2021 - 4:38pm -- Dave Robinson

A flooded TD Bank Ballpark in Bridgewater (Somerset County) on September 2nd following the staggering rainfall caused by the remnants of Ida. Photo by Thomas P. Costello and Tariq Zehawi/USA Today Network.

Post-tropical storm Ida. The title of this month’s report speaks to this momentous weather extreme that will forever be the defining event of this month and likely the entire year. The storm delivered the most powerful tornado to strike the Garden State since 1990, demolishing multiple homes in Gloucester County. Rainfall exceeding 3.00” per hour led to the most widespread flash flood event on record for the state, resulting in the tragic deaths of 30 individuals in central and northeastern locales. A separate report on Ida has been prepared and may be accessed in the "News" menu.

There were 29 other days of weather this month that fortunately were not as dramatic as Ida on the 1st. All told, monthly precipitation averaged 6.20” across NJ. This was 2.04” above the 1991–2020 normal and ranks as the 15th wettest September since 1895. The north, where the bulk of Ida’s rain fell, averaged 8.92”, which was 4.46” above normal and ranks 7th wettest. The south averaged 4.61”, which was 0.62” above normal and ties as the 31st wettest. Along the coast, only 3.81” fell, some 0.08” below normal and ranking 44th wettest.

Up and Down But in the End Quite Average: September 2020 Recap

October 6, 2020 - 1:08pm -- Dave Robinson

Smokey sunset on September 15th

September 2020 was a month of widely-varying temperatures, several episodes of heavy precipitation, and an extended dry spell. Put it all together and conditions averaged quite close to normal. The statewide monthly average temperature of 66.8° was 1.0° above the 1981–2010 mean. While it was the seventh month of 2020 to average above normal, it was the first of these not to rank in the top 10 for warmth. Rather, it ranked 33rd warmest of the past 126 Septembers. Divisional departures from normal ranged from +0.7° in the north to +1.5° along the coast. The statewide average maximum temperature was 76.6°, which is 0.3° above normal and ranks 47th warmest. The average minimum of 56.9° was 1.6° on the warm side and ranked 24th mildest. High temperatures were likely reduced by several degrees during a mid-month period when a veil of smoke from western US forest fires blanketed the sky at an altitude of about 15,000 feet when skies otherwise would have been blue, especially on the 15th–16th. It is uncertain if this kept minimum temperatures somewhat warmer than they would otherwise have been. A cold front moved through from the northwest on the 18th, clearing the skies and sending temperatures plummeting. What followed was a four-day spell of temperatures that were well below average, including four nights with below-freezing temperatures at three to four Rutgers NJ Weather Network sites. While freezes resulting from cold air draining into valleys in some northern locations are not unprecedented before the end of astronomical summer, it is highly unusual for the cold to persist over four consecutive nights.

Cold and Dry (A Rarity of Late), and Quite the Transition Season: November and Fall 2019 Recaps

December 5, 2019 - 5:28pm -- Dave Robinson

Leaf bags

In what has been a monthly see-saw of an autumn in the precipitation department (more below), November totals were on the low side. The statewide average total of 1.83” was 1.78” below the 1981–2010 mean. This ranked as the 22nd driest November since 1895. The northern half of the state averaged 2.31”, which is 1.55” below normal and ranks 31st driest. The south was drier at 1.54”, which is 1.91” below normal and ties with 1991 as the 18th driest. Temperature-wise it was the coldest month compared to normal since last November and, along with March, only the second below average one since then. The statewide average temperature of 41.3° was 3.9° below normal and ranks as the 27th coldest (tied with 1920 and 1955) of the past 125 Novembers. The north average 38.9°, which is 4.2° below normal and ties with six other years as the 24th coolest. The south averaged 42.6°, which is 3.8° below normal and ties with 1954 and 1972 as 27th coolest. Of late, there have been warmer and drier months compared to the norm, such as this past September and colder and wetter months including this past March. However, the last time New Jersey experienced a noteworthy dry and cold month (of any month) was November 2012 when the statewide average temperature was 3.7° below average and the precipitation 2.31” below average.

So Much for a Flash Drought: October 2019 Recap

November 6, 2019 - 2:33pm -- Dave Robinson

As the 10th month of 2019 commenced, attention was on the continuing flash drought conditions across the Garden State. Lawns had gone brown and shallow rooted trees were losing their dull-colored leaves early. By the second week of the month, the US Drought Monitor showed all of NJ to be in either abnormally dry (D0) or moderate drought (D1) status (full disclosure: my recommendations are taken under consideration by the national author of each week’s map). Several rain episodes in the first half of the month, particularly in the north, began to stall any worsening of conditions. However, it wasn’t until the last half that five events deposited an inch or more, three of them with two inches or more, at a number of locations around the state. Thus by month’s end, only portions of southwest, southeast, and central NJ were rated D0, and the remainder, as we like to say, in “D nada.” This turn to storminess didn’t come without consequences. This included localized flash and small stream flooding on occasion, several episodes of strong winds, and some minor to moderate coastal flooding. More on all of this below, but first to further summarize the month. In the precipitation department, the statewide average was 5.79”. This is 1.90” above the 1981–2010 normal and ranks as the 15th wettest dating back to 1895. North Jersey came in with an average of 6.72”, some 2.41” above normal and ranking 10th wettest. In the south, the 5.28” average was 1.65” above normal and ranks as the 20th wettest.

As if the wet month was not newsworthy enough, the statewide monthly temperature of 58.0° tied with two other years as the 9th warmest back to 1895. This is 3.5° above normal, with northern and southern portions coming in at 3.2° and 3.8° above, respectively. The 2nd was arguably the hottest October day on record, thus also the warmest for so late in the season. Meanwhile, several locations experienced the first freeze of the season on the 4th or 5th, with a more widespread frost and freeze on the 19th. Still, the month ended with only 18 of the 63 NJWxNet stations having fallen to the freezing mark.

Winter Arrives Early, Record Wet Fall: November 2018 and Fall 2018 Recaps

December 5, 2018 - 5:11pm -- Dave Robinson

Snow-covered highway

November weather packed quite a punch, putting an exclamation point on what will go into the book as the wettest Fall (September–November) on record (since 1895). With seven storms that each deposited an inch or more of rain (or melted snow) at numerous locations, this was the second wettest November. The statewide average of 8.77” was 5.16” above the 1981–2010 average. The record will remain 9.01” in 1972.

One of the largest early-season snowstorms on record delivered significant impacts to all but southeastern NJ on the 15th. This event alone resulted one of the snowiest Novembers on record. Statewide, the monthly snowfall was 4.1”, which is 3.3” above average and ranks as the 6th snowiest since 1895 and the snowiest since 1989. With 7.4” in the north (Sussex, Passaic, Bergen, Warren, Morris, Essex, and Hudson counties), it was the snowiest November since 1938 and 3rd most on record. Central NJ (Hunterdon, Somerset, Union, Middlesex, Mercer, and Monmouth counties) received 4.8” (+3.9”), the 5th snowiest on record and most since 2012. The south (Burlington, Ocean, Camden, Gloucester, Atlantic, Salem, Cumberland, and Cape May counties) averaged 2.0” (+1.4”), the 10th snowiest and most since 2012.

Pages

Subscribe to RSS - Fall