August Overview
It is not as if August 2023 was devoid of strong thunderstorms that produced locally heavy rain and three minor tornadoes. There were also some hot and humid days and even a few days with smoke high aloft, a rather persistent feature of this summer’s weather (more on this in earlier June and July recaps and the summer summary later in this report). However, with temperatures a bit below normal and statewide rainfall leaning that way too, it just was not a particularly notable August in the weather/climate department. Mind you, most folks hardly complained of 90° maximum temperatures being rather scarce, there being no soaking tropical system, and, for the most part, fine weather for outdoor activities.
Statewide, the average temperature of 72.9° was 0.7° below the 1991–2020 normal. This ranked as the 48th warmest August of the past 129, but the coolest since 2017. Three of the past four months have been below normal, something not accomplished since January, March, and April 2018. The average high of 82.4° was 1.4° below normal, ranking 60th warmest. The low of 63.4° was 0.1° above normal, raking 31st warmest. The northern climate division averaged 70.7° (-1.2°, 53rd warmest), the southern division 74.2° (-0.4°, 46th warmest), and coastal division 74.5° (-0.2°, 38th warmest).
Precipitation averaged 4.03” across NJ, which is 0.54” below normal and ranks as 61st driest (68th wettest) since 1895. There was a north/south difference in rainfall (Figure 1), with the north averaging 5.02” (+0.46”, 41st wettest/89th driest), the south 3.45” (-1.12”, 49th driest/81st wettest), and coastal NJ 3.14” (-1.46”, 42nd driest/88th wettest).
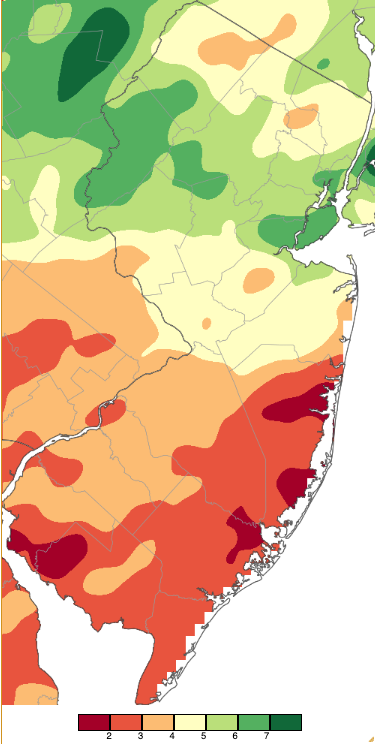
Figure 1. August 2023 precipitation across New Jersey based on a PRISM (Oregon State University) analysis generated using NWS Cooperative, CoCoRaHS, NJWxNet, and other professional weather station observations from approximately 8 AM on July 31st to 8 AM on August 31st. Note the scale in inches at the bottom of the map. Totals range from 1.00”–1.99” (dark red) to 7.00”–7.99” (dark green).
Precipitation and Storms
The north/south disparity in August precipitation was clearly evident in the distribution of NJ Community Collaborative Rain, Hail, and Snow Network (CoCoRaHS) and Rutgers NJ Weather Network (NJWxNet) monthly precipitation extremes. Monthly maximum totals were led by Edison (Middlesex County) with 7.79”, followed by Newton (Sussex) 7.72”, White Township (Warren) and Frelinghuysen Township (Warren) both 7.15”, Oxford (Warren) 7.01”, and Woodbridge (Middlesex) 7.00”. In the south, the lowest total was 1.73” in Egg Harbor Township (Ocean) followed by Ventnor City (Atlantic) 1.75”, Stafford Township (Ocean) 1.81”, Barnegat Light (Ocean) 1.91”, two Galloway Township (Atlantic) stations at 1.92”, Pine Beach (Ocean) 1.93”, and Lower Township (Cape May) 2.03”.
There were 11 episodes that deposited an inch or more rain at stations somewhere in the state. None involved widespread coverage of inch plus rains. The first event occurred early on the 7th, lasting until mid-morning along the coast. A small area in the northeast received the most, with two Glen Rock (Bergen) stations catching 1.63” and 1.43”, Wayne (Passaic) 1.39”, and Montvale (Bergen) 1.38”. Only a dozen other stations saw more than an inch with 173 of the 267 reporting CoCoRaHS stations receiving 0.50”–0.99”. During the early evening of the 7th, a squall line moved into the state. It dropped an EF-0 tornado in Holland Township (Hunterdon) that was on the ground for 0.52 miles with a maximum width of 150 yards and winds estimated to be up to 85 mph. A few farm outbuildings and trees were damaged, and no injuries were reported (Figure 2). Also, a 54-mph wind gust occurred in Lower Alloways Creek Township (LACT; Salem), with Moorestown (Burlington) up to 52 mph, East Brunswick (Middlesex) 49 mph, and four other NJWxNet locations from 40–45 mph. Tree and wire damage was reported in Gloucester, Burlington, Mercer, and Hunterdon counties. Rainfall was heaviest in the interior south, amounting to 1.73” in Buena Vista (Atlantic), Hamilton (Atlantic) 1.71”, Franklin Township (Gloucester) 1.69”, and Winslow Township (Camden) 1.51”. 24 stations received over an inch and 68 from 0.50”–0.99”. Figure 3 shows the combined total for the two intervals of rain on the 7th, which exceeded an inch in the interior south and parts of north Jersey.
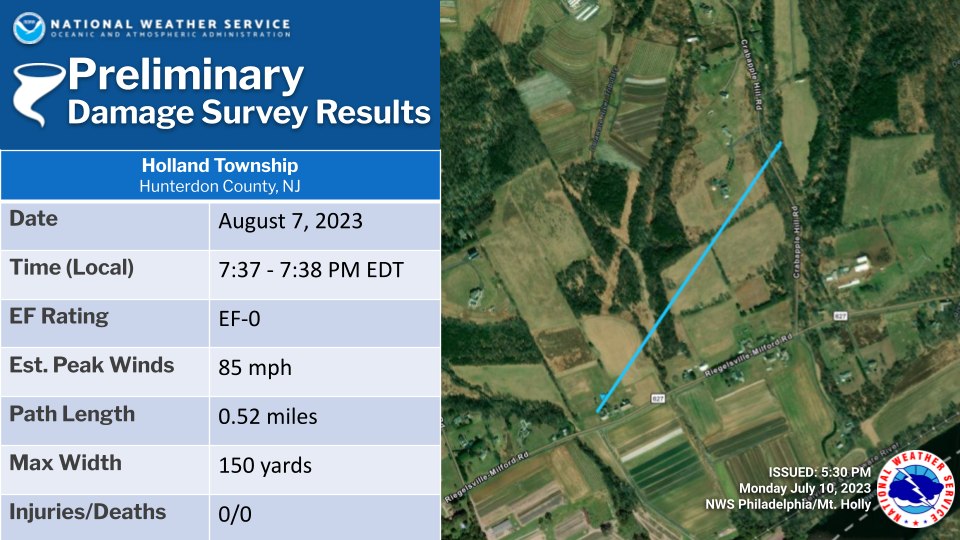
Figure 2. Information regarding the August 7th EF-0 tornado in Holland Township (courtesy of the National Weather Service).
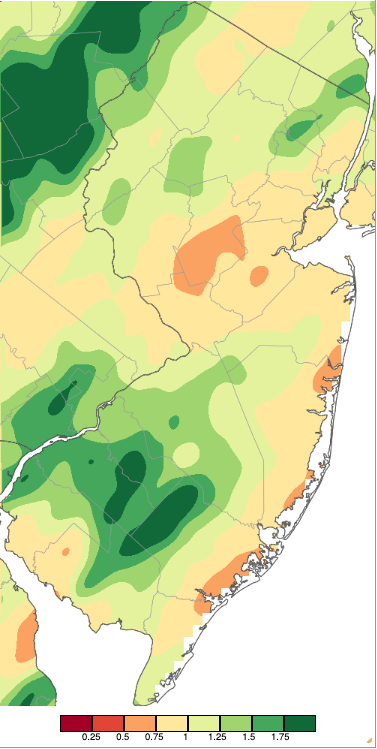
Figure 3. Precipitation across New Jersey from 8 AM on August 6th through 8 AM August 8th (combination of two episodes) based on a PRISM (Oregon State University) analysis generated using NWS Cooperative, CoCoRaHS, NJWxNet, and other professional weather station observations.
Next up was a round of heavy thunderstorms from the afternoon into the evening of the 10th. Two EF-1 tornadoes were confirmed, one in East Greenwich (Gloucester), the other in Pemberton (Burlington; Figure 4). The former had winds estimated to be up to 95 mph along its 0.66-mile 70-yard-wide path. The latter had winds estimated to be up to 90 mph along its 0.31-mile 100-yard path. Mostly tree damage and no injuries were reported from either twister. This brought the 2023 tornado count to 13, tying with 2021 for the second most annual tornadoes since 1950. The record is 17 in 1989. Tree and wire damage was reported in Gloucester, Burlington, Camden, and Monmouth counties.
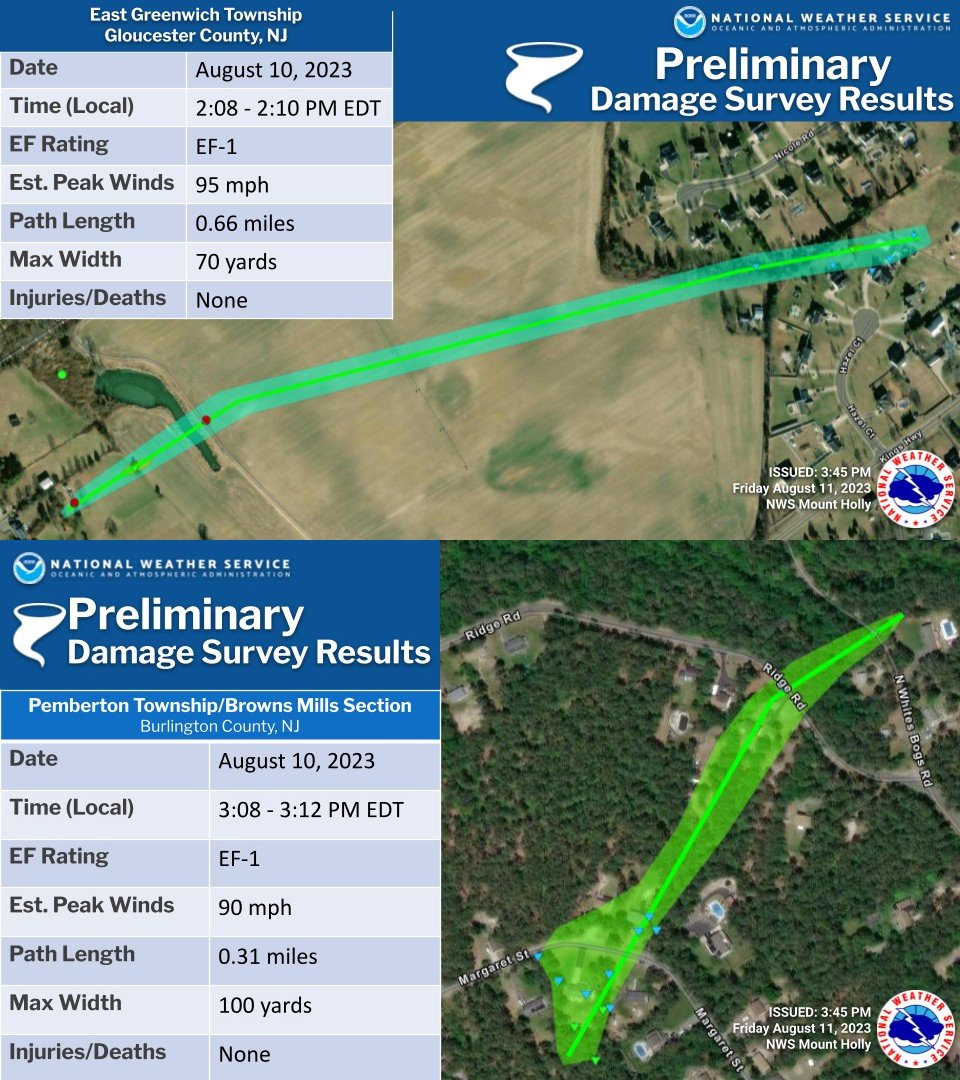
Figure 4. Information regarding the August 10th EF-1 tornadoes in East Greenwich Township and Pemberton Township (courtesy of the National Weather Service).
Rainfall from the storms on the 10th was as much as 2.34” in Mount Laurel (Burlington), followed by Moorestown 2.29” and 2.21” (two stations), Hainesport (Burlington) 2.24”, Jackson (Ocean) 2.12” and 2.00” (two stations), and Columbus (Burlington) 2.00”. Of the 267 CoCoRaHS reports, 33 stations received 1.00”–1.99” and 124 caught 0.50”–0.99” (Figure 5).
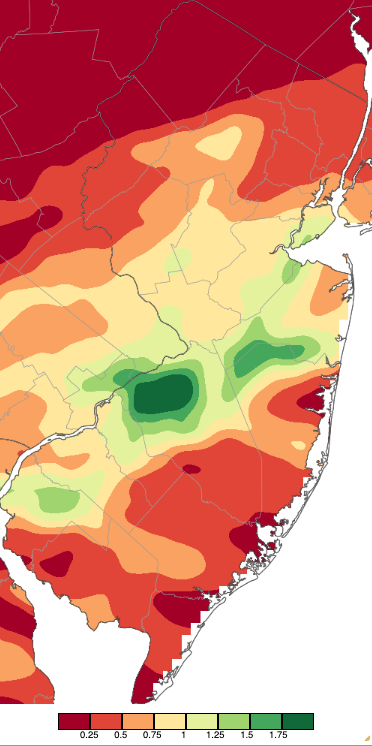
Figure 5. Precipitation across New Jersey from 8 AM on August 10th through 8 AM August 11th based on a PRISM (Oregon State University) analysis generated using NWS Cooperative, CoCoRaHS, NJWxNet, and other professional weather station observations.
While the inch of rainfall criterion was not reached on the 12th, an isolated thunderstorm delivered a 51-mph gust and 0.79” of rain to the Vernon Township (Sussex) NJWxNet station. Wind damage was reported in Camden, Hunterdon, Somerset, and Middlesex counties, including trees onto a car and home. The 7th and 10th were the only days of August with stations observing 40 mph or greater gusts, not to dismiss the stronger winds in the three localized tornadoes on those days.
Several thunderstorms struck central and northeastern locations early on the 13th. Heavy rain totals included Springfield (Union) 1.38”, New Providence (Union) 1.35”, Maplewood (Essex) 1.16”, Warren (Somerset) 1.06”, and Harrison (Hudson) 1.02”. As a storm struck Pittstown (Hunterdon), along with an immediate drop in temperature and dew point, strong wind gusts occurred, and perhaps of greatest interest to a weather watcher, the barometric pressure quickly rose about 0.07”, only to fall just as quickly by close to 0.10” (Figure 6).
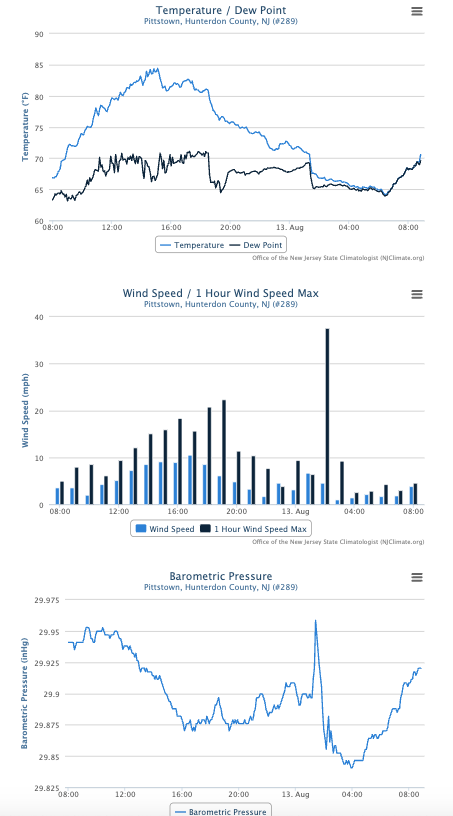
Figure 6. Timelines of temperature and dew point (top), instantaneous and maximum wind speeds (middle), and barometric pressure (bottom) at the Pittstown (Rutgers Snyder Farm) NJWxNet station from a storm occurring around 1:30 AM on August 13th.
Much like during this past July, northwest NJ was hit hardest from storms, including during the predawn hours of the 15th (Figure 7). Pequest (Warren) received 2.31”, Oxford 2.25”, Vernon Township 2.15”, Liberty Township (Warren) 2.12”, White Township 2.08”, Newton 2.03”, and Andover Township (Sussex) 2.00”. Of the 270 CoCoRaHS stations, 42 caught from 1.00”–1.99” and 53 from 0.50”–0.99”. Several stations in Burlington and Camden counties saw no measurable rainfall.
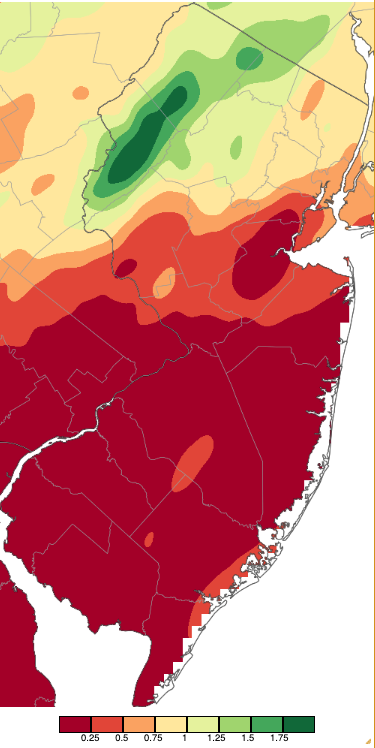
Figure 7. Precipitation across New Jersey from 8 AM on August 14th through 8 AM August 15th based on a PRISM (Oregon State University) analysis generated using NWS Cooperative, CoCoRaHS, NJWxNet, and other professional weather station observations.
Predawn storms on the 16th took two paths across NJ, one between Interstates 78 and 80, the other between Interstate 195 and Route 1 (Figure 8). Top totals included 2.33” in Millstone (Monmouth), Madison (Morris) 2.24”, Manalapan (Monmouth) 2.00”, 27 stations from 1.00”–1.99”, and 99 sites from 0.50”–0.99”. A few portions of Camden and Gloucester counties did not receive measurable rainfall.
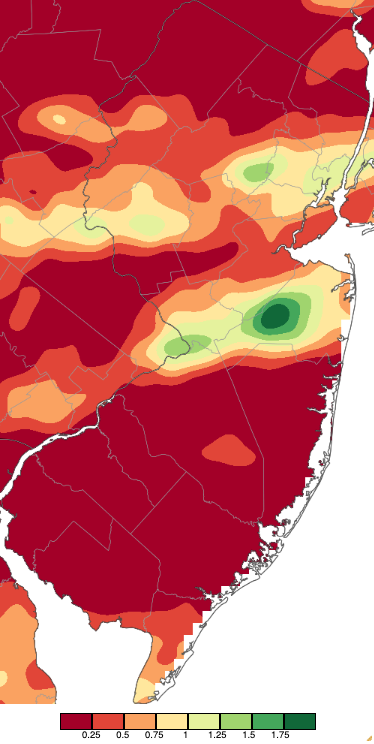
Figure 8. Precipitation across New Jersey from 8 AM on August 15th through 8 AM August 17th based on a PRISM (Oregon State University) analysis generated using NWS Cooperative, CoCoRaHS, NJWxNet, and other professional weather station observations.
Scattered afternoon and evening showers on the 17th and predawn thunderstorms on the 18th brought inch-plus rain to the central and northeast Route 1 corridor. East Windsor (Mercer) saw 1.62”, Kearny (Hudson) 1.57”, and Palisades Park (Bergen) 1.22”. Forty CoCoRaHS stations received 0.50”–1.21”.
Subsequent days were warm and dry, leading to a wildfire in the Pinelands from the 20th to 22nd. The fire, located in Wharton State Forest, burned approximately 1,700 acres in portions of Waterford (Camden), Medford (Burlington), and Shamong (Burlington), closing some roads but not damaging any structures.
Light rain fell from the afternoon into the evening of the 24th. This included an isolated area of convection along and off the central Monmouth County coast where a watersport was observed. Overnight into the 25th, thunderstorms moved into northwest counties and traveled to the southeast into Middlesex County. Rain was over in the northwest by CoCoRaHS observing time on the 25th where totals for the prior 24 hours were as large as 2.52” in Fredon Township (Sussex), Stillwater Township (Sussex) 2.03”, Blairstown (Warren) 1.93”, and 57 stations had from 1.00”–1.93”. Rain returned to west central NJ before sunrise on the 26th, moving eastward into the Raritan Bay area after some volunteers made their CoCoRaHS observations that morning. Totals for this event ran as high as 1.15” in Middletown (Monmouth), Cranford (Union) 1.14”, and Califon (Hunterdon) 1.12”. Due to the observation timing situations, these two events were mapped together in Figure 9, with combined totals as high as 3.23” in Edison, Metuchen (Middlesex) 2.83” and 2.47” (two stations), and Woodbridge 2.80” and 2.78” (two stations).
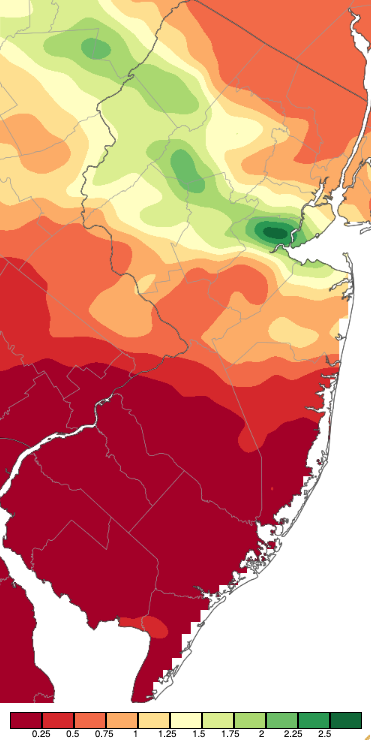
Figure 9. Precipitation across New Jersey from 8 AM on August 24th through 8 AM August 27th based on a PRISM (Oregon State University) analysis generated using NWS Cooperative, CoCoRaHS, NJWxNet, and other professional weather station observations. Notice that the scale extends beyond that of the events mapped in earlier figures.
The highest barometric pressures of the month were observed on the 2nd, falling between 30.20”–30.30”. The lowest pressures were on the 10th, ranging from 29.55”–29.65”.
Temperature
While temperatures leaned toward the cooler-than-normal side in August, there still were ten afternoons when one or more NJWxNet station made it to 90° or higher. Before looking at these, attention will first be given to the cool side of the ledger, since August began with the most prominent episode. Northwesterly winds behind a late July cold front not only brought a 50° morning to Walpack on the 1st, with Sandyston (Sussex) at 51° and seven other stations from 52°–55°, but they also reintroduced smoke from western Canada fires into southern NJ (Figure 10). As it has been on all but a few days this summer, the smoke was at high altitudes but was dense enough to reduce incoming solar radiation by about 10% compared to north Jersey (Figure 11).
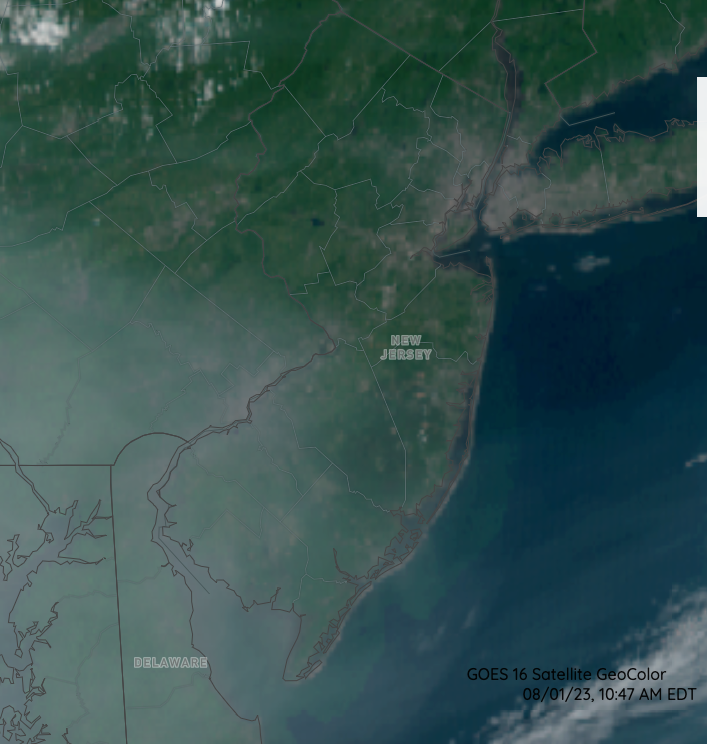
Figure 10. Visible satellite image at 10:47 AM on August 1st showing the high-altitude smoke veil over southern NJ and adjacent southeast PA, northeast MD, and north DE, Delaware Bay, and in the adjacent Atlantic (NOAA GOES image).
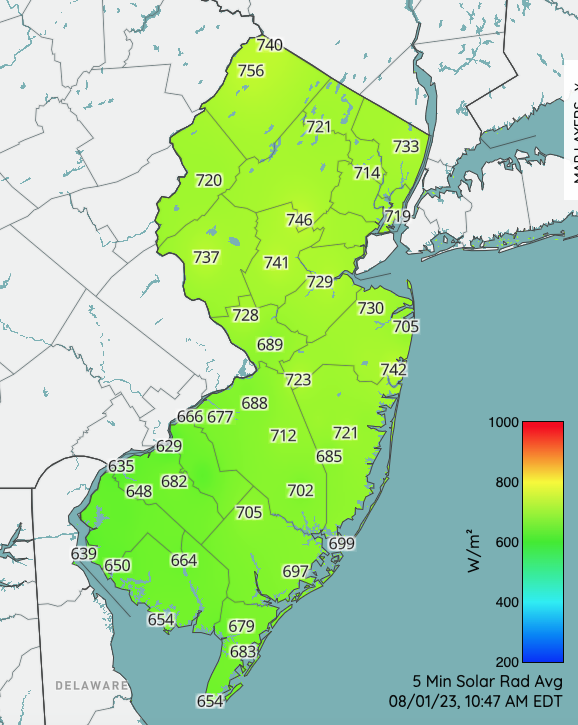
Figure 11. 5-minute average solar radiation at 10:45 AM on August 1st as observed at NJWxNet stations.
The coldest morning of August was on the 2nd with Walpack (Sussex) down to 44°, Sandyston 45°, and five stations from 46°–49° (Figure 12). There were also 22 stations from 50°–55°. Seaside Heights (Ocean) was mildest at 67°. The chill continued on the 3rd, with Walpack at 48°, Berkeley Township (Ocean) 49°, and 15 sites from 50°–55°.
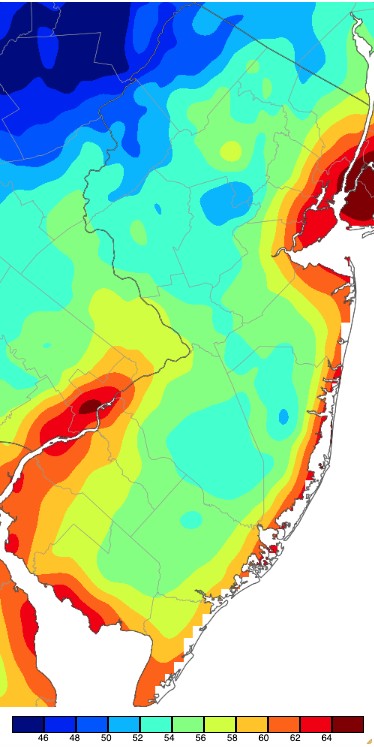
Figure 12. Minimum temperatures on August 2nd based on a PRISM (Oregon State University) analysis generated using NWS, NJWxNet, and other professional weather stations. Note the 2° scale beneath the map.
Sandyston fell to 55° on the 6th, however, another 55° or cooler morning did not appear again until Sandyston and Walpack each made it down to 53° on the 12th. Another cool period brought minimums of 53° at Walpack and 55° in Sandyston on the 18th, 49° at Walpack and 50°–55° at 21 stations on the 19th, and 48° to Sandyston, 49° at Walpack, and 50°–55° at 19 NJWxNet locales on the 20th. Fortescue (Cumberland) fell to just 73° on the 20th, indicative of the warm water in adjacent Delaware Bay. Walpack dropped to 52° and six sites from 53°–55° on the 22nd. Walpack reached 47°, 49° at Sandyston, and 27 stations 50°–55° on the 23rd.
The first 90° day of August was the 6th when five NJWxNet stations reached that mark. The 12th began a five-day period with 90°s somewhere in NJ. Piney Hollow (Gloucester) and Berkeley Township hit 90° on the 12th. It topped out at 91° at Atlantic City Marina (Atlantic), LACT, and Point Pleasant (Ocean) on the 13th, and 92° at Pennsauken (Camden) on the 14th, when 19 stations were either 90° or 91°. The 15th was one of three August days with a monthly maximum of 93°, that value reached at Cape May Court House (Cape May), Hammonton (Atlantic), and LACT, with 31 stations from 90°–92°. However, northwest Jersey failed to get into the heat on the 15th, with High Point Monument (Sussex) only reaching 66°, Vernon Township 68°, and High Point (Sussex) 69°. The Monument station had a daily range from 60°–66° while LACT ranged from 75°–93°. Piney Hollow got to 91° and LACT 90° on the 16th.
Next up was a 90° afternoon at Toms River (Ocean) on the 20th. Statewide, the hottest day of the month was the 21st. Highs reached 93° at LACT and Toms River, and 90°–92° at 25 NJWxNet stations (Figure 13). The northwest did not get fully in on the act, with High Point Monument only up to 79°, as a cooler, drier air mass began to invade the state during the daytime hours.
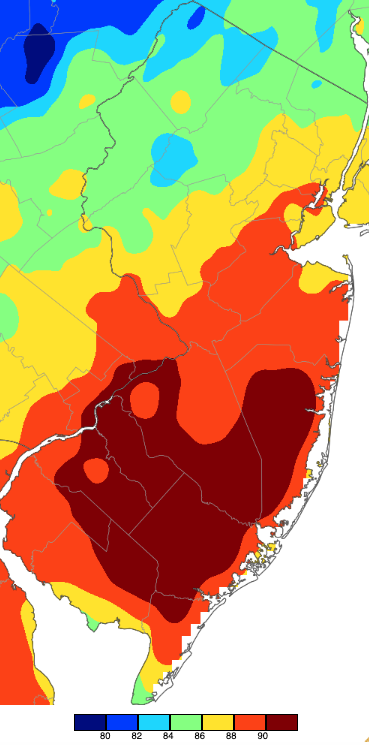
Figure 13. Maximum temperatures on August 21st based on a PRISM (Oregon State University) analysis generated using NWS, NJWxNet, and other professional weather stations.
Southwesterly winds ahead of the cool front generated a sea breeze in coastal areas as seen in Figure 14, where the temperature at Harvey Cedars (Ocean) on Long Beach Island peaked at 86° shortly after noon before quickly dropping to the upper 70°s. Sea-breeze-induced temperature changes are not nearly as pronounced in late summer as they are in spring and early summer, as ocean temperatures are about at their peak warmth. Still, some relief is produced for beach goers.
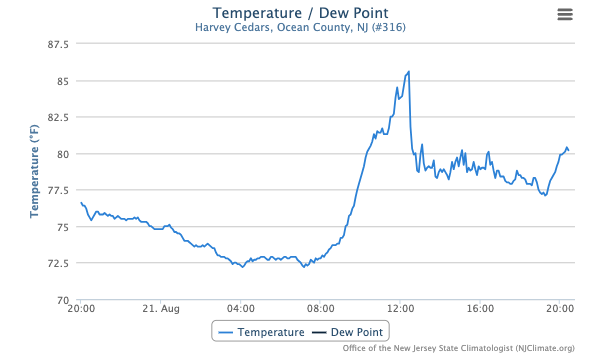
Figure 14. Timeline of temperatures at the Harvey Cedars NJWxNet station from 8:30 PM August 20th to 8:30 PM August 21st.
As the cooler, drier air reached central NJ during the early evening, the temperature began to fall at a steady pace as the dew point slowly declined. As seen at Hillsborough-Duke (Somerset), the dew point subsequently fell somewhat more quickly while the temperature rose several degrees. This was associated with an increase in wind speed. Shortly thereafter, both temperature and dew point declined until around sunrise on the 22nd when considerably drier air quickly brought the dew point down almost 10°, where it stayed in the mid 50°s during the morning while the air temperature only slowly climbed with the new air mass firmly in command.
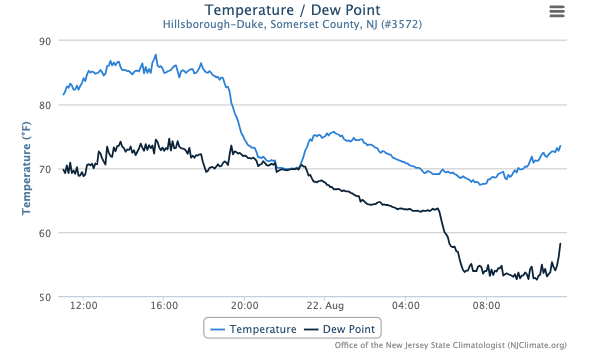
Figure 15. Timeline of temperature and dew point at the Hillsborough-Duke NJWxNet station from 11:50 AM August 21st to 11:50 AM August 22nd.
By the 25th, high temperatures were back above 90° at several locations, including 93° at LACT and 90° in Greenwich (Cumberland) and Piney Hollow. Five stations made it to 91° and three to 90° on the 26th. Hammonton, Piney Hollow, and LACT hit 90° on the 27th.
Summer 2023 Overview
The most unusual “feature” of what was otherwise a rather normal summer was the presence of smoky skies on multiple occasions, courtesy of a record-shattering wildfire season in Canada. Most often, the smoke was at high enough altitudes such that it produced milky white skies on cloud-free days, but it did not impact air quality or visibility at/near the surface. However, there were several occasions where smoke was low enough to impact air quality, thus creating a health concern. The situation was most pronounced on June 7th, a day most, especially in north and central NJ, will never forget. The air quality for a time was the worst in the world, visibility was below a mile, the smell of smoke was remarkable, and lighting was needed during mid-day hours.
More common of late have been warmer-than-normal summers. This was not the case in 2023, with the summer averaging 72.5°, 0.6° below the 1991–2020 normal and ranking as the 38th warmest of the past 129 years. Both June and August were below normal, outdoing the 12th warmest July on record. This was the coolest summer since 2014 and only one of three summers since 2010 coming in below normal. July 28th was the hottest summer day, with June 2nd, and July 5th, 13th, and 27th not far behind. Figure 16 depicts the hottest temperatures across the state at some point (not all occurring on one day) this summer. The hottest temperature of the summer at an NJWxNet station was 97° registered at Fort Dix (Burlington) and Wall (Monmouth) on July 27th and at Berkeley Township (Ocean) on the 28th. Summer lows are shown in Figure 17. The coolest summer morning was June 8th when nine NJWxNet stations dropped into the 30°s, including 33° at Walpack (Sussex).
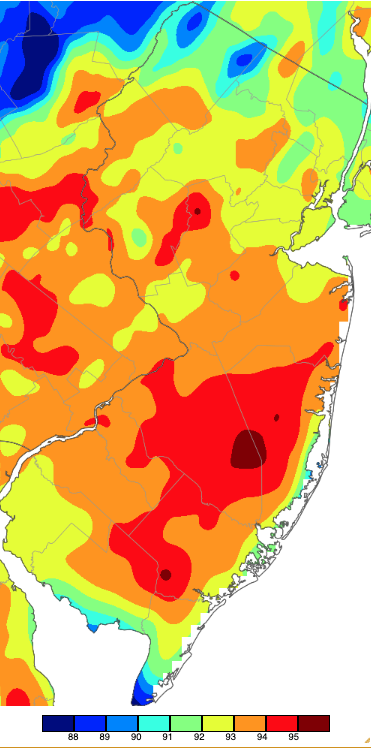
Figure 16. Extreme maximum temperatures during the summer of 2023 (June 1st–August 31st) based on a PRISM (Oregon State University) analysis generated using NWS, NJWxNet, and other professional weather stations. The seasonal maximum occurred on different days at different locations. Note the 1° scale beneath the map.
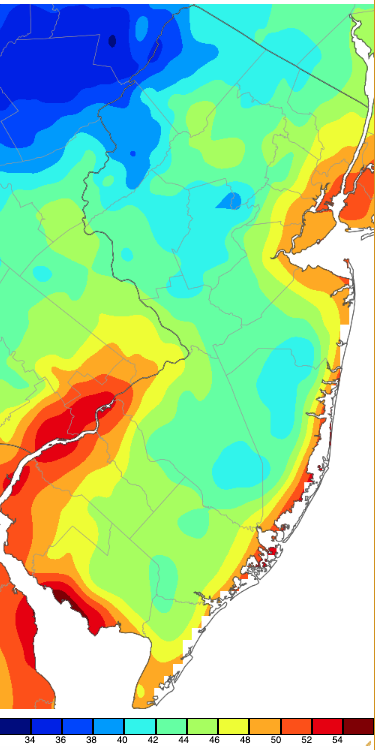
Figure 17. Extreme minimum temperatures during the summer of 2023 (June 1st–August 31st) based on a PRISM (Oregon State University) analysis generated using NWS, NJWxNet, and other professional weather stations. The seasonal maximum occurred on different days at different locations. Note the 2° scale beneath the map.
Summer precipitation averaged 14.16”, far more generous than last summer’s 4th driest 7.81”. This year’s average was 0.58” above the 1991–2020 normal and ranked as the 47th wettest. There was quite a disparity in rainfall across NJ, with the northwest wettest and southeast driest (Figure 18). Summer precipitation in the northern division totaled 17.28” (21st wettest, 3.39” above normal), compared to 12.36” (64th wettest/66th driest, -1.09”) in the south and 10.79” (45th driest, -2.04”) in the coastal division. Heavy July rains with resultant flooding and a notable landslide, along with some large totals in August, pushed the seasonal rainfall total to 32.48” in White Township (Warren). This was followed by Oxford (Warren) 30.84”, Newton (Sussex) 30.75”, Chester Township (Morris) 25.84”, Knowlton Township (Warren) 25.83”, and Andover Township (Sussex) 25.32”. Coastal areas with NJ’s lowest summer totals included Berkeley Township (Ocean) 8.29”, Pine Beach (Ocean) 8.47”, Barnegat Light (Ocean) 8.53”, Ventnor City (Atlantic) 8.69”, Brick (Ocean) 8.86”, and Sea Isle City (Cape May) 8.95”.
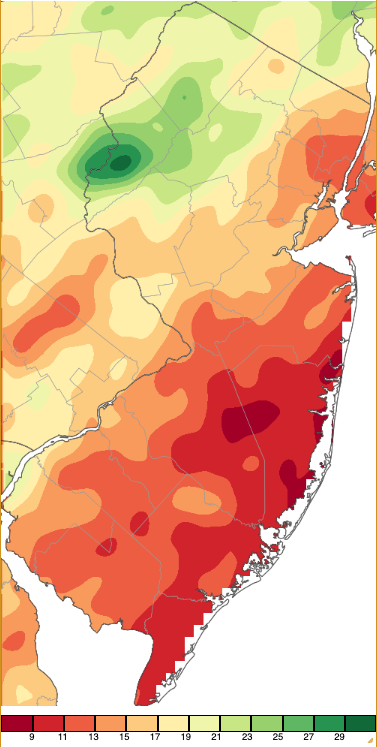
Figure 18. Summer precipitation across New Jersey from 8AM on May 31st through 8AM August 31st based on a PRISM (Oregon State University) analysis generated using generated using NWS Cooperative and CoCoRaHS observations. Note the scale in inches beneath the map.


