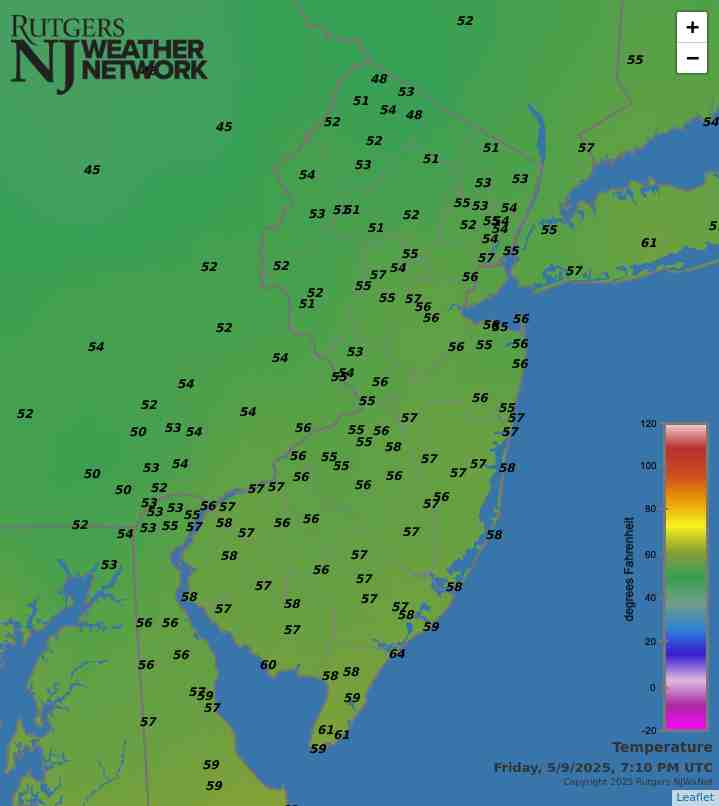
Latest Temperatures

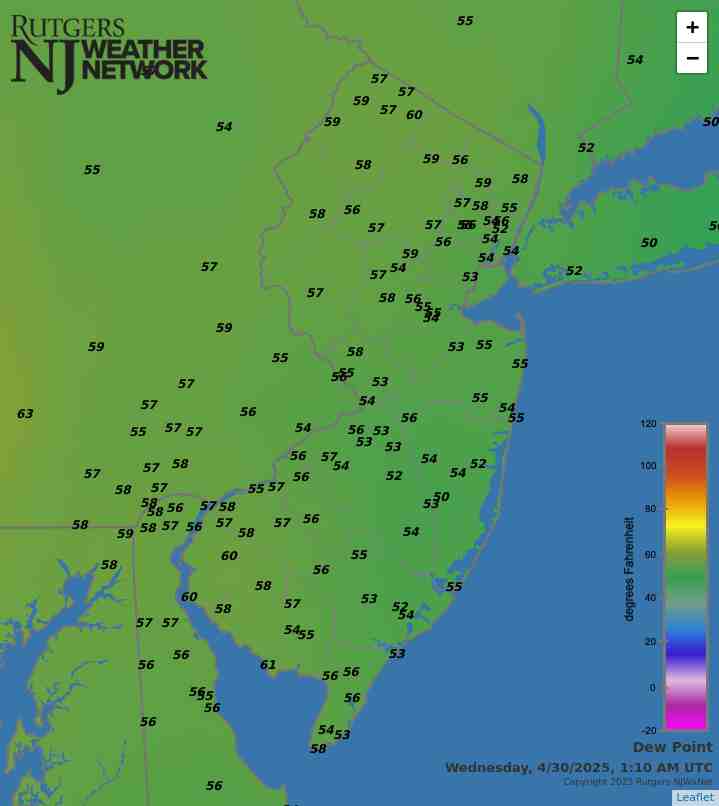
Current Dew Point

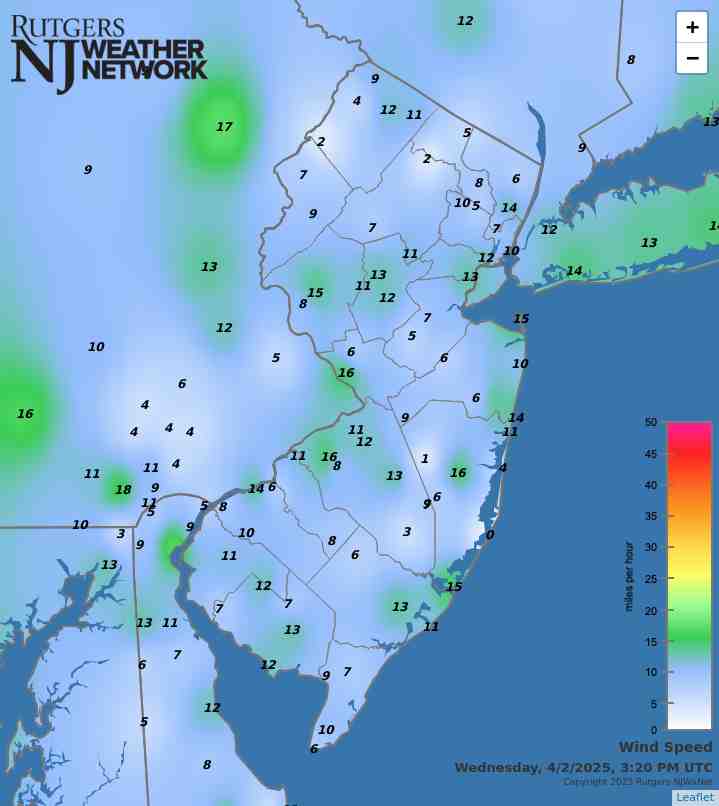
Latest Wind Speeds

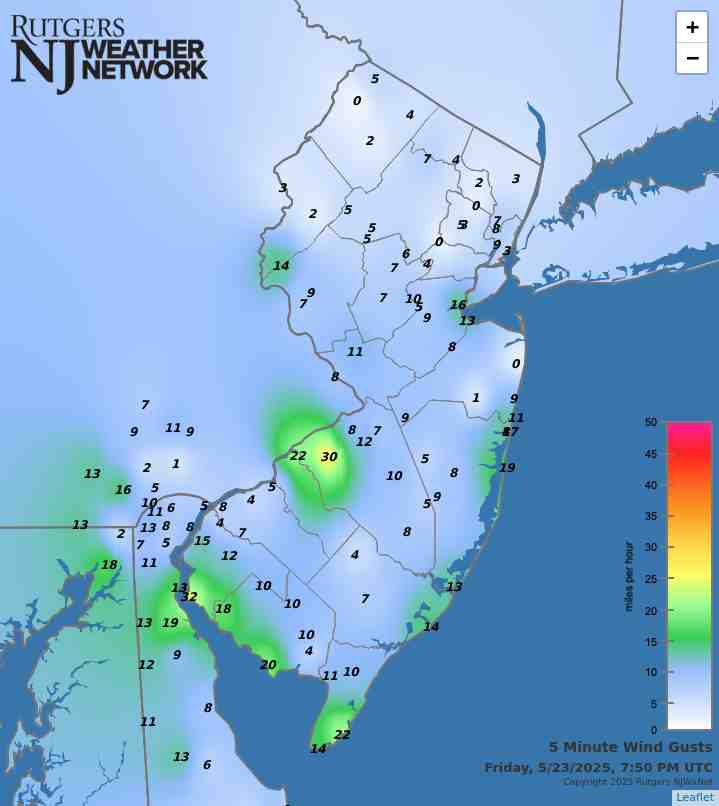
Wind Gusts

Top Story

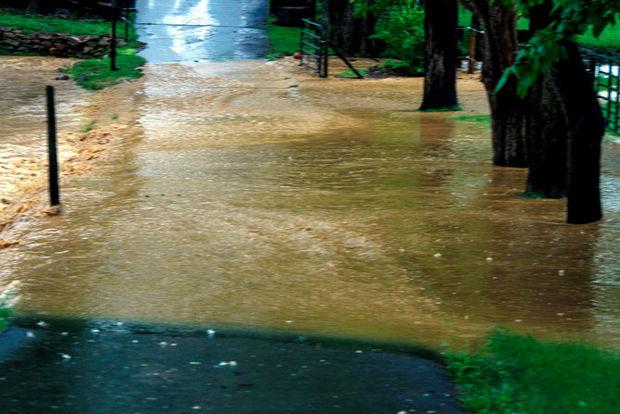
Debris and rubble in the aftermath of flash flooding that occurred on July 14th in North Plainfield (Somerset County).
Debris and rubble in the aftermath of flash flooding that occurred on July 14th in North Plainfield (Somerset County). Photo by Seth Wenig/AP Photo.

Tragically, this July demonstrated how weather danger lurks across the Garden State during summer months. July thunderstorm winds felled trees that resulted in three fatalities, lightning strikes killed two and injured others, and flash flooding took two lives and put countless others in perilous situations. No doubt, the often-relentless heat and humidity led to medical issues for those most vulnerable, be they old, young, infirmed, employed outdoors, or living in stifling locations devoid of air conditioning.

Temperature-wise, the July statewide average temperature of 78.1° was 2.7° above the 1991–2020 mean and ranked as the 6th warmest since records commenced in 1895. The average high of 87.7° was 2.0° above normal, ranking 12th warmest, while the average low of 68.5° was 3.4° above normal, ranking 3rd warmest. Eight of the ten warmest Julys have occurred since 2010 and twelve of fifteen since 1999. Only three Julys in the past 25 years have averaged below the 1991–2010 normal. The June–July average of 75.0° is the 5th warmest, only exceeded by 76.1° in 2010, 75.6° in 2024, and 75.2° in both 2020 and 2011.

The 5.44” statewide average July precipitation was 0.73” above normal, ranking 42nd wettest of the past 131 Julys. As is often seen during summer months, totals varied markedly over rather short distances, seen this month in both the north and south (Figure 1). Overall, the north averaged 4.62” (-0.10”, 64th wettest/68th driest), south 5.93” (+1.19”, 26th wettest), and coast 6.08” (+1.70”, 20th wettest).

Latest Extremes

City, State Temp
Atlantic City Marina, NJ 73
Harvey Cedars, NJ 72
Sea Girt, NJ 72
Seaside Heights, NJ 72
Egg Harbor Twp., NJ 71
City, State Temp
Wantage, NJ 60
High Point, NJ 61
Sandyston, NJ 61
Hackettstown, NJ 61
Basking Ridge, NJ 63
most current information as of Aug 7 2:35 AM

Latest Conditions & Forecast

New Brunswick, NJ

Rutgers University Meteorology Program

69°F

Wind

5 mph from the NE

Wind Gust

8 mph from the NE

Mostly Cloudy
66 °F
Mostly Sunny
82 °F
Mostly Clear
62 °F
Sunny
82 °F
Mostly Clear
60 °F
Sunny
86 °F
Mostly Clear
62 °F
Sunny
90 °F
Mostly Clear
67 °F
Sunny
92 °F
Mostly Clear
68 °F
Sunny
94 °F
Partly Cloudy
72 °F
Mostly Sunny then Chance Showers
93 °F

Overnight

Mostly cloudy, with a low around 66. East wind around 5 mph.

Thursday

Mostly sunny, with a high near 82. East wind 5 to 10 mph.

Thursday Night

Mostly clear, with a low around 62. East wind around 5 mph becoming calm in the evening.

Friday

Sunny, with a high near 82. East wind around 5 mph.

Friday Night

Mostly clear, with a low around 60. Southeast wind around 5 mph becoming calm in the evening.

Saturday

Sunny, with a high near 86.

Saturday Night

Mostly clear, with a low around 62.

Sunday

Sunny, with a high near 90.

Sunday Night

Mostly clear, with a low around 67.

Monday

Sunny, with a high near 92.

Monday Night

Mostly clear, with a low around 68.

Tuesday

Sunny, with a high near 94.

Tuesday Night

Partly cloudy, with a low around 72.

Wednesday

A chance of showers. Mostly sunny, with a high near 93. Chance of precipitation is 30%.

Search by zipcode or city/state for the latest conditions, forecasts, graphs, maps and more nearest to you.

More News

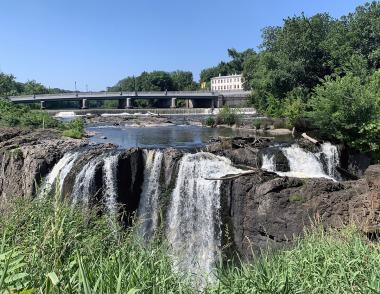
Photo of The Great Falls along the Passaic River in Paterson (Passaic County) on June 25th.

Looking back at the past month, or the first half of this year for that matter, “mysterious,” “puzzling,” or “difficult to understand” may best describe what has transpired when it comes to New Jersey’s weather and climate behavior. In other words, enigmas. More on the previous six months toward the end of this report. First a look at June, which followed a drought-busting (and hopefully not just interrupting) 7th wettest May, but resumed an only twice-broken string of months with below-normal precipitation back to May 2024 (August 2024 and May 2025). Then there were cool days that had some...

Photo of the Tour of Somerville bicycle race, held on the sunny and dry afternoon of May 26th.

It took a frustratingly long time for the cool season “recharge” of New Jersey’s water resources to get well underway. Following a record dry fall 2024, December through April precipitation remained below normal, including the third driest January of the past 131 years. However, February, March, and April precipitation totals were only a bit below normal, so while precipitation deficits were not recovering, they did not worsen, and reservoirs began to fill. Then along came May, with near record-high precipitation, just in time to bring most water resources up to normal heading into summer....

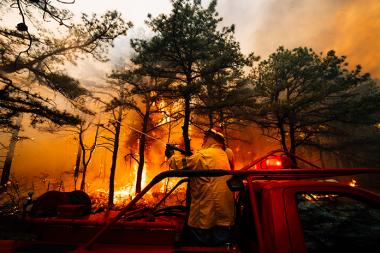
Firefighters battle the Jones Road Wildfire in Ocean County (photo courtesy of the New Jersey Department of Environmental Protection).

If it is weather variety you enjoy, April certainly must have proved rather satisfying. Atmospherically, this was expressed by a cool, wet first half of the month and a warm, dry second half. When all was totaled and averaged, the full month emerged with above-normal temperatures and close-to-normal precipitation. Toss in one northern snow event, considerable wind, lingering drought in some areas, and a major Pinelands wildfire, and there was quite a potpourri of conditions. Looking first at precipitation, the statewide average of rain and melted snowfall was 3.72”. This was 0.02” above...

More News

So this is how a normal July feels...
July 27, 2014 - 8:45pm -- Dave Robinson

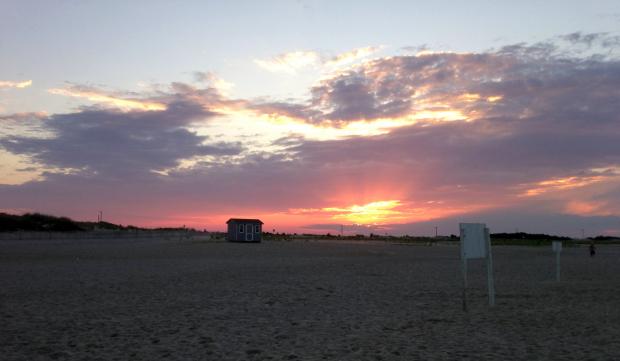
Beach sunset photo

Another comfortable mid-summer air mass is destined to invade the Garden State this week. This arrives on the heels of several other mild, dry air masses that have contributed to making this a rather average July in the temperature department. While many may think that this has been an exceptionally cool summer, it has not. However, given that the most recent four Julys all ranked within the top six for heat dating all the way back to 1895, all are forgiven for any misperception!

The overall pattern that has led to temperatures more often being on the cool than than warm side of the ledger since last fall is one of pronounced waviness in the jet stream, with a resultant tendency for a ridge (northward swing) in western North America and a trough (dip in the jet) in the east. This allows cool and dry air to infiltrate our region, with warm and humid air kept at bay to the south. It has also kept the west in severe drought and plenty warm.

Soaking rains keep much of the Garden State green

July 17, 2014 - 10:59pm -- Dave Robinson

Heavy rain photo

The past week has seen localized soaking rains across much of NJ, though not everywhere has gotten clobbered. The map below shows rainfall totals from Sunday morning the 13th through the morning of the 16th. Over this roughly 72 hour interval as much as 8.52” fell in Howell Township (Monmouth County), followed by Belmar (Monmouth) with 7.42”, Wall Township (Ocean) 7.22”, Millstone Township (Monmouth) 5.98”, and Raritan (Somerset) 5.42”. To demonstrate the local variability of the precipitation, four Bridgewater (Somerset) locations received 5.09”, 4.55”, 4.41” and 3.88”. Differences were even more pronounced over distances of several tens of miles. For instance, only 20 miles from Howell, rainfall totaled just 0.89” at Seaside Heights (Ocean) to the south and 2.42” in Rumson (Monmouth) to the north.

On the Mild and Dry Side: June 2014 Summary and Mid-Year Recap

July 4, 2014 - 5:17pm -- Dave Robinson

Flood photo in Stewartsville

Statewide, the first six months of 2014 averaged 45.8°. This is 2.2° below normal and ranks as the 31st coolest since 1895. It was the coolest start since 2003, which was 45.0° and ranked 15th. Before then you have to go back to 1982 (45.3°), which ranked 20th. The chilliest was 1907 at 43.2°.

Precipitation (rain and melted snow) averaged 24.76" across NJ from January through June. This total is 2.11" above normal and is 26th wettest. Since 2003, four January-June intervals have been wetter, including last year. 2011 ranked one notch drier at 27th. The wettest first half of the year was 1983 at 32.51".

Heat, Rain, and Tropical Storms: Your Fourth of July Forecast

July 2, 2014 - 2:35pm -- Tom Karmel

Will this 4th of July holiday bring stormy or sunny skies?  (Photo credit: Dan Zarrow, ONJSC, 3/6/13)

The Fourth of July embodies the meaning of summer. Whether on a serene beach in Barnegat Light or in a crowded suburban backyard, New Jerseyans (and all Americans) come together for the day to celebrate our nation through excessive eating, relaxation, fireworks, and sporting the red, white, and blue. We welcome the chance to barbeque with family and friends, and just like any gathering, there is a family member you avoid... Maybe it's the uncle that eats all the food... Or the aunt who chews your ear off with anecdotes... This year, however, you'll have to keep an eye on Mother Nature.

This Friday forecast looms ahead of us with a chance of showers, which is nothing unusual. These storms look as though they should pass around noon, as a cold front advances through our region. However the impending impact of separate tropical system is far from the usual, as Tropical Storm Arthur was officially confirmed Tuesday morning.

As of Wednesday afternoon, Arthur is sitting just off the east coast of Florida and is predicted to accelerate north along the coast reaching Nova Scotia by Saturday. There is a possibility for landfall in North Carolina’s Outer Banks as a hurricane on early Friday morning before turning northeast during the day due to aforementioned front pushing it off the coast. With a bulk of the storm activity on the east side of the circulation, it will most likely not impact our area with rain as it turns away from the coast.

Rutgers in the Big Ten: a tradition of athletics, academics, and WEATHER

June 30, 2014 - 9:53am -- Dan Zarrow

Rutgers University Football Stadium
High Point Solutions Stadium at Rutgers University. (Photo: Wikipedia)

On July 1, Rutgers University officially becomes a member of the Big Ten Conference. In doing so, the Scarlet Knights join thirteen other schools in the Big Ten, bringing with it "new opportunities for academic collaboration and athletic competition."

In addition to a long-standing tradition of outstanding athletics and academics, 10 of the 14 universities in the Big Ten are home to their respective state's climate office. Each state climatologist serves as a focal point for all activities pertaining to the weather and climate of their state. The Office of the New Jersey State Climatologist at Rutgers University is proud to be among some great climatological company in the Big Ten.

In the spirit of that friendly, scholastic competition, we are putting the 14 Big Ten schools head-to-head in a weather and climatology showdown! Which school in which city and which state is the hottest? The coldest? The wettest? The snowiest? Click to find out!

Snow and more snow: 2013-2014 snow season recap

June 19, 2014 - 4:48pm -- Dave Robinson

Snow in Echo Lake Park

The record book on the winter of 2013-2014 officially closes on June 30. Given the recent streak of hot weather, and the summer solstice this Saturday, we're confident it's safe to run the calculations on seasonal snow totals a few days early. Indeed it will be hard for many New Jersey residents to forget this very active, cold, and snowy winter.

From first flake to last, this past season ranked 7th snowiest of the past 120 years. The statewide average snowfall was 54.3”, which is 28.4” (or 210%) above average. The most snow fell up north but ranked lowest of the three regions (14th) due to its normally higher seasonal average. The south had the least snow but ranked 9th highest. This was the third season on record that each of the three divisions recorded over 50"; the other two occurred in 1898-99 and 1957-58. All regions shared the snow load similarly through January. Snow was more plentiful in northern and central areas in February. The situation was reversed, exceedingly so, in March, when three accumulating events impacted the south but missed the other two regions.

A wet week: drenching rains and flash flooding visit opposite corners of the state

June 11, 2014 - 2:44pm -- Dan Zarrow

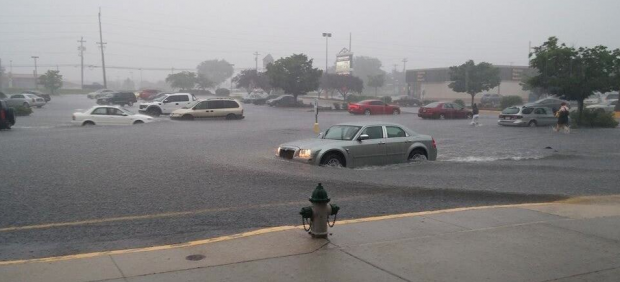
Photo of flash flooding in a parking lot

A steady stream of scattered showers and thunderstorms have brought heavy rain to several locations in New Jersey this week. And even more rain is in the forecast through the end of the week.

The deluge began on Monday morning, as commuters experienced periods of heavy, steady rain through parts of Mercer, Middlesex, Somerset, Union, Morris, Essex, and Bergen counties. The National Weather Service reported severe flash flooding in Newark, which required several motorists to be rescued.

Tuesday afternoon, another area of very heavy rain affected a narrow band in Camden, Gloucester, Burlington, and Atlantic counties. Rainfall estimates from the New Jersey Weather & Climate Network station in Sewell (Gloucester County) totaled almost 2 inches within just a half-hour from 4:30pm to 5:00pm on Tuesday. Widespread flash flooding, over a foot deep in spots, was reported to the National Weather Service by trained storm spotters and officials.

Typical Springtime Variability: May and Spring 2014 Summaries

June 7, 2014 - 1:01pm -- Dave Robinson

Flooding in Newark

May 2014 had a difficult time establishing an identity. What began with a storm that carried over from April 30th and resulted in the 7th largest flood of the past century in the Raritan basin on the 1st (see the April narrative for discussion of this event), later included some warm days, late freezes in a few locations, severe thunderstorms with hail in others, and a spectacular Memorial Day. Overall, May averaged 62.1°, which is 1.3° above average (compared to the 1981-2010 average). This ranks as the 35th warmest (tied with 1962) in the 120 years back to 1895. Precipitation averaged 5.18", which is 1.18" above average and ranks as 19th wettest. This value includes the considerable rain that fell on April 30th at National Weather Service Cooperative Stations that report during the morning hours (see April narrative for a full explanation).

Potential El Niño could impact New Jersey weather this summer

May 30, 2014 - 5:11pm -- Dan Zarrow

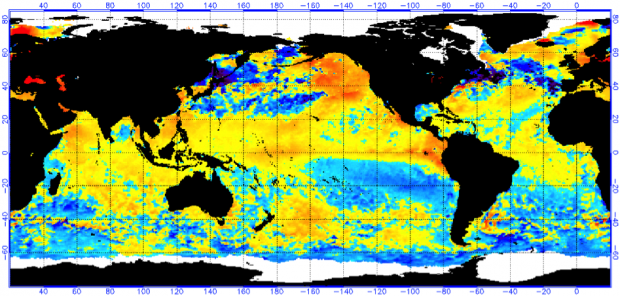
Map of impending El Nino

As climatological summer and the Atlantic hurricane season begin on June 1, scientists are carefully monitoring sea-surface temperatures in the tropical Pacific Ocean for a potential El Niño event. An El Niño occurs when warmer-than-average waters start to form in the eastern Pacific Ocean, specifically near the equatorial latitudes. Easterly winds (blowing from the east) typically move warmer water to the western Pacific (near Indonesia), permitting cooler water to upwell to the surface in the east (near South America). When these winds are weaker, or if they reverse direction, the warm water stays in the eastern Pacific. This difference in sea surface temperatures and winds creates a new dynamic between the ocean and atmosphere, distinctly affecting weather patterns across the world. No two El Niño events are alike; they vary in magnitude and location of the largest temperature anomalies. El Niño events can be classified as Strong, Moderate or Weak. What might an El Niño summer mean for New Jersey's weather?

Another End-of-Month Soaker…but First Some Flames: April 2014 Summary

May 10, 2014 - 4:44pm -- Dave Robinson

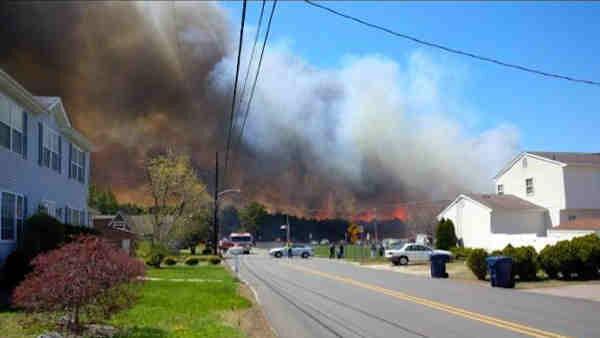
Wildfire photo

Was it a drier-than-average April? Was it a wetter-than-average April? If only it hadn't rained heavily on the last day of the month! Certainly this is a strange beginning to this monthly weather narrative. Let me explain before we get to the numbers. Most National Weather Service Cooperative observers, of which there are several dozen in New Jersey, take their daily observations in the 7-8 AM time range. So does nearly every NJ CoCoRaHS observer. These observations are recorded for the calendar day at hand, thus a day's weather records are complete as of the observation time. This means that any precipitation that occurs after the daily observation gets recorded the next morning (day). This is something that must be understood when evaluating daily precipitation reports, however, it does not make any difference in monthly totals except on the first and last day of the month. One of these exceptions occurred, in a big way, in April…or was it May?! Torrential rain fell during the daylight hours into the evening of April 30, part of an event that began lightly during the daylight hours of the 29th and ended just after observation time on the morning of May 1st (yes, meaning May 2 observations also were involved in storm totals). What up until then had been a somewhat dry April suddenly became a wet month…if you waited until midnight to take your observations. And believe it or not, some COOP stations do have observations taken at midnight. Confused? Can't blame you…

Pages

Subscribe to Front page feed