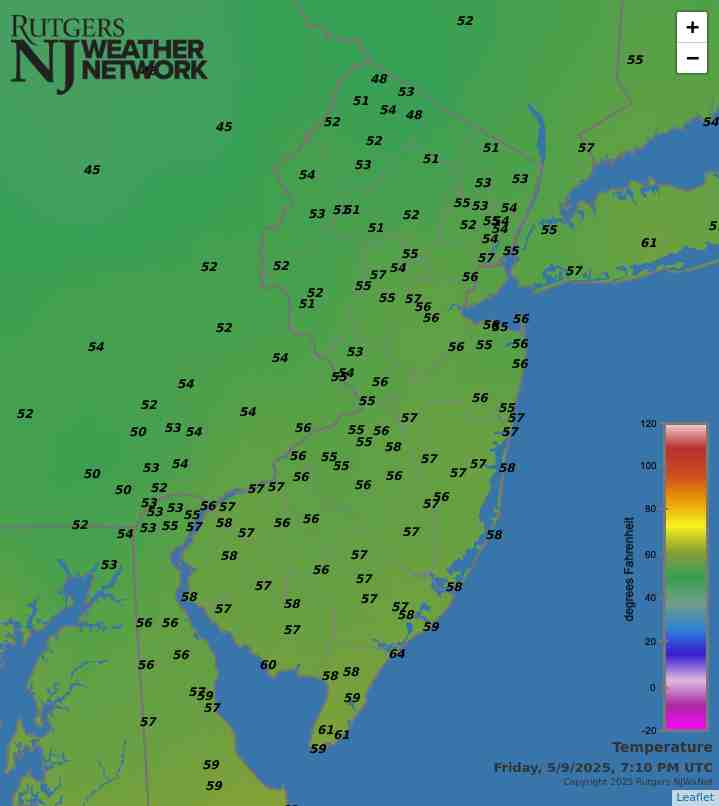
Latest Temperatures

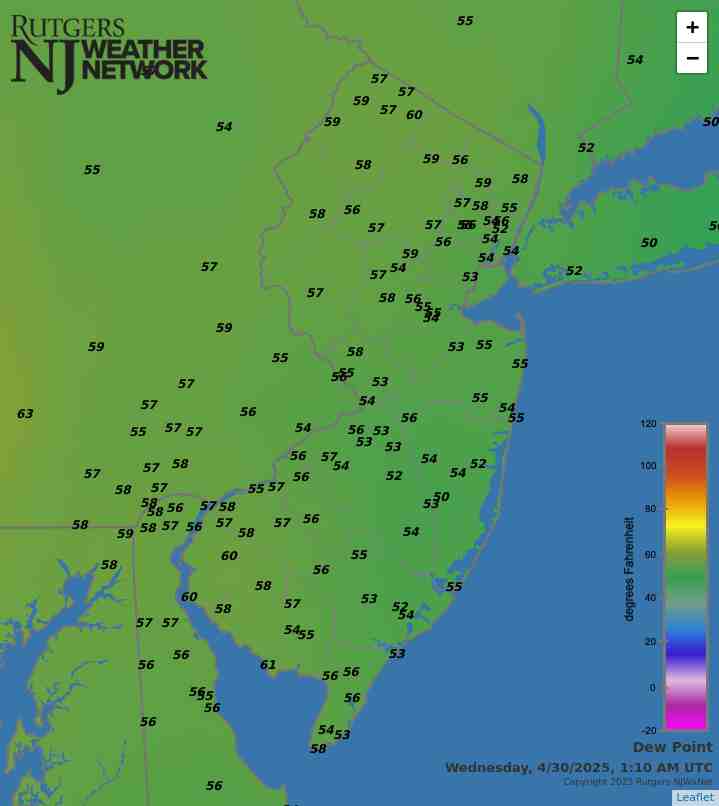
Current Dew Point

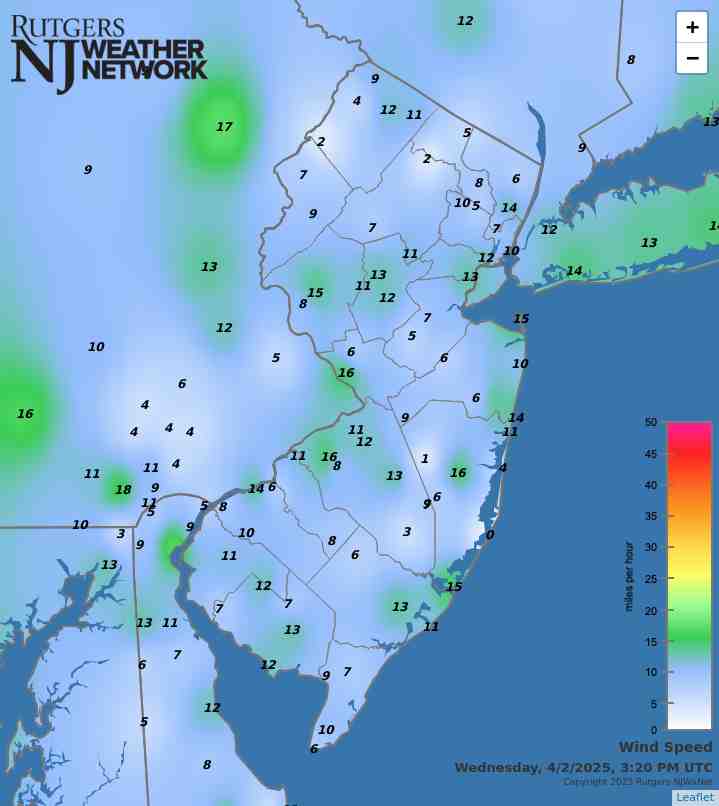
Latest Wind Speeds

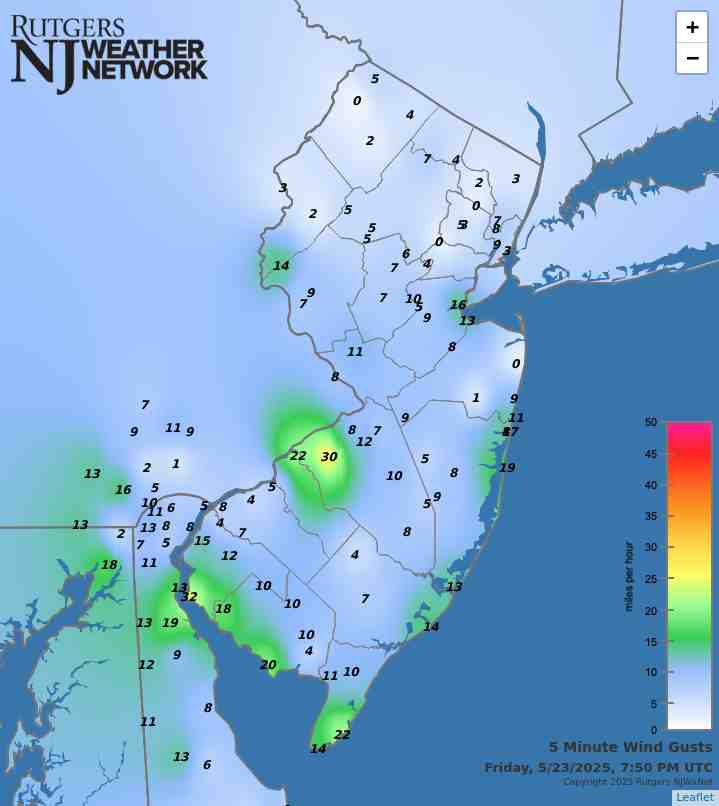
Wind Gusts

Top Story

Debris and rubble in the aftermath of flash flooding that occurred on July 14th in North Plainfield (Somerset County).
Debris and rubble in the aftermath of flash flooding that occurred on July 14th in North Plainfield (Somerset County). Photo by Seth Wenig/AP Photo.

Tragically, this July demonstrated how weather danger lurks across the Garden State during summer months. July thunderstorm winds felled trees that resulted in three fatalities, lightning strikes killed two and injured others, and flash flooding took two lives and put countless others in perilous situations. No doubt, the often-relentless heat and humidity led to medical issues for those most vulnerable, be they old, young, infirmed, employed outdoors, or living in stifling locations devoid of air conditioning.

Temperature-wise, the July statewide average temperature of 78.1° was 2.7° above the 1991–2020 mean and ranked as the 6th warmest since records commenced in 1895. The average high of 87.7° was 2.0° above normal, ranking 12th warmest, while the average low of 68.5° was 3.4° above normal, ranking 3rd warmest. Eight of the ten warmest Julys have occurred since 2010 and twelve of fifteen since 1999. Only three Julys in the past 25 years have averaged below the 1991–2010 normal. The June–July average of 75.0° is the 5th warmest, only exceeded by 76.1° in 2010, 75.6° in 2024, and 75.2° in both 2020 and 2011.

The 5.44” statewide average July precipitation was 0.73” above normal, ranking 42nd wettest of the past 131 Julys. As is often seen during summer months, totals varied markedly over rather short distances, seen this month in both the north and south. Overall, the north averaged 4.62” (-0.10”, 64th wettest/68th driest), south 5.93” (+1.19”, 26th wettest), and coast 6.08” (+1.70”, 20th wettest).

Latest Extremes

City, State Temp
Lyndhurst, NJ 75
Harrison, NJ 75
Lower Alloways Creek, NJ 75
Pennsauken, NJ 75
East Brunswick, NJ 75
City, State Temp
Wantage, NJ 64
Howell, NJ 64
Pequest, NJ 64
High Point, NJ 64
Sandyston, NJ 64
most current information as of Aug 31 7:20 PM

Latest Conditions & Forecast

New Brunswick, NJ

Rutgers University Meteorology Program

69°F

Wind

3 mph from the ESE

Wind Gust

4 mph from the ENE

Mostly Cloudy
57 °F
Mostly Sunny
78 °F
Mostly Clear
56 °F
Sunny
80 °F
Partly Cloudy
56 °F
Mostly Sunny
81 °F
Partly Cloudy
58 °F
Mostly Sunny
82 °F
Showers Likely
63 °F
Showers Likely then Chance T-storms
80 °F
Chance T-storms then Partly Cloudy
59 °F
Mostly Sunny
80 °F
Partly Cloudy
56 °F
Sunny
77 °F

Tonight

Mostly cloudy, with a low around 57. Calm wind.

Labor Day

Mostly sunny, with a high near 78. Light northeast wind becoming east 5 to 10 mph in the morning.

Monday Night

Mostly clear, with a low around 56. East wind around 5 mph becoming calm.

Tuesday

Sunny, with a high near 80. Calm wind becoming northeast around 5 mph.

Tuesday Night

Partly cloudy, with a low around 56. Southeast wind around 5 mph becoming calm.

Wednesday

Mostly sunny, with a high near 81.

Wednesday Night

Partly cloudy, with a low around 58.

Thursday

Mostly sunny, with a high near 82.

Thursday Night

Showers likely, mainly after 2am. Mostly cloudy, with a low around 63. Chance of precipitation is 60%.

Friday

Showers likely, with thunderstorms also possible after 2pm. Partly sunny, with a high near 80. Chance of precipitation is 60%.

Friday Night

A chance of thunderstorms. Partly cloudy, with a low around 59. Chance of precipitation is 30%.

Saturday

Mostly sunny, with a high near 80.

Saturday Night

Partly cloudy, with a low around 56.

Sunday

Sunny, with a high near 77.

Search by zipcode or city/state for the latest conditions, forecasts, graphs, maps and more nearest to you.

More News

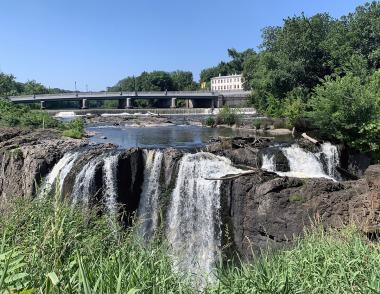
Photo of The Great Falls along the Passaic River in Paterson (Passaic County) on June 25th.

Looking back at the past month, or the first half of this year for that matter, “mysterious,” “puzzling,” or “difficult to understand” may best describe what has transpired when it comes to New Jersey’s weather and climate behavior. In other words, enigmas. More on the previous six months toward the end of this report. First a look at June, which followed a drought-busting (and hopefully not just interrupting) 7th wettest May, but resumed an only twice-broken string of months with below-normal precipitation back to May 2024 (August 2024 and May 2025). Then there were cool days that had some...

Photo of the Tour of Somerville bicycle race, held on the sunny and dry afternoon of May 26th.

It took a frustratingly long time for the cool season “recharge” of New Jersey’s water resources to get well underway. Following a record dry fall 2024, December through April precipitation remained below normal, including the third driest January of the past 131 years. However, February, March, and April precipitation totals were only a bit below normal, so while precipitation deficits were not recovering, they did not worsen, and reservoirs began to fill. Then along came May, with near record-high precipitation, just in time to bring most water resources up to normal heading into summer....

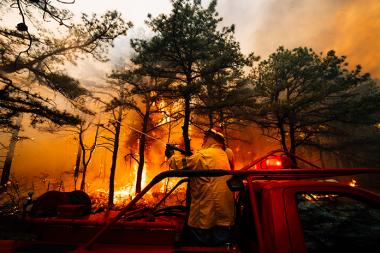
Firefighters battle the Jones Road Wildfire in Ocean County (photo courtesy of the New Jersey Department of Environmental Protection).

If it is weather variety you enjoy, April certainly must have proved rather satisfying. Atmospherically, this was expressed by a cool, wet first half of the month and a warm, dry second half. When all was totaled and averaged, the full month emerged with above-normal temperatures and close-to-normal precipitation. Toss in one northern snow event, considerable wind, lingering drought in some areas, and a major Pinelands wildfire, and there was quite a potpourri of conditions. Looking first at precipitation, the statewide average of rain and melted snowfall was 3.72”. This was 0.02” above...

More News

Winter Weather Trends: El Niño in New Jersey
December 19, 2014 - 4:41pm -- Jack McCarty

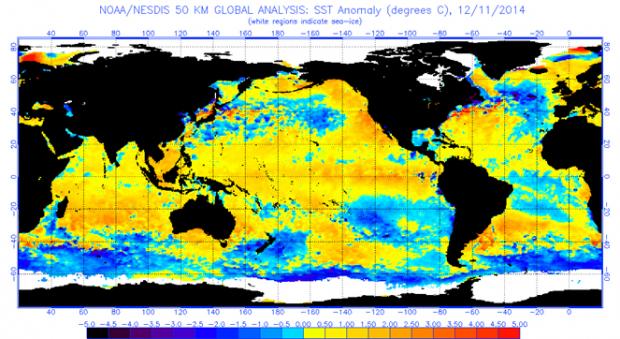
Global Sea Surface Temperature Anomalies

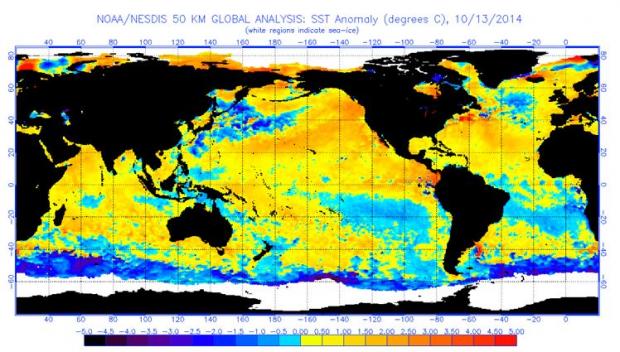
As we have mentioned in our past evaluations of the El Niño’s significance in the summer and fall, we are back again to analyze the wintertime impacts of a developing El Niño on New Jersey weather. An El Niño occurs when warmer-than-average waters exist in the central and eastern Pacific Ocean, specifically near the equatorial latitudes. This warming is due to a weakening of winds moving to the west, which typically transport warmer waters to the western Pacific, permitting cooler water to upwell to the surface in the east. When these winds are weaker or if they reverse direction, warm water stays in the east. The warmer sea surface temperatures in the east and the altered atmospheric flow pattern create a new dynamic between the ocean and atmosphere. The newly formed interaction sets up distinct and repetitive weather patterns across the world. No two El Niño events are alike; they vary depending on the magnitude and location of where the largest temperature anomalies are found. However, each one tends to alter weather patterns outside the overall norm.

A Cool Damp Month, and All Things Considered, a Rather Average Season: November and Fall 2014 Recap

December 7, 2014 - 7:32pm -- Dave Robinson

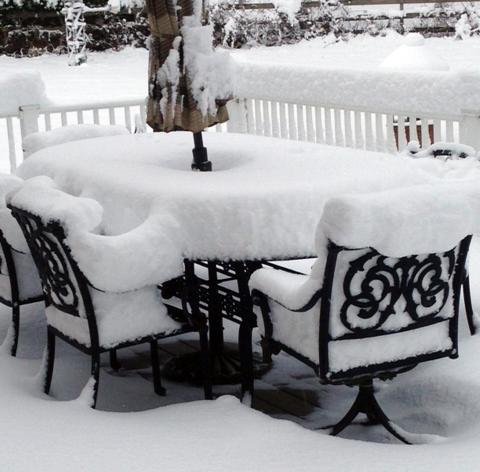
Wantage snow Nov 27

While cooler conditions took some time to arrive in New Jersey this fall, once here they locked in for the most part, as the November average temperature of 41.9° was 3.7° below the 1981-2010 average. This ranks as the 24th coolest November of the past 120 years. November precipitation (rain and melted snow) averaged 4.58" across the state. This is 0.94" above average and ranks as 31st wettest. On two occasions measurable snow was reported in northern and central areas, with these regions, respectively, picking up 4.6" and 1.9" on average for the month, with over a foot accumulating at higher elevations. Despite no snow accumulating in the south, the statewide average was 1.7", which is 1.3" above average. It is only the second November to average above an inch since 1995, the other in 2012. A Thanksgiving eve storm delivered a white Thanksgiving to central and northern counties.

Mild With Some Beneficial Rain: October 2014 Recap

November 3, 2014 - 4:57pm -- Dave Robinson

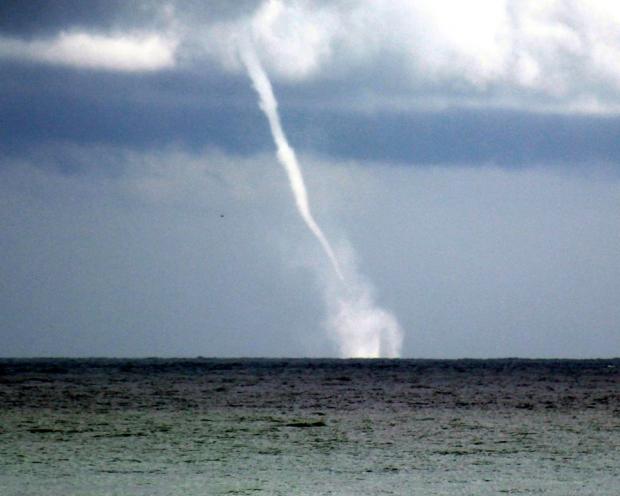
Waterspout photo

The tenth month of 2014 bucked the recent tendency toward dry conditions in northern New Jersey and proved to be the warmest month compared to normal since October 2013. Statewide, the October average temperature of 57.0° was 2.2° above the 1981-2010 average. This ranks as the 23rd warmest (tied with 1955) in 120 years (since records began in 1895). The average precipitation across NJ was 3.78". This is 0.15" below the mean and ranks as the 51st wettest October. Rainfall was above average in what have been some of the driest northern counties since mid summer. Still, from Mercer and Middlesex counties northward, precipitation has only been 50-75% of normal the past three months. Thus this area is still considered "abnormally dry" on the US Drought Monitor map.

El Niño Potential: Fall Impacts

October 15, 2014 - 10:12pm -- Jack McCarty

Sea Surface Temperature Anomalies

Early this past summer, we reported on the potential impacts of a developing El Niño event in the tropical Pacific on summertime weather in New Jersey. While El Niños can impact the weather worldwide, we found that New Jersey's weather doesn't fluctuate with an El Niño event. This year's summer (June-August) proved to be rather comfortable, with the statewide average temperature 0.8° below the 1981-2010 average , and precipitation 0.26” above the 1981-2010 average. These mild conditions replicated what we expect out of an El Niño summer. Now we’re back to tell you the story for the fall.

Increasingly Dry in the North: September 2014 Recap

October 6, 2014 - 3:04pm -- Dave Robinson

Dry grass

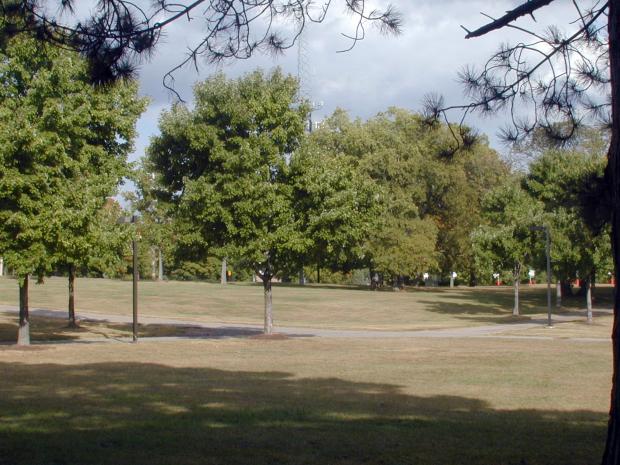
Combined with below-average precipitation in August, the northern half of New Jersey has become quite dry. Conversely, rainfall has been more common in the south, thus despite a drier-than-average September, the two-month total is slightly above average. Looking first at September, statewide precipitation averaged 2.82". This is 1.25" below the 1981-2010 average and ranks as the 46th driest September since 1895. From Hunterdon, Somerset, and Union counties northward, only 1.49" fell, which is 3.00" below average and ranks as 7th driest. The southern counties averaged 3.47", which is 0.40" below average and ranks as 56th wettest.

Heat Events in New Brunswick: A Climatological Analysis

September 16, 2014 - 1:27pm -- Jack McCarty

Heat wave photo

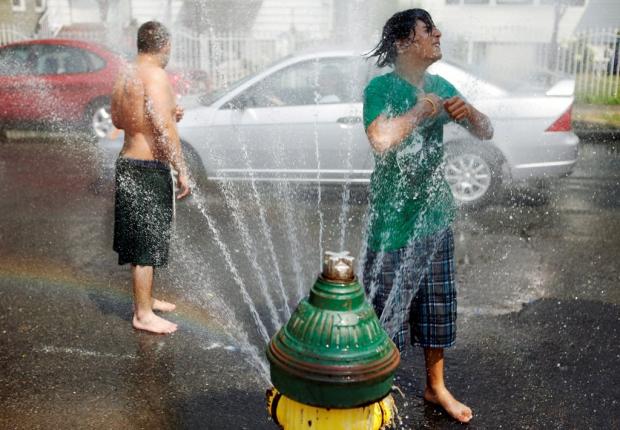
The summertime in New Jersey is characterized by warm temperatures that give some relief from cold and dreary wintertime conditions. However, amongst pleasant summer days, the atmosphere can align in a way that makes the heat on other days rather unbearable — something that we commonly refer to as a heat wave. Heat waves have a large impact on public health, utilities, infrastructure and more, which is why we often hear the media discussing heat waves across the nation. While heat waves may call for a day at the beach, they're also a cause for public concern.

Comfort Reigns: August and Summer of 2014 Recaps

September 3, 2014 - 5:50pm -- Dave Robinson

Surf photo

A month ago, many NJ residents felt July was quite cool, while in fact it was just 0.4° below the 1981-2010 mean. Such was not the case in August, which truly was on the cool side. The statewide average temperature of 71.0° was 2.4° below average. It ranks as the 32nd coolest since 1895. Even when compared to the 1895-present mean, the month was 1.5° below average. Days with a maximum temperature of 90° or greater were hard to find, certainly a characteristic of the summer of 2014, which will be discussed later in this narrative.

Precipitation varied widely across the Garden State in August, rather typical of a summer month in these parts. Individual station totals ranged from 12.33” in Lacey Township (Ocean County) to 1.01” in Hillsborough (Somerset). When monthly totals from several dozen long-term stations were averaged together, the statewide precipitation was 4.39”. This is 0.18” above the 1981-2010 mean (0.26” below the 1895-present mean) and ranks as the 53rd wettest of the past 120 Augusts. It must be noted that the heavy rain that fell after 8 AM on the 31st is not accounted for in most August station totals. For the monthly state average, only several stations that observe at midnight have their full August 31st totals included, while monthly totals at most other National Weather Service Cooperative stations only run through the morning of the 31st. For more on this observing practice, see the April 2014 report.

New Jersey Hurricane Hunting: A brief recap of a small state’s big hurricane history

August 21, 2014 - 1:35pm -- Tom Karmel

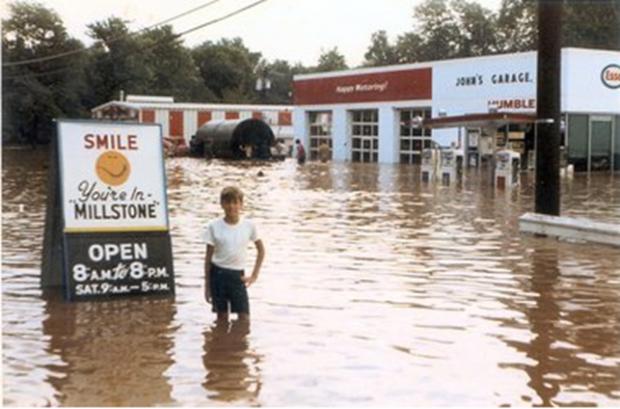
Doria flooding photo

With more than a third of the 2014 Atlantic hurricane season behind us, many may assume this season has been quiet. However, the two hurricanes already named mark the first time since 1992 when the first two named storms have reached hurricane strength and the first time there have been two hurricanes by this date since 2008. With the peak of the tropical season yet to come, the question is whether the heart of the season will be active or quiet. The National Weather Service’s Climate Prediction Center recently updated their seasonal forecast, projecting only a 5% chance of an active season and 70% chance of a less than normal one. Still, it only takes one storm to seriously impact NJ, so we can never let our guard down. With this in mind, here is a brief history of memorable tropical cyclones affecting New Jersey and a summary of the frequency of storms through the hurricane season.

Mid-Atlantic Deluge

August 13, 2014 - 5:40pm -- Dave Robinson

Rainfall estimate map

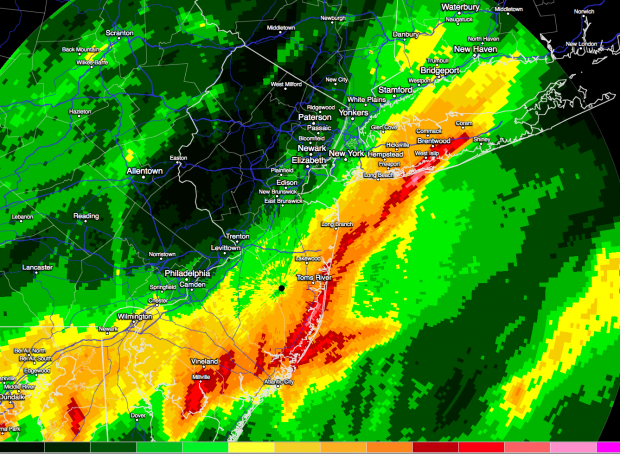
Extremely heavy rain drenched portions of the Mid-Atlantic during the daytime hours on August 12 until after sunrise on the 13th. Starting off in the Washington-Baltimore area and moving up into central Long Island, a narrow ribbon of rainfall exceeding 5”, and over 10” in a few locales, resulted in flash flooding that resulted in water rescues and many damaged roads and vehicles. Excessively heavy rains, occasionally accompanied by lightning, traveled up a frontal boundary that was associated with an unusually strong August low-pressure system situated over the Great Lakes. The atmospheric impulses riding up this front joined forces with abundant atmospheric moisture (in the top 1% for the region) to bring multiple inches per hour rainfall rates…for multiple hours.

The heaviest rain was situated within less than a 10-mile wide path. Within 20 miles on either side, totals fell off to a mere inch or two, or even less. Such is the nature of these events, where despite the abundant atmospheric moisture, there is a finite amount of water available. The dynamics concentrated the atmospheric lifting, thus the condensation of the majority of the moisture and resultant rainfall, while adjacent areas balanced out the lifted air with subsiding air that greatly limited rainfall totals.

A Rather Average July, Believe It or Not: July 2014 Summary

August 4, 2014 - 6:26pm -- Dave Robinson

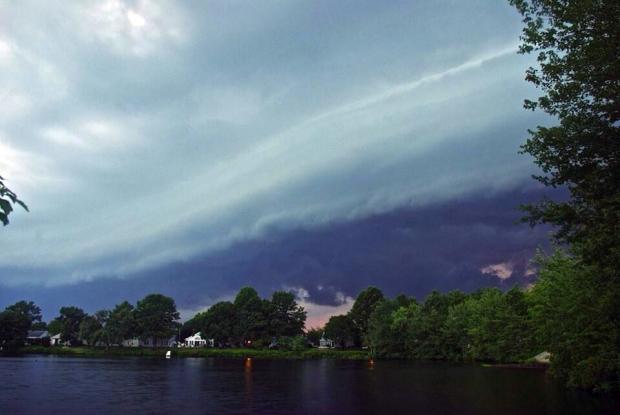
Thunderstorm photo

Despite a general feeling amongst NJ residents that July 2014 was a cold summer month, in actuality, compared to long-term records, it was rather average. The statewide average temperature of 74.5° was 0.5° below the 1981-2010 mean. However, it was 0.3° above the 1895-present mean and ranked as the 45th warmest July of the past 119 years. Even the number of afternoons with temperatures of 90° or higher was close to normal. So why the common misperception? Some armchair psychology brings me to four possibilities:

1) The first half of the month was above average, while the more recent weeks were on the cool side. Our perceptions are biased toward the most recent.

2) People have yet to “recover" from the cold start of 2014. The dubious media ramblings of the “polar vortex" returning to the eastern US in mid-July fueled these thoughts.

3) The most recent four NJ Julys all rank in the top six for warmth over the past 119 years. This was an amazing run of hot Julys.

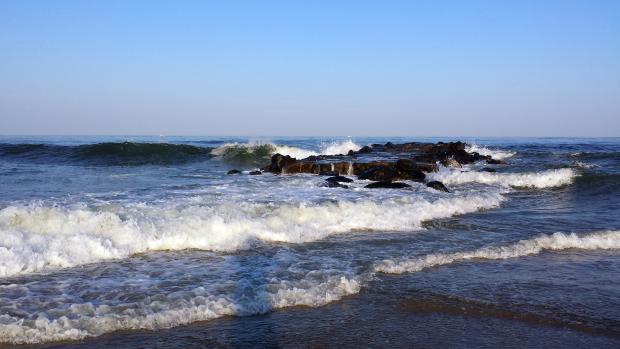
4) Those sticking their toes in the Jersey surf in early July were shocked by water temperatures in the 50°s and may have equated this to the cool July atmosphere. The cold surf was actually indicative of persistent southerly winds that brought atmospheric warmth. This wind flow led to coastal upwelling that pushed warmer surface waters offshore and introduced cool deeper waters to the surf zone.

Pages

Subscribe to Front page feed