Overview
With the warm end of September, followed by four days in the 80°s early in October, one might have wondered when fall weather was going to arrive in New Jersey. By now, we know that by mid-month a transition to cooler weather arrived. Meanwhile, there were two notable coastal nor’easters, indicative of a transition to a cool season weather regime. Unfortunately, each resulted in notable coastal flooding and beach erosion. Yet most of NJ remains modestly to moderately dry.
Ultimately, with all the ups and downs of temperature and precipitation during this transitional month, the state averaged a bit milder and drier than normal. The statewide average temperature of 56.2° was 0.8° above the 1991–2020 mean and ranked as the 33rd mildest of the past 131 Octobers. The average high of 66.5° was 0.7° above normal, ranking 45th mildest. The average low of 45.9° was 1.0° above normal, ranking 29th mildest. The northern climate division averaged 54.6° (+1.3°, 27th mildest), the southern division 57.0° (+0.5°, 41st mildest), and the coastal division 58.7° (+1.1°, 28th mildest).
October precipitation averaged 3.79”, which was 0.40” below normal. Due to the skewed nature of the monthly precipitation time series, this ranked as the 57th wettest/75th driest. The north averaged 3.71” (-0.74”, 64th wettest/68th driest), the south 3.80” (-0.23”, 49th wettest/83rd driest), and the coast 4.23” (+0.14”, 36th wettest/96th driest). The divisional averages did not tell the story of the precipitation distribution all that well. Rather, best said that the western half of NJ was on the drier side and the east wetter (Figure 1).
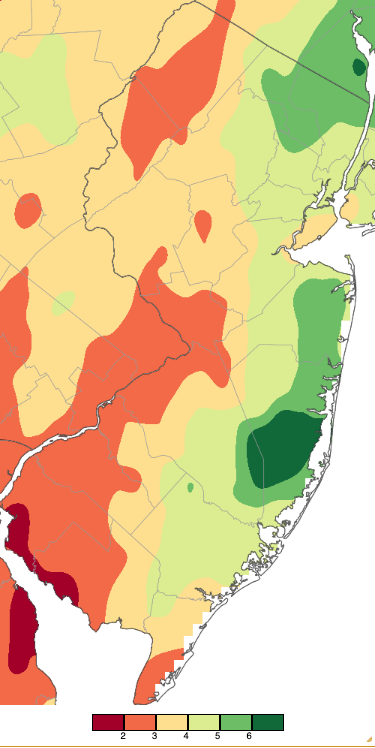
Figure 1. October 2025 precipitation across New Jersey based on a PRISM (Oregon State University) analysis generated using NWS Cooperative, CoCoRaHS, NJWxNet, and other professional weather station observations from approximately 8 AM on September 30th to 8 AM on October 31st. Note the scale in inches at the bottom of the map. Totals range from 1.00”–2.00” (dark red) to 6.00”–7.00” (dark green).
Precipitation, Storms, and Drought
October precipitation at Rutgers NJ Weather Network (NJWxNet) and NJ Community Collaborative Rain, Hail, and Snow Network (CoCoRaHS) stations ran as high as 7.02” at a Berkeley Township (Ocean County) gauge (6.17” at another in this community). This was followed by Stafford Township (Ocean) 6.59” and 5.99” (two sites), Beachwood (Ocean) 6.31”, Toms River Township (Ocean) 6.29” and 6.27” (two sites), and Lacey Township (Ocean) 6.26”. On the low end, Lower Alloways Creek Township (Salem) received just 1.49”, West Deptford (Gloucester) 1.58”, Greenwich Township (Salem) 1.81” and 2.09” (two sites), Liberty Township (Warren) 1.83”, Willingboro (Burlington) 2.20”, Ewing Township (Mercer) 2.21”, and Upper Deerfield Township (Cumberland) 2.24”.
The first week of the month was bone dry across the Garden State. The first rain event began in the pre-dawn hours of the 8th and continued into the late morning. Totals were greatest in a swath across a portion of the south, where as much as 1.19” fell in Lacey Township, Hammonton (Atlantic) 1.16”, Stafford Township 1.15”, and Beechwood 0.91” (Figure 2). Of 262 CoCoRaHS reports, 98 were from 0.50”–0.90”.
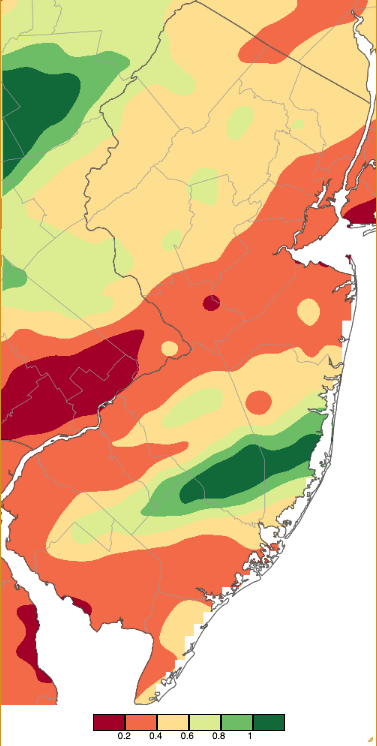
Figure 2. Precipitation across New Jersey from 8 AM on October 7th through 8 AM October 9th based on a PRISM (Oregon State University) analysis generated using NWS Cooperative, CoCoRaHS, NJWxNet, and other professional weather station observations. Note the scale in inches beneath the map.
Next up was a day of statewide light rain and drizzle. All reports came in no greater than 0.45”, except for isolated downpours depositing 1.55” in Evesham Township (Burlington) and 1.03” in Maurice River Township (Cumberland). The most substantial storm of the month began with rain moving into the far south on the 12th. Rain became heavy, especially in the northeast, early on the 13th, before heavy rain fell along the central coast, with drizzle elsewhere, during the day. The precipitation ended as light rain early on the 14th. This prolonged storm period was the result of a nor’easter that came up the East Coast before stalling off the Delmarva and NJ coasts. The cumulative effects brought storm totals to 4.08” at Brick Township (Ocean), Toms River Township 3.82”, Beachwood 3.68”, and two Stafford Township stations with 3.62”. Of 260 CoCoRaHS reports, 11 came in between 3.00”–4.08”, 21 from 2.00”–2.99”, 78 from 1.00”–1.99”, and 52 from 0.50”–0.99” (Figure 3).
Storm winds gusted above 40 mph at multiple NJWxNet stations for three days. On the 12th, Harvey Cedars (Ocean) and Little Egg Harbor Township (Ocean) caught gusts up to 59 mph, Atlantic City Marina (Atlantic) reached 56 mph, Seaside Heights (Ocean) 51 mph, and three other stations from 40–44 mph. On the 13th, Little Egg Harbor reached 57 mph, Atlantic City Marina and Harvey Cedars each 56 mph, Seaside Heights and Sea Girt (Monmouth) each 51 mph, and Wall Township (Monmouth) 42 mph. Conditions began to calm on the 14th but not before gusts reached 44 mph at Little Egg Harbor Township and 42 mph at both Atlantic City Marina and Harvey Cedars. These winds blew from the east, in the process pushing water up onto beaches and through inlets into back bays. Beaches took a pounding, with considerable erosion of a magnitude similar to the losses caused by the pounding waves of Hurricane Erin that passed well offshore in late August. The lengthy storm duration brought flood conditions during five high tides. This was a particular issue in the back bays, where water from a high tide could not fully drain out to sea before the next high tide, exacerbating the issue with each subsequent tide cycle. This led to severe flooding recorded at the Waretown (Ocean) gage situated along the mainland coast of Barnegat Bay (Figure 4). Several coastal and bay gages reported top 10 tidal heights since at least the turn of this century. Roads were closed due to the tidal flooding.
To demonstrate the longevity of the windy conditions over this storm period, the anemometer readings at Harvey Cedars on Long Beach Island were examined. Over a 90-hour interval from 9:01 AM on the 11th to 3:00 AM on the 15th, each hour experienced a wind gust exceeding 20 mph. Within that time, 12 hours had gusts of 30–39 mph, 33 hours from 40–49 mph, and 13 hours from 50–59 mph (peak gust 59 mph).
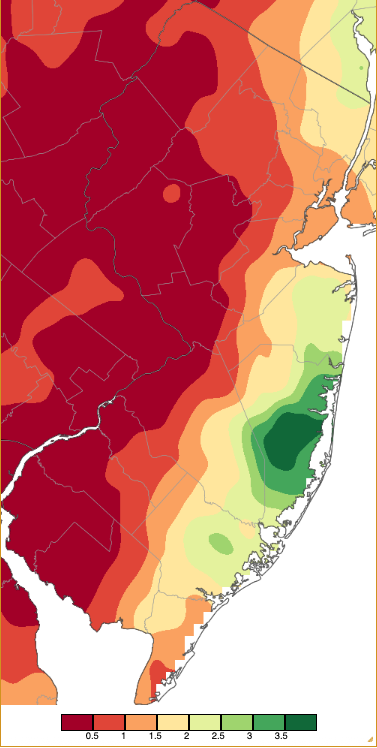
Figure 3. Precipitation across New Jersey from 8 AM on October 12th through 8 AM October 14th based on a PRISM (Oregon State University) analysis generated using NWS Cooperative, CoCoRaHS, NJWxNet, and other professional weather station observations. Note the scale in inches beneath the map, which differs from Figure 2.
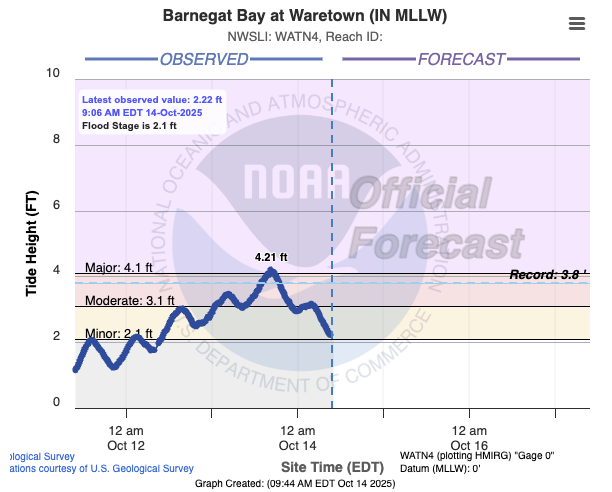
Figure 4. Tidal fluctuations (blue line) from 9PM October 11th to 9AM on October 14th at the Waretown gage on Barnegat Bay (Ocean).
Next up was pre-dawn rain on the 20th, bringing 0.35” to Mount Olive Township (Morris) and 0.32” in Lebanon (Hunterdon). Late rain on the 21st into pre-dawn on the 22nd deposited as much as 0.53” in Glen Rock (Bergen), Maywood (Bergen) and Harrison (Hudson) each with 0.52”, and North Arlington, Lyndhurst, and Montvale, all in Bergen County, with 0.50”. Additional modest rain fell in some southern areas on the afternoon of the 28th. Top totals included 0.34” and 0.32” at two Stafford Township locations and 0.30” in North Wildwood (Cape May). Winds on the 28th gusted to 46 mph at Harvey Cedars and 41 mph at Little Egg Harbor Township.
The second major storm of the month moved rather quickly through the state from late on the 29th into the evening of the 30th. Rainfall was plentiful, particularly in the Highlands and northeast, where recent conditions had been among the driest. Pompton Lakes (Passaic) caught 3.60”, Lincoln Park, (Morris) 3.35”, West Milford (Passaic) 3.29”, Butler (Morris) 3.28”, and Rockaway (Morris) 3.07” (Figure 5). Of the 264 CoCoRaHS reports, 88 were from 2.00”–2.99”, 155 from 1.00”–1.99”, and the remaining 17 from 0.79”–0.99”.
Easterly winds brought gusts on the 29th of 40 mph at Harvey Cedars. On the 30th, Sea Girt gusted to 53 mph, Little Egg Harbor Township 52 mph, and 40–47 mph at six NJWxNet sites. The 31st was one of the most widespread windy days of the year, highlighted by gusts of 49 mph at Atlantic City Marina, Lower Alloways Creek Township and Harvey Cedars both 48 mph, and nine stations from 40–45 mph. Winds were not as strong as in the early-month storm, first coming from an onshore direction and then offshore. Again, examining gusts at Harvey Cedars, of the 116 hours between 9:01 PM on the 27th to 5:00 PM on November 1st, 106 hours had gusts exceeding 20 mph. Of these hours, 67 experienced gusts from 30–39 mph and 18 from 40–48 mph (peak gust 48 mph). Numerous power outages were reported as falling trees and limbs brought down wires. There was road flooding during intervals of heavy rain. The wind also generated high water along coastal beaches and back bays. Unlike the storm earlier in the month, this time the highest water was from Barnegat Inlet and Waretown north, with the gage at the latter site reaching moderate flood level. North of Barnegat Inlet, gages peaked at the high end of the “minor” flood category for one high tide. Southern areas topped out at low to middle “minor” levels.
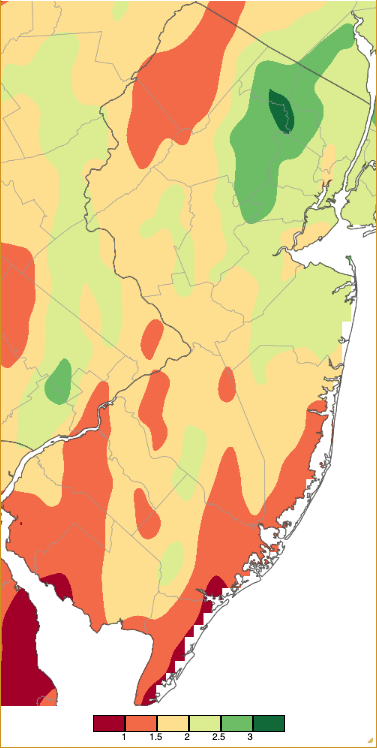
Figure 5. Precipitation across New Jersey from 8 AM on October 29th through 8 AM October 31st based on a PRISM (Oregon State University) analysis generated using NWS Cooperative, CoCoRaHS, NJWxNet, and other professional weather station observations.
The highest barometric pressures of October occurred on the 2nd, 9th, and 10th, ranging from 30.45”–30.55”. The lowest pressures were on the 31st in the range of 29.25”–29.40”. Winds gusted to 40 mph or higher at one or more NJWxNet station on nine days. In addition to the seven dates mentioned above, Little Egg Harbor Township gusted to 41 mph on the 1st and Lower Alloways Creek Township to 44 mph on the 20th.
The US Drought Monitor weekly map covering the last week of October (Figure 6; data valid October 28th) indicated that a portion of the Highlands and northwest NJ is in Severe Drought (D2), conditions that have an expected recurrence interval of 10–20 years. The remainder of the north and southward along the Delaware Valley was classified as Moderate Drought (D1), conditions having an expected recurrence interval of approximately 6–10 years. Abnormally Dry (D0) conditions were found east of D1 and in the far south, with most coastal areas not experiencing unusually dry conditions. Most areas deteriorated by one class in the past month as a statewide Drought Watch declared on October 1st for the continued. In most areas, the substantial late-month rain will stave off further deterioration at least into early November, with some local improvements expected.
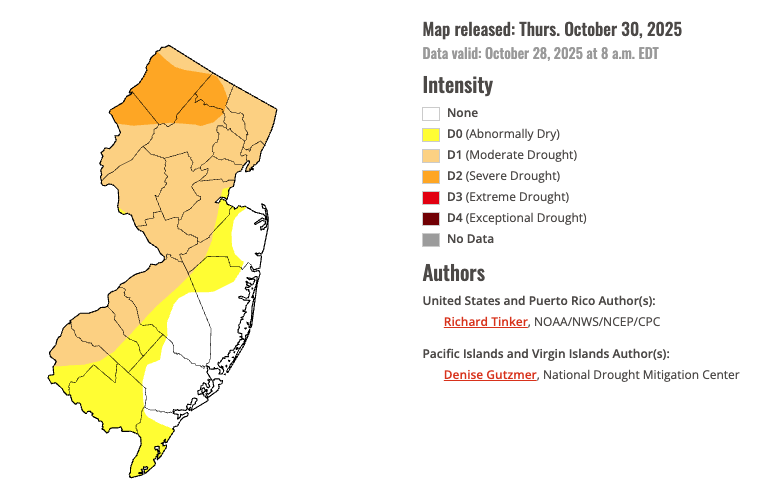
Figure 6. U.S. Drought Monitor map of conditions in NJ as of October 28th, 2025.
Temperature
October began on a warm note, with rather persistent below-normal conditions during the second half of the month. There were six days where high temperatures at one or more NJWxNet station reached at least 75° and 14 days where a station fell to 32° or colder. Five of the six warm days occurred from the 3rd–7th. On the 3rd, Sandyston (Sussex), Hackettstown (Warren), and Hillsborough-Duke (Somerset) all reached 75°. Sandyston rose from a morning low of 36°, thus attained a 39° diurnal range. Unusual warmth commenced on the 4th, with Haworth (Bergen) up to 87°, Hillsborough-Duke 86°, and 53 stations topping out from 80°–85°. Hillsborough-Duke began the day at 42°, thus had a 44° diurnal range, as did Hopewell Township (Mercer; 40°–84°).
The late-season heat peaked on the 5th, when both Basking Ridge (Somerset) and Hillsborough-Duke hit 88°, ten stations 86°–88°, and 47 from 80°–85°. Interior northern and central areas felt the brunt of the heat, with coastal areas, particularly in the far south, cooled by nearby water (Figure 7). Walpack experienced a 43° diurnal range (42°–85°).
On the 6th, Hillsborough-Duke reached 85° with 49 stations from 80°–84°. Moorestown (Burlington) made it to 85° on the 7th, with 44 sites from 80°–83°. An additional warm afternoon occurred on the 19th, when Moorestown reached 79° and 35 stations rose to 75°–78°.
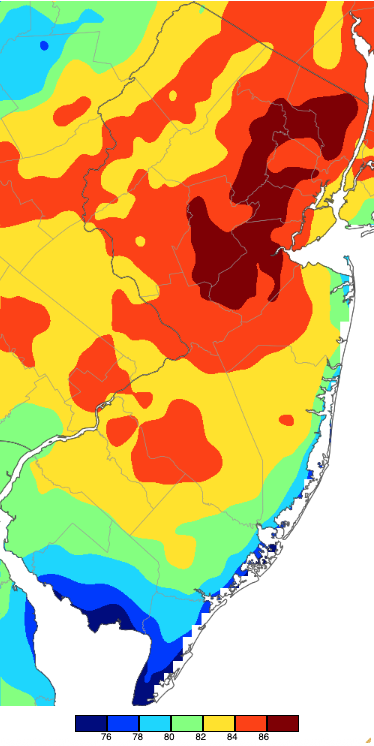
Figure 7. Maximum temperatures on October 5th based on a PRISM (Oregon State University) analysis generated using NWS, NJWxNet, and other professional weather stations. Note the 2° scale beneath the map.
The first freezing minimum of the fall was achieved on the 2nd at Walpack, with a low of 31°. Meanwhile that morning, no other station cooled below 37° and the low was a relatively balmy 61° at both Harvey Cedars and Sea Girt. Walpack (Sussex) experienced 12 days with subfreezing minimums in October. This was indicative of dry conditions during much of the month that enhanced nighttime inversions as cold air flowed off hillsides into valley bottoms, with Walpack being the most common recipient of such conditions within the NJWxNet. Advected cold air blowing into the state was never quite as cold as that generated by the localized inversions. Witness the High Point Monument (Sussex) and Vernon (Sussex) NJWxNet stations, the two with the highest elevations in the network, not falling below freezing on any day, each only making it to 33° on three and a single October day, respectively.
The 9th found Walpack at 30° and both Pequest (Warren) and Sandyston (Sussex) 32°. Walpack fell to 25° on the 10th, with ten stations from 27°–32°. Meanwhile, Atlantic City Marina and Harvey Cedars only cooled to 57°.
A four-day run of subfreezing lows began on the 16th, with Walpack at 30°. Northwest valleys again froze on the 17th, with Walpack 26°, Sandyston 29°, and Pequest 31°. Walpack reached 32° on the 18th and Hopewell Township 32° on the 19th. The 23rd found Basking Ridge at 32°, beginning a week-long run of subfreezing mornings at multiple locations. On the 24th, Walpack reached 28°, Sandyston 29°, and seven stations either 31° or 32°. Woodbine (Cape May) and Berkeley Township were among the seven, representing the first south Jersey freezing readings of the season. Walpack and Pequest fell to 29° on the 25th, with nine stations from 30°–32°. Walpack reached 27° on the 26th, with seven stations from 30°–32°. The 27th was the coldest morning of October (Figure 8). Walpack bottomed out at 21°, Pequest 24°, seven sites from 25°–29°, and nine from 30°–32°. Harvey Cedars was mildest at 49°. A wide range of lows occurred on the 28th, with Walpack 22° and six stations 27°–32°, yet six other stations only dropped to 52°. Fittingly, Walpack finished out the month falling to 32° on the 29th.
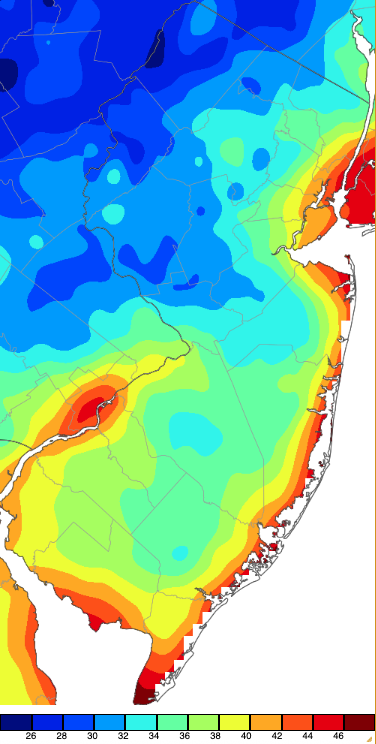
Figure 8. Minimum temperatures on October 27th based on a PRISM (Oregon State University) analysis generated using NWS, NJWxNet, and other professional weather stations.
By month’s end, 21 NJWxNet stations had fallen below freezing at least once. The end of the growing season had yet to arrive for the 48 other network stations. In fact, 13 stations failed to dip below 40° on any morning, the warmest monthly lows being 45° at Atlantic City Marina and 44° at both Harvey Cedars and Seaside Heights.


