Monthly Summaries

Pretty Darn Boring: January 2021 Recap

February 9, 2021 - 10:04pm -- Dave Robinson

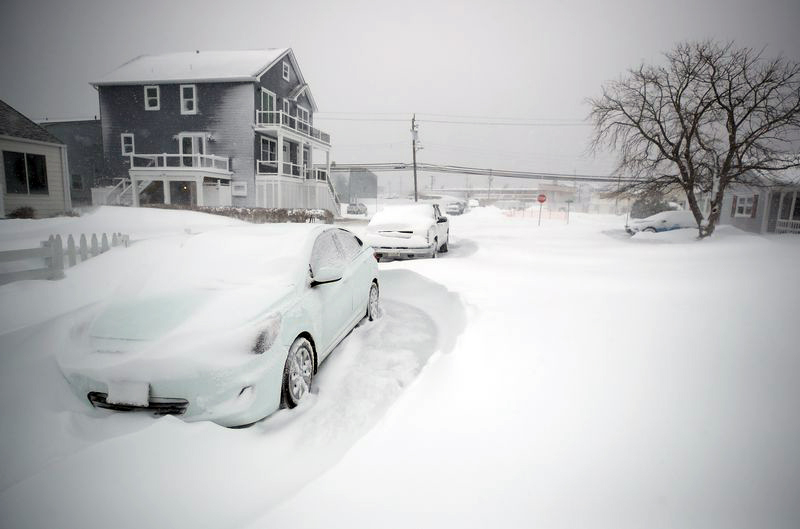
Snowfall map for January 3rd-4th

The first month of 2021 lacked major storms, whether wet or white, and temperatures rarely were either quite mild or very cold. Thus the title of this report. Yes, the last day of the month turned snowy, the harbinger of anything but a boring start to February, but that’s to be covered next month. The January statewide average temperature was 33.7°. This was 3.0° above the 1981–2010 normal and ranks as the 26th mildest January in the past 127 years. The average high was 41.1°, which is 1.8° above normal and ranks 34th mildest, while the average low of 26.3° was 4.2° above normal, ranking 20th mildest.

January precipitation (rain and melted snow) averaged 1.99” across the state, which is 1.41” below normal and ranks 13th driest since 1895. The north averaged 1.93” (-1.48”, 18th driest), the south 2.02” (-1.37”, 13th driest), and the coast 2.19” (-1.25”, 17th driest). Generally, the eastern half of the state was wetter (particularly the northeast) than the west.

A Mixed Bag, and A Blow Torch Year: December & Annual 2020 Recaps

January 7, 2021 - 4:43pm -- Dave Robinson

Drone photos of tidal flooding near the morning high tide on December 17th

The statewide average temperature during this last month of 2020 averaged 37.0°. This was 1.8° above the 1981–2010 normal and ranks as the 22nd mildest December in the 126-year record that dates back to 1895. Northern and southern portions of NJ had similar departures and rankings.

December precipitation (rain and the liquid equivalent of snow and sleet) averaged 6.24”. This includes rain measured at National Weather Service Cooperative Observing stations on the morning of December 1st but does not include rain measured at these stations for the 24 hours ending on the morning of January 1st. See an explanation of the November 30th–December 1st measurement in the November report. The monthly value is 2.39” above average and ranks as the 11th highest December precipitation total on record. North Jersey averaged 6.73”, which is 2.78” above average and ranks 7th wettest. The south came in at 5.89”, which is 2.10” above average and ranks 17th wettest. The coast averaged 6.43”, which is 2.67” above average and ranks 11th wettest.

The Heat Goes On: November & Fall 2020 Recaps

December 7, 2020 - 8:43pm -- Dave Robinson

CoCoRaHS rain gauge

November 2020 enters the New Jersey climate record book as the third warmest (tied with 2009). The statewide mean of 49.2° was 4.0° above the 1981–2010 normal. This month joins six Novembers from this century among the seven warmest of the past 126 years. Six of the past 12 months have ranked in the top nine for warmth. Of the first 11 months of 2020, only April and May averaged below normal. The average temperature for the first 11 months is 57.1°. This is 2.7° above normal and ranks as the second warmest such interval. Only 2012 was warmer, with both years likely to retain this ranking for the calendar year unless an extremely cold or warm December occurs, which, as this report is written, appears unlikely.

Statewide precipitation total for November was 3.91”. This was 0.30” above the 1981–2010 normal and ranks as the 43rd wettest of the past 126 years. The southern half of the state was on the wetter side of normal while the north on the dry side. This was seen in the divisional numbers that had the south come in with 4.43”, which is 0.98” above average 33rd wettest, while the north averaged 3.09”, which is 0.77” below average and ranks 78th wettest (49th driest).

A Transition Month for Sure: October 2020 Recap

November 5, 2020 - 1:52pm -- Dave Robinson

Dew spider web on the morning of October 14th in Sussex County

As the warmth of summer transitions to the cold of winter, New Jersey weather conditions can vary markedly from week to week. Such was the case during October 2020, with abundant precipitation occurring from the remnants of two hurricanes, an episode of measurable snow in the north, several weeks of quite dry conditions, a number of comfortably warm days, and the first frost and freeze of the season for many locations. Put this all together and October proved to be milder and wetter than normal. The statewide monthly average temperature of 57.2° was 2.7° above the 1981–2010 mean. This ranks as the 18th mildest (tied with 1963 and 1931) over the 126 years extending back to 1895. Southern areas were warmer than northern ones in terms of actual temperature and departure from normal. The 58.8° average in the south was 3.2° above normal and ranked 15th warmest. The north averaged 54.4°, which was 2.0° on the plus side and ranking 27th mildest.

It took a wet final week of the month to push precipitation totals to the plus side of normal. The 5.15” statewide monthly average was 1.26” above normal and ranked as the 24th wettest on record. Somewhat like temperatures, there was north-south disparity. The south averaged 5.36”, which is 1.73” above normal and ranks 20th wettest. The north averaged 4.64”, which is 0.33” above normal and ranks 36th wettest. Dry conditions prevailed, most notably in the northwest, with coastal reaches wettest. Snow fell in the north on the 30th and will be discussed below.

Up and Down But in the End Quite Average: September 2020 Recap

October 6, 2020 - 1:08pm -- Dave Robinson

Smokey sunset on September 15th

September 2020 was a month of widely-varying temperatures, several episodes of heavy precipitation, and an extended dry spell. Put it all together and conditions averaged quite close to normal. The statewide monthly average temperature of 66.8° was 1.0° above the 1981–2010 mean. While it was the seventh month of 2020 to average above normal, it was the first of these not to rank in the top 10 for warmth. Rather, it ranked 33rd warmest of the past 126 Septembers. Divisional departures from normal ranged from +0.7° in the north to +1.5° along the coast. The statewide average maximum temperature was 76.6°, which is 0.3° above normal and ranks 47th warmest. The average minimum of 56.9° was 1.6° on the warm side and ranked 24th mildest. High temperatures were likely reduced by several degrees during a mid-month period when a veil of smoke from western US forest fires blanketed the sky at an altitude of about 15,000 feet when skies otherwise would have been blue, especially on the 15th–16th. It is uncertain if this kept minimum temperatures somewhat warmer than they would otherwise have been. A cold front moved through from the northwest on the 18th, clearing the skies and sending temperatures plummeting. What followed was a four-day spell of temperatures that were well below average, including four nights with below-freezing temperatures at three to four Rutgers NJ Weather Network sites. While freezes resulting from cold air draining into valleys in some northern locations are not unprecedented before the end of astronomical summer, it is highly unusual for the cold to persist over four consecutive nights.

The Beat Goes On: August 2020 & Summer Recaps

September 7, 2020 - 9:50pm -- Dave Robinson

Sunset photo

August joined the chorus of much warmer-than-normal months experienced throughout most of 2020 to date across the Garden State. Six of the eight months have ranked among the top 10 warmest for the 126 years beginning in 1895. Only April and May are outliers and, in fact, each of them had below-average temperatures. With a mean of 75.5°, August tied with 2001 and 1955 as the 6th warmest. This is 2.5° above the 1981–2010 mean. Eleven of the warmest 17 Augusts have occurred since 2001. The mean maximum of 84.8° tied for 19th warmest at 1.5° above normal, while the mean minimum of 66.1° was 3.4° above normal and ranked 4th warmest.

Statewide precipitation averaged 6.04”. This is 1.94” above normal and ranks as the 26th wettest August on record. Above-average totals occurred in northern (6.02”), southern (6.10”), and coastal (5.50”) climate divisions. The southern division (Mercer-Middlesex-Monmouth counties and south, except a narrow coastal division) saw a range from the driest area in Monmouth and parts of Mercer counties and a very wet area in Salem and Gloucester counties.

Record Heat: July 2020 Recap

August 8, 2020 - 7:03pm -- Dave Robinson

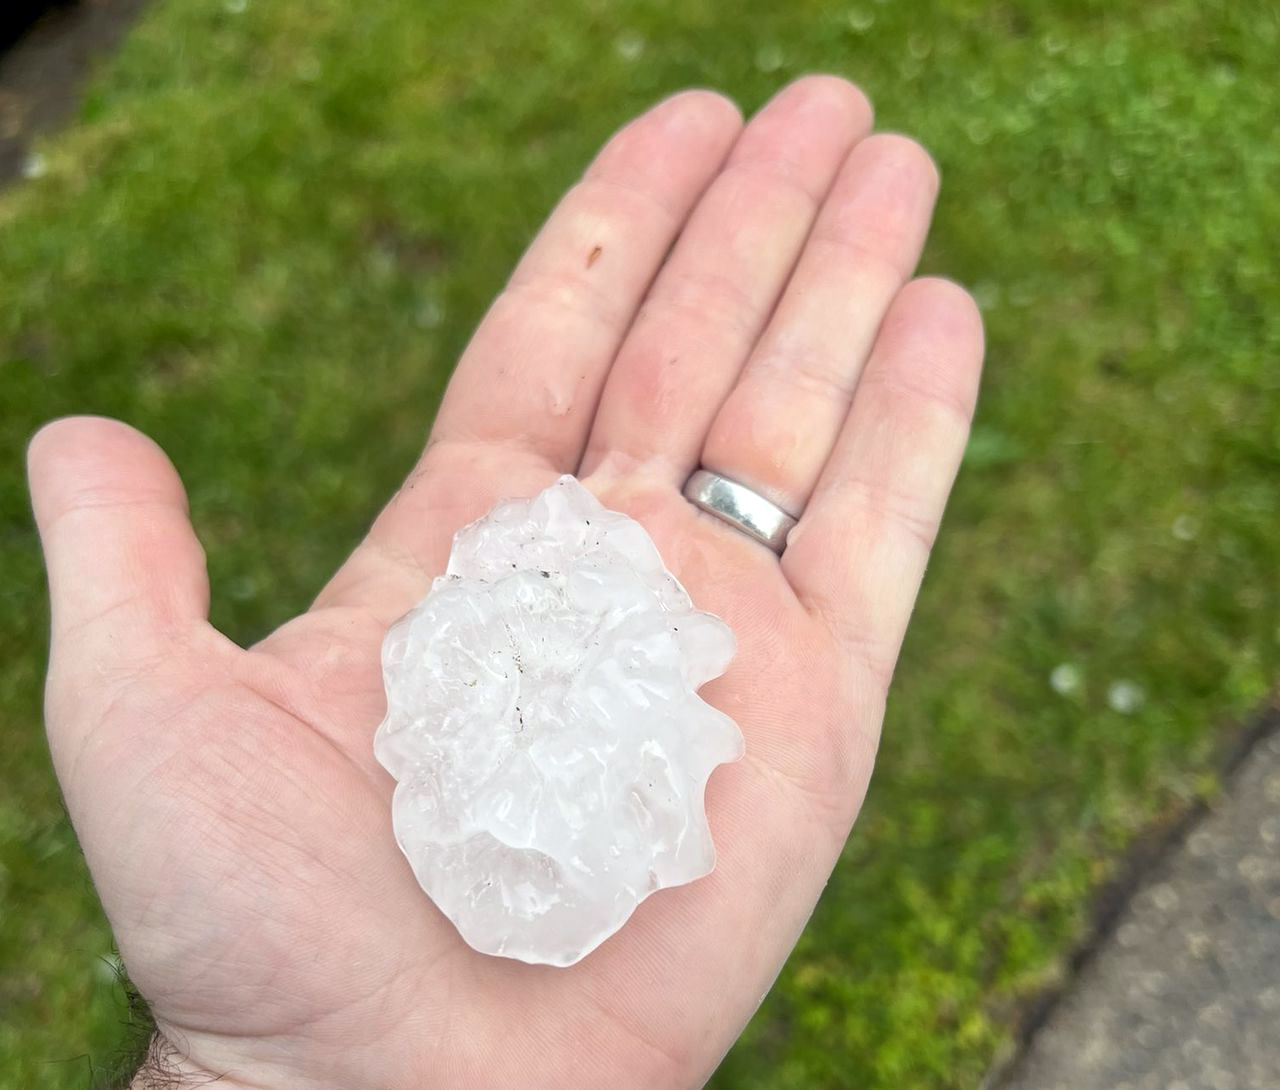
Upper Township hail on July 1st

July 2020 was the hottest month on record for the Garden State since records commenced in 1895. The statewide average temperature of 78.8° was 4.2° above the 1981–2010 normal. This reading surpasses by 0.4° the previous record held jointly by 1955, 1999, and 2011. The next ten warmest months have occurred in July, with the warmest August averaging 76.8° in 2016, which is tied with July 1994 as the 11th warmest month on record. The average 88.9° maximum this past July was 5th warmest, the warmest occurring in 1999. The average minimum of 68.8° ranked second, trailing just 2013. The southern and coastal climate divisions had their warmest month on record while the northern division ranked second.

The statewide average precipitation this July was 6.79”. This is 2.22” above the 1981–2010 normal and ranks as the 15th wettest July on record. Looking at the state in quarters from north to south, the northernmost was driest, particularly the northwest. Next came a wet sector, followed by a more average one, with the southernmost quarter the wettest. Few locations received less than 4 inches, while scattered totals of more than 10 inches were found in the two wettest quarters.

Summer Arrives: June Recap (with a brief look at the first half of 2020)

July 7, 2020 - 4:44pm -- Dave Robinson

Tree blown over from June 3rd derecho

The statewide average precipitation this June was 3.10”. This is 0.91” below the 1981–2010 average and ranks as the 43rd driest of the past 126 Junes. As is typical during the warm season, where the bulk of the rainfall is provided by showers and thunderstorms, totals varied widely from location to location, even at times in close proximity to one another. Monmouth and northern Ocean counties saw the most, totaling over 5.00” in spots, with a secondary maximum in Gloucester County. The Highlands, portions of central NJ, and southern Ocean and Cape May counties saw as little as 1.00–2.00”.

The statewide average temperature of 71.6° was 1.8° above the 1981–2010 normal. This ranks as the 10th warmest, joining four other years this century in the top 10, while being the warmest since 2011.

Endless Spring: May and Spring 2020 Recaps

June 7, 2020 - 6:34pm -- Dave Robinson

In recent years, many a comment has been heard that New Jersey just does not have a spring season any more. We go right from winter to summer weather, people say. The same cannot be said for spring 2020. A seasonal summary follows at the end of this report and the individual March and April reports can be found on the state climate office website. To begin here, the talk will be of May, a month that produced both less rain and cooler temperatures than normal and included an unusual appearance of snow.

The statewide average temperature of 58.9° was 1.7° below the 1981–2010 normal. This ranked as the 40th coolest May since records commenced in 1895. April and May marked the first time since December 2017–January 2018 that consecutive months had below-average temperatures. Statewide, May precipitation averaged 2.50”. This was 1.49” below normal and ranked as the 29th driest on record.

Blown Away: April 2020 Recap

May 5, 2020 - 10:23pm -- Dave Robinson

Gas station canopy collapse

If you have a sense that April was unusually windy, you are certainly not alone. While long-term wind observations are few across the Garden State and those available suffer from inconsistencies in instrumentation and location, seat-of-the-pants judgment tells us that plenty of air raced crossed the state throughout the month. In fact, the wind gusted to 40 mph or higher at one or more NJWxNet station on 12 days. Of those, seven had gusts from 50–59 mph and an impressive four gusted over 60 mph. The highest network gust of 76 mph occurred at Sea Girt (Monmouth County) on the 21st. There were also reports from other seemingly reliable stations of gusts as high as 82 mph at Island Beach State Park (Ocean) on the 13th.

April precipitation achieved a statewide average of 3.92”. This is 0.07” below the 1981–2010 mean, but given the skewness of the distribution of April rainfall over the past 126 years, it ranks as the 45th wettest. Despite Morris County stations having the highest monthly totals, overall, the north part of the state was driest. The mean of 3.66” was 0.54” below normal and is the 59th driest (68th wettest). The south averaged 4.07”, which is 0.21” above normal and is 40th wettest. The narrow coastal region averaged 4.16”, which is 0.33” above normal and ranks 39th wettest.

Pages

Subscribe to RSS - Monthly Summaries