August Overview
August and summer 2025 weather conditions vacillated between heat with plenty of humidity to cool and quite pleasant. In the mix were also some local extreme storms with damaging impacts, while there were also some extended dry intervals. Flip flopping seems to appropriately sum up this Jersey summer in the weather department. This report first focuses on August conditions across the Garden State, then provides a summary of summer (June–August) conditions.
Except for some local areas, August was a dry month for New Jersey. This is even more apparent when eliminating the heavy rain that fell in some areas during the afternoon and evening of July 31st, which, having occurred following morning observations at most reporting stations, qualifies as August rain. This is hardly the first time this end-of-month situation has occurred. In fact, only last month did post-observation rain on the June 30th count in July tallies. This sort of impact on a monthly total can be minor, but when last-day rainfall is substantial and subsequent days in the new month run dry, it may noticeably impact the new month’s total. To illustrate this, Figure 1 shows August monthly precipitation based on the full “official” weather month (thus includes rain falling following observation time on July 31st), while Figure 2 depicts rainfall from post-morning observations on August 1st through morning observations on the 31st (excluding PM rain from July 31st). A comparison clearly shows that the bulk of August experienced well below-normal precipitation.
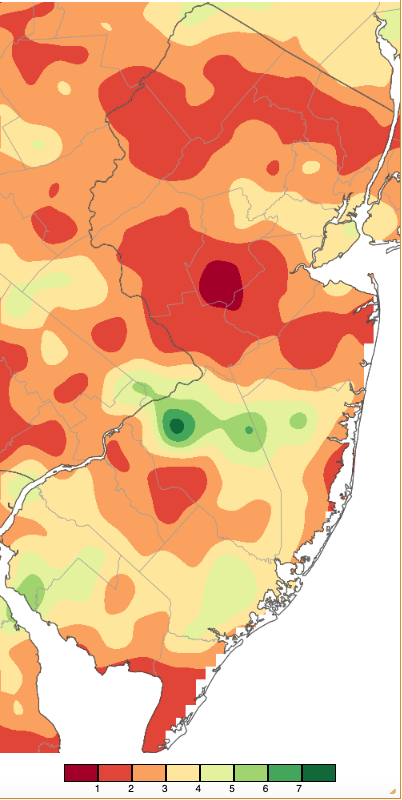
Figure 1. August 2025 precipitation across New Jersey based on a PRISM (Oregon State University) analysis generated using NWS Cooperative, CoCoRaHS, NJWxNet, and other professional weather station observations from approximately 8 AM on July 31st to 8 AM on August 31st. Note the scale in inches at the bottom of the map. Totals range from 0.00”–1.99” (dark red) to 7.00”–7.99” (dark green).
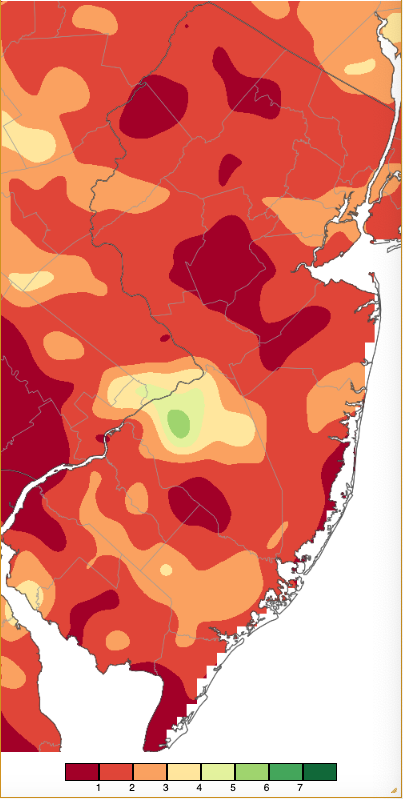
Figure 2. Precipitation across New Jersey based on a PRISM (Oregon State University) analysis generated using NWS Cooperative, CoCoRaHS, NJWxNet, and other professional weather station observations from approximately 8 AM on August 1st (excluding PM rain from July 31st) to 8 AM on August 31st. The scale is the same as in Figure 1.
Using the official approach, thus including the July 31st rainfall, New Jersey averaged 2.16” for August. This is 2.41” below normal, which ranks 13th driest dating back to 1895. The northern climate division (Hunterdon-Somerset-Union and all counties to their north) averaged 2.22” (-2.34”, 14th driest). The southern division (Mercer-Middlesex-Monmouth and all but immediate coastal areas to the south) came in at 2.14” (-2.43”, 14th driest). The coastal division averaged 2.11” (-2.49”, 16th driest).
August began with a stretch of cooler-than-normal conditions, then warmed for a little over a week before again dropping below normal at month’s end. Overall, the 70.7° statewide monthly average was 2.9° below normal, ranking 37th coolest of the past 131 years. It was the coolest August since 1994. The average high of 81.4° was 2.4° below normal and ranks 39th coolest. The average low of 59.9° was 3.4° below normal and ranks 35th coolest. The northern climate division averaged 69.5° (-2.4°, 45th coolest), the southern 71.4° (-3.2°, 31st coolest), and the coastal 71.5° (-3.2°, 33rd coolest).
Precipitation and Storms
August precipitation at individual stations around the state varied by a factor of 13. The most rain fell in Mount Laurel Township (Burlington County), where two locations received 8.45” and 7.63”. A Willingboro Township (Burlington) gauge caught 6.40”, Manchester Township (Ocean) 6.32”, New Providence (Union) 6.09”, and Long Hill Township (Morris) 5.21”. On the low end, 0.65” fell in gauges in Hillsborough Township (Somerset) and Franklin Township (Somerset), followed by South Brunswick (Middlesex) 0.78”, Lower Township (Cape May) 0.91”, Middle Township (Cape May) 0.92”, and Plainsboro (Middlesex) 1.00”. The above totals all included late-day July 31st rainfall. Removing those values saw totals for August decline to at top value of 6.25” at a Mount Laurel location and the lowest total of 0.36” in Middle Township.
The scattered heavy rain during the late morning and afternoon on July 31st brought as much as 5.18” to Fort Dix (Burlington), Manchester Township 4.30”, Montague (Sussex) 3.91”, Long Hill Township 3.57”, and Greenwich (Cumberland) 3.56”, with 18 Community Collaborative Rain, Hail, and Snow Network (CoCoRaHS) stations coming in from 2.00”–2.99”, and 68 from 1.00”–1.99” (Figure 3).
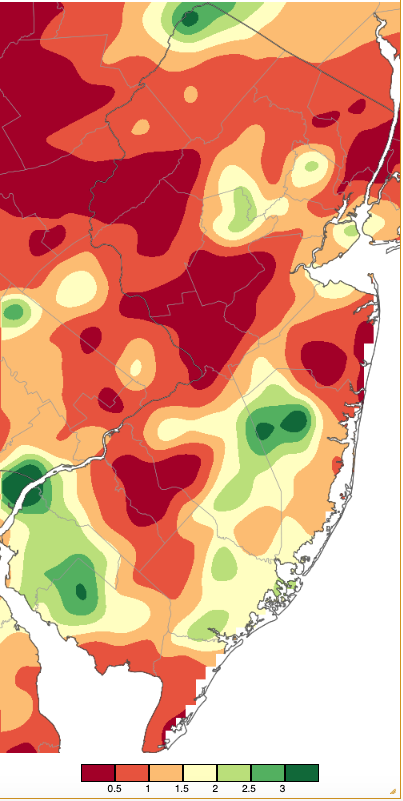
Figure 3. Precipitation across New Jersey from 8 AM on July 31st through 8 AM August 1st based on a PRISM (Oregon State University) analysis generated using NWS Cooperative, CoCoRaHS, NJWxNet, and other professional weather station observations. Note the scale in inches beneath the map.
Once some remnant showers concluded early on the 1st, little to no rain fell anywhere in the NJ through the morning of the 13th. This ended when a line of storms crossed the state during the afternoon and evening of the 13th. Much as seen throughout the month, moderate to heavy rainfall was spotty (Figure 4). Greenwich (Cumberland) received 2.84”, followed by Salem (Salem) 1.69”, Lower Alloways Creek Township (Salem) 1.64”, Clinton Township (Hunterdon) 1.46”, Hamilton Township (Atlantic) 1.43”, Pemberton Township (Burlington) 1.41”, Lakewood Township (Ocean) 1.37”, Mansfield (Burlington) 1.31”, and 1.29” at both Califon (Hunterdon) and Lopatcong Township (Warren). Of 240 CoCoRaHS locations, 21 caught 1.00”–2.84” and 58 from 0.50”–0.99”. Lower Alloways Creek Township received a 43-mph gust, the only Rutgers NJ Weather Network (NJWxNet) location to gust to 40 mph.
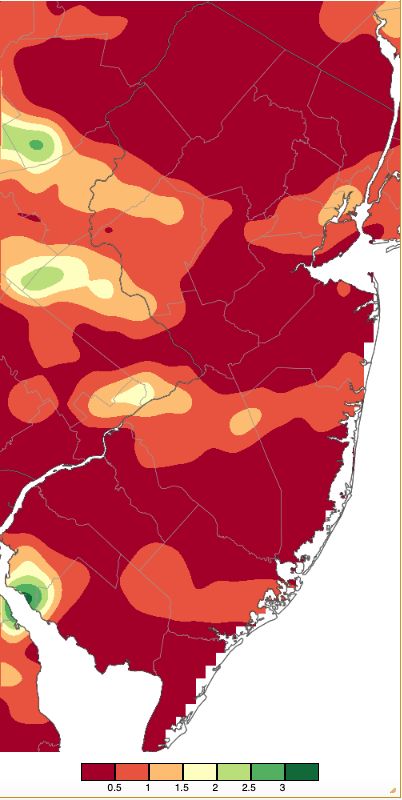
Figure 4. Precipitation across New Jersey from 8 AM on August 13th through 8 AM August 14th based on a PRISM (Oregon State University) analysis generated using NWS Cooperative, CoCoRaHS, NJWxNet, and other professional weather station observations. The scale in inches beneath the map is the same as in Figure 3.
Late afternoon and evening showers on the 14th delivered 1.61” to Egg Harbor Township (Atlantic), Sicklerville (Camden) 1.55”, Hamilton Township (Atlantic) 1.48”, Buena Vista Township (Atlantic) 1.30”, and Winslow Township (Camden) 1.29”. Of 240 reports, nine fell between 1.00”–1.61” and 21 from 0.50”–0.99”.
Yet another example of the localized nature of summertime deluges occurred during the late afternoon and evening of the 17th (Figure 5). Two Mount Laurel gauges filled to 5.50” and 3.66”. Elsewhere in Burlington County, Columbus saw 3.28”, Moorestown 3.10”, Willingboro 2.90”, Mansfield Township 3.65” and 2.71” (two sites), Bordentown 3.44” and 2.67” (two sites), and Medford Township 2.90”. Elsewhere, New Providence was hit with 2.83”. Of 257 CoCoRaHS reports, nine locations received 1.00”–1.99” and 32 from 0.50” –0.99”.
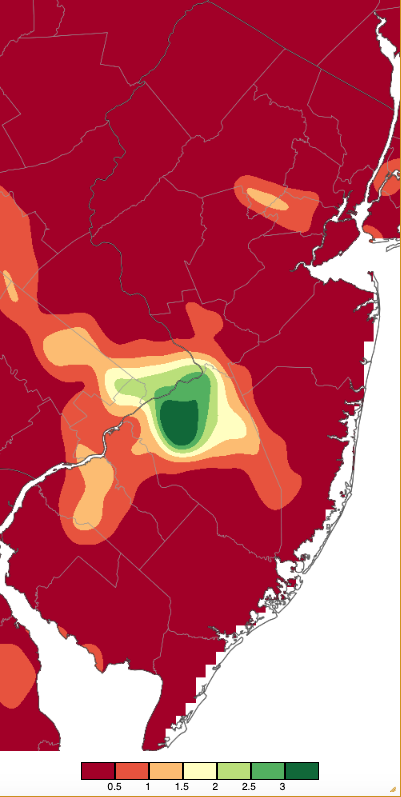
Figure 5. Precipitation across New Jersey from 8 AM on August 17th through 8 AM August 18th based on a PRISM (Oregon State University) analysis generated using NWS Cooperative, CoCoRaHS, NJWxNet, and other professional weather station observations.
Local showers on the afternoon and evening of the 18th brought as much as 0.86” in Hamilton Township (Atlantic), Buena Vista Township, and Mullica Township (Atlantic). The Atlantic City Marina (Atlantic) NJWxNet station received a 40-mph gust. Morning drizzle became a steadier rain in the north during the afternoon of the 20th before moving to central areas and the north coast during the evening. Top totals included Mahwah Township (Bergen) 1.85”, Vernon Township (Sussex) 1.77” and 1.34” (two sites), Neptune City (Monmouth) 1.47”, Manasquan (Monmouth) 1.41”, and Brick Township (Ocean) 1.40” (Figure 6). Of 264 reports, 31 were from 1.00”–1.85” and 103 from 0.50”– 0.99”.
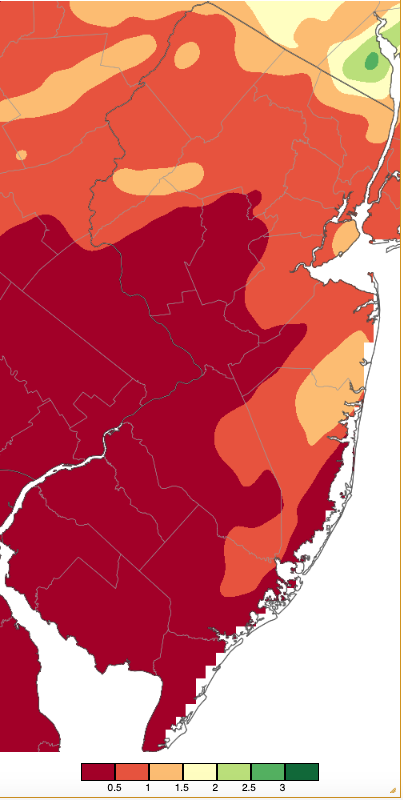
Figure 6. Precipitation across New Jersey from 8 AM on August 20th through 8 AM August 21st based on a PRISM (Oregon State University) analysis generated using NWS Cooperative, CoCoRaHS, NJWxNet, and other professional weather station observations.
Some light rain lingered throughout NJ on the 21st, with all totals under 0.15”. Accompanying the showers was an increasing easterly wind, this associated with Hurricane Erin whose center was situated approximately 300 miles to the southeast of the state. Peak gusts on the 21st reached 46 mph at Atlantic City Marina and 43 mph at Harvey Cedars (Ocean). While the rain, which was not directly associated with the storm, and the wind were not impressive, the large size and strength of Erin generated waves of 5 to 10 feet along the coast, dangerous rip currents, and notable tidal levels and beach erosion along Atlantic coastal beaches. The south Jersey coast experienced greater impacts than to the north. The tidal gauge in Cape May Harbor (Cape May) reached 7.89’ the evening of the 21st (Figure 7). This is considered a high “moderate” level, just four inches from “major” criteria. This was the fourth highest level in at least 22 years, only surpassed by 9.36’ during a nor’easter on January 23, 2016, 8.67’ from Sandy on October 29, 2012, and 7.92’ during Irene on August 27, 2011. At Barnegat Inlet (Ocean), the 4.67’ “moderate” level was 2” above minor level, ranked 15th highest, and was the highest level outside of the October to February period in over 30 years. In the far north at Sandy Hook (Monmouth), the 7.67’ “minor” height was less than an inch below “moderate” level. This failed to rank in the top 70 since 1953.
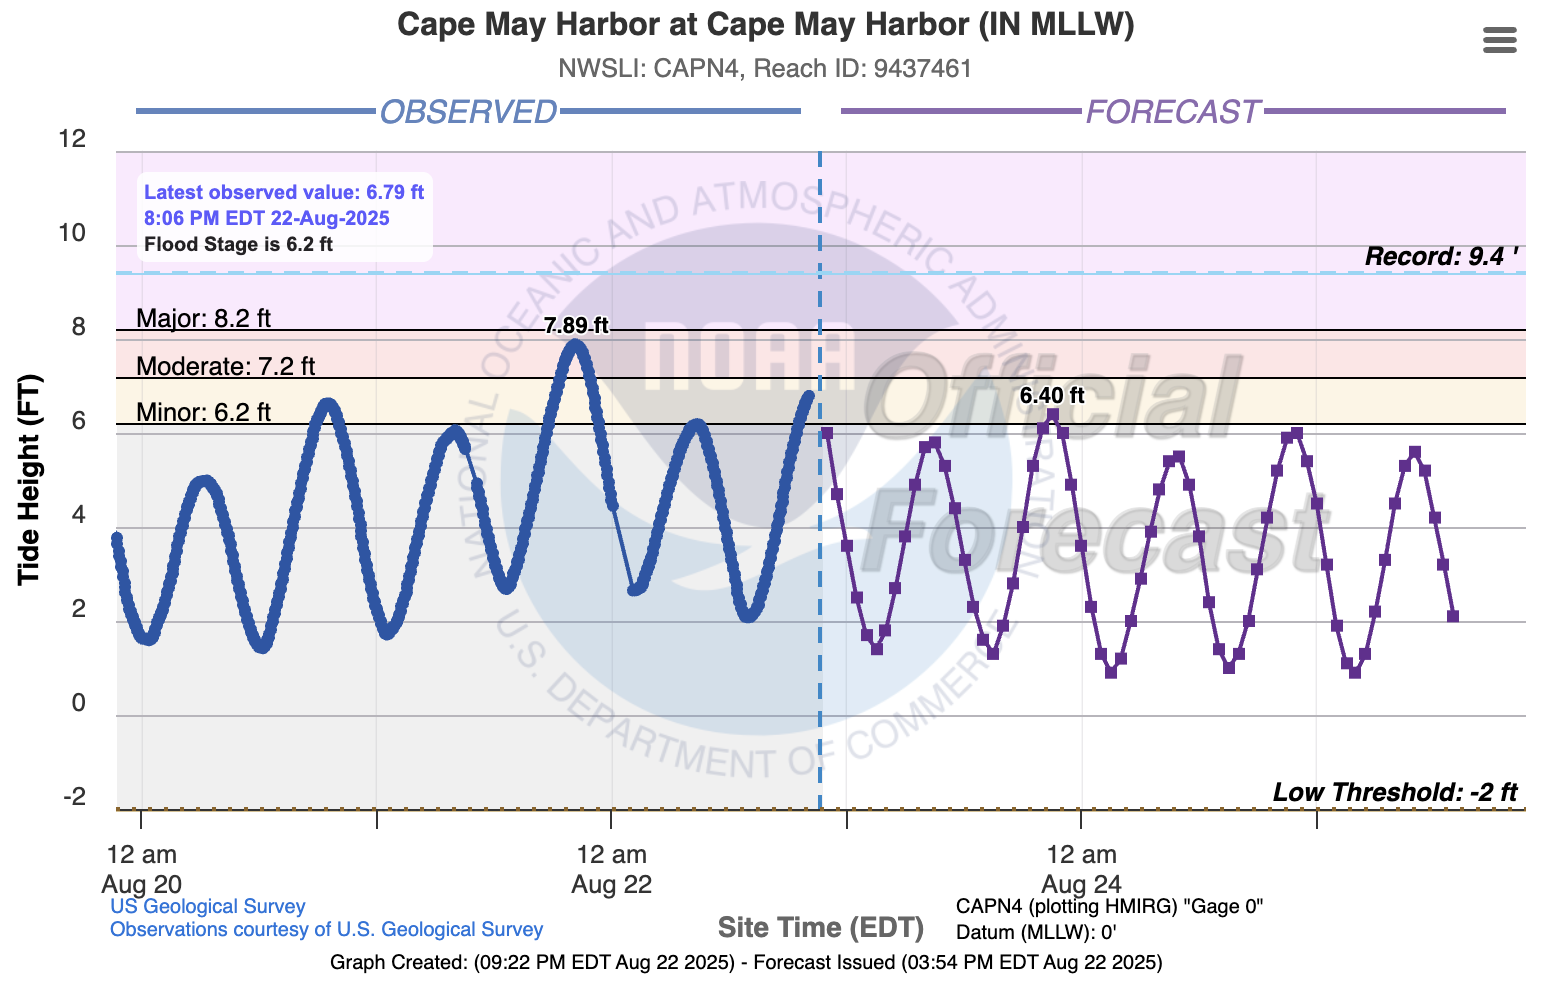
Figure 7. Tidal fluctuations (blue line) from 9:22 PM August 19th to 9:22 PM August 22nd at the Cape May Harbor gage. Purple line shows forecast fluctuations for the following days. Courtesy of the US Geological Survey and NOAA.
Highest barometric pressures in August were in the 30.35”–30.45” range on the 6th and 7th. Lowest pressures were from 29.75”–29.85” on the 25th. The three days with 40-mph gusts at one or more of the 69 NJWxNet stations were mentioned previously.
The last US Drought Monitor weekly map of August (valid August 26th) indicates that Moderate Drought (D1) has developed across a portion of northern NJ, surrounded by Abnormally Dry (D0) conditions that also have emerged in a portion of central NJ and two isolated areas in the south. D1 conditions have an expected recurrence interval of approximately 6–10 years and D0 every 3–5 years.
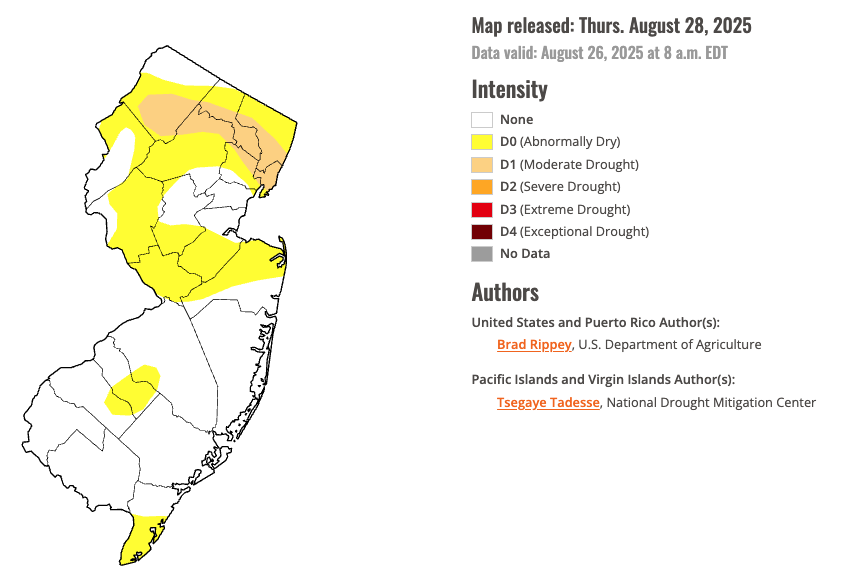
Figure 8. U.S. Drought Monitor map of conditions in NJ as of August 26th (National Drought Mitigation Center).
Temperature
All but one of the nine August days when multiple NJWxNet stations crested above 90° occurred during a stretch from the 10th to 17th. Earlier, on the 4th, West Deptford (Gloucester) reached 92° and Piney Hollow (Gloucester) 90°. The 10th found Haworth (Bergen) at 92° and eight stations either 90° or 91°. Five locations reached 94° and 31 sites from 90°–93° on the 12th. Harvey Cedars was coolest at 79°. Walpack (Sussex) was one of the stations making it to 94°, while the low that day of 52° at this northwest valley location was the coolest in the state. Meanwhile, along Delaware Bay, Fortescue (Cumberland) had NJ’s second lowest high of 81° following the state’s warmest morning low of 73°, thus a 42° diurnal range at Walpack and only 8° at Fortescue. The heat continued on the 13th, with Hopewell Township (Mercer) and Pennsauken (Camden) at 95° and 34 sites from 90°–94°. Lower Alloways Creek Township made it to 93° on the 14th, with 26 sites from 90°–92°. Lower Alloways shared warmest honors with West Deptford at 92° on the 15th, with 19 sites either 90° or 91°. That day and the following one found Harvey Cedars with identical highs of 79° and lows of 75°, Pennsauken up to 92° on the 16th, and just seven stations at 90° or 91°. The last day of the hot spell, the 17th, was warmest of all this month. Three locations reached 95° and 45 stations hit 90°–94° (Figure 9). Atlantic City Marina was least hot at 82°.
The diurnal range at Harvey Cedars was almost nonexistent on the 19th with a high of 72° and low of 70°. This compared to Walpack’s 81°–51° range. As cool air moved into NJ, the High Point Monument (Sussex) maximum on the 20th only made it to 59° (a state minimum high temperature for the month), while the daily low of 51° was NJ’s coolest.
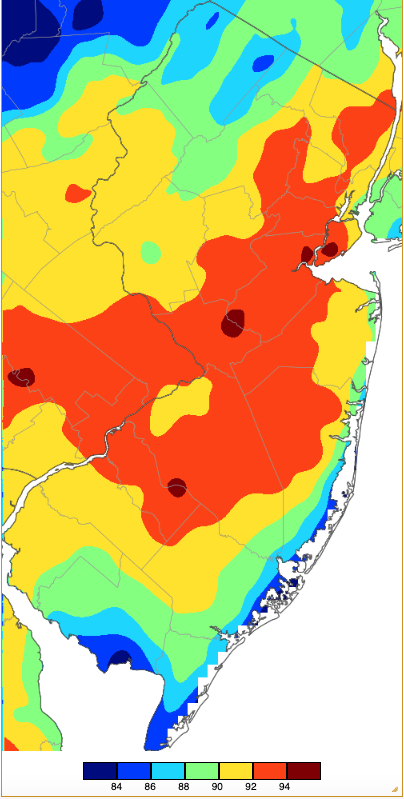
Figure 9. Maximum temperatures on August 17th based on a PRISM (Oregon State University) analysis generated using NWS, NJWxNet, and other professional weather stations. Note the 2° scale beneath the map.
The cooler-than-normal August brought 12 days with lows below 50° at one or more NJWxNet station. Early on, the 3rd saw Sandyston (Sussex) drop to 48° and Pequest (Warren) 49°. Walpack and Sandyston cooled to 49° on the 4th. Next up, the 9th found Walpack at 46° and eight sites 48° or 49°. Three locations reached 49° on the 10th. Following the hot spell, 40°s returned for lows on eight of the final ten days of August. This started off on the 22nd when Sandyston fell to 46°, Hackettstown (Warren) 47°, and three sites at 49°. Hopewell Township was 49° on the 23rd. Walpack reached 45° on the 26th, with five sites 47°–49°. Walpack was again coolest at 43° on the 27th, with Pequest 44° and seven locations 45°–49°. The 28th found Sandyston, Hopewell Township, and Walpack at 42°, seven stations from 43°–45°, and 23 from 46°–49°. The warmest NJWxNet station that morning was Atlantic City Marina at 64°. Walpack was 47° on the 29th. On the 30th, Walpack recorded the first NJ low in the 30°s since June 2nd, falling to 39°. Pequest and Sandyston were at 41°, eight sites 42°–45°, and 20 from 46°–49°. The final day of August just edged out the 28th and 30th as the month’s coolest morning. Walpack fell to 37°, Pequest and Sandyston to 40°, seven stations from 42°–45°, and 23 from 46°–49° (Figure 10). Harvey Cedars was mildest with a low of 61°.
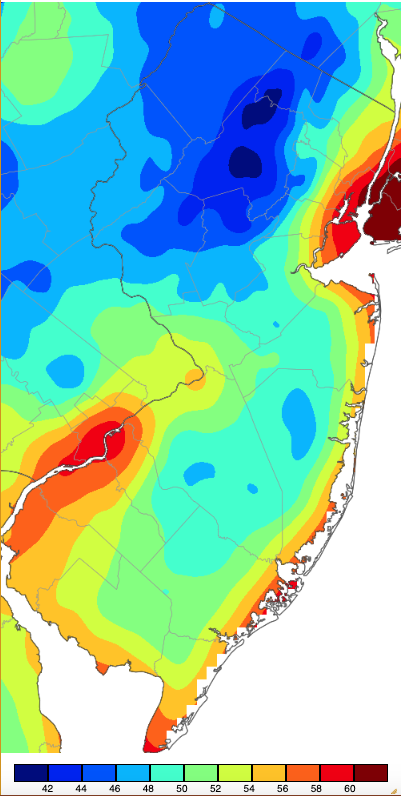
Figure 10. Minimum temperatures on August 31st based on a PRISM (Oregon State University) analysis generated using NWS, NJWxNet, and other professional weather stations.
Summer 2025 Overview
Statewide summer precipitation averaged 10.22". This was 3.36" below the 1991–2020 normal and ranks as the 28th driest of the past 131 summers. Not surprisingly, the map of summer precipitation (Figure 11) finds the driest areas closely aligned with the end-of-August Drought Monitor depiction of the driest NJ conditions (see Figure 8). Several localized deluges appear as prominent wettest locations on the summer map. This includes the July 14 deadly, damaging flash flood event where Union-Somerset-Middlesex converge, the July 1–2 downpours near the Monmouth-Ocean border, the southern Ocean and Burlington border soaker on July 31st, and the western Burlington deluge on August 17th.
The northern division averaged 9.80” for the summer, which was 4.09” below normal and ranks 23rd driest. Meanwhile, the south averaged 10.51”, which was 2.94” below normal and ranks 33rd driest. The coast averaged 10.38”, which was 2.45” below normal and ranks 38th driest.
The highest summer totals at CoCoRaHS locations included 18.44” and 15.63” at two Long Hill Township (Morris) stations, New Providence (Union) 17.79”, Howell Township (Monmouth) 17.42”, Jackson Township (Ocean) 16.75”, Mount Laurel Township (Burlington) 16.11”, Willingboro Township (Burlington) 15.05”, Manasquan (Monmouth) 14.92”, and Stafford Township (Ocean) 14.23”. On the short end, Glen Rock (Bergen) only picked up 6.23” over the three months. This was followed by Lyndhurst Township (Bergen) at 6.48”, Wayne Township (Passaic) 6.57”, Franklin (Sussex) 6.88”, Randolph Township (Morris) 6.95”, Califon (Hunterdon) at 7.17”, Hardyston Township (Sussex) 7.29”, Little Falls (Passaic) 7.37”, Mantua Township (Gloucester) 7.43”, Jefferson Township (Morris) 7.49”, and Evesham Township (Burlington) 7.49”. Remarkably, the Mount Laurel and Evesham Township stations in Burlington County are approximately 4 miles apart yet came in among the wettest and driest NJ summer locations with totals differing by 8.62”.
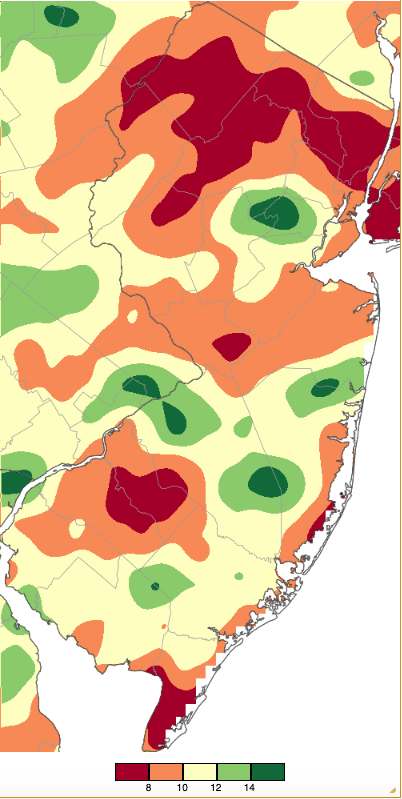
Figure 11. Summer 2025 precipitation across New Jersey from 8 AM on May 31st through 8 AM August 31st based on a PRISM (Oregon State University) analysis generated using generated using NWS Cooperative and CoCoRaHS observations.
This summer started on the warmer-than-normal side, with June the 9th warmest dating back to 1895 and July 6th warmest. However, the cool August, at 37th coolest, put the brakes on the chance of this summer coming in at or close to warmest on record, something commonly seen in recent summers. Instead, the 73.6° statewide summer average was 0.5° above the 1991–2020 normal and ranked as the 16th warmest on record. Despite this ranking being 13 spots behind 2024’s summer ranking of 3rd warmest, each had 48 days where one or more Rutgers NJ Weather Network station was 90° or hotter (three of the 2024 days occurred in May). Figure 12 depicts the hottest temperatures across the state at some point (not all occurring on the same day) this summer. Most of the summer highs were reached on June 24th, when Hammonton (Atlantic), Toms River (Ocean), Woodland Township (Burlington), and Newark Airport (Union) baked at 103° and 34 NJWxNet stations reached 100°–102°.
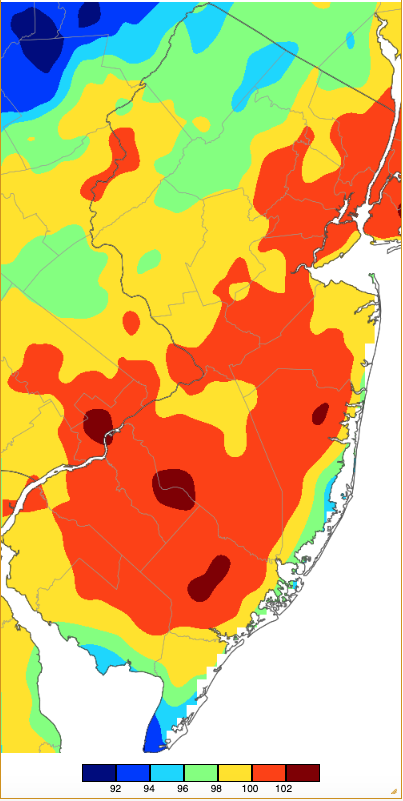
Figure 12. Extreme maximum temperatures during summer 2025 (June 1st–August 31st) based on a PRISM (Oregon State University) analysis generated using NWS, NJWxNet, and other professional weather stations. The seasonal maximum occurred on different days at different locations.
Summer lows are shown in Figure 13. The summer kicked off with some cool mornings bookended by cool mornings to close out August. All told, there were three summer days when a station fell into the upper 30°s and 15 days when a low of 40°–49° was observed.
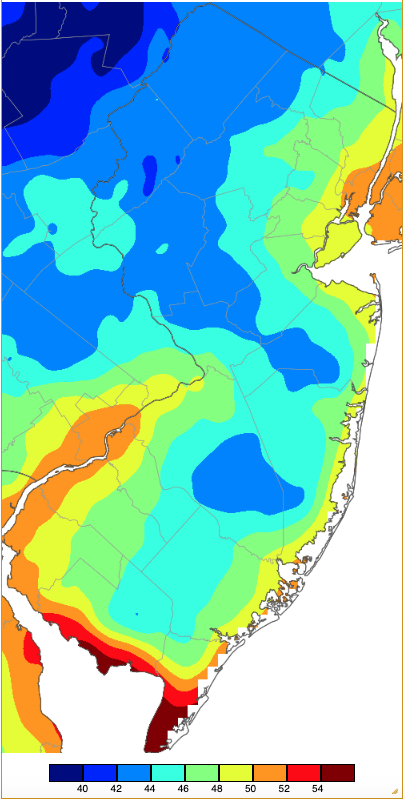
Figure 13. Extreme minimum temperatures during summer 2025 (June 1st–August 31st) based on a PRISM (Oregon State University) analysis generated using NWS, NJWxNet, and other professional weather stations. The seasonal minimums occurred on different days at different locations.
Looking divisionally, the north averaged 72.1° for the summer. This was 0.7° above normal and ranks 16th warmest on record. The south averaged 74.5°, which was 0.4° above normal and ranks 17th warmest. The coast averaged 74.3°, which was 0.5° above normal and ranks 15th warmest.


