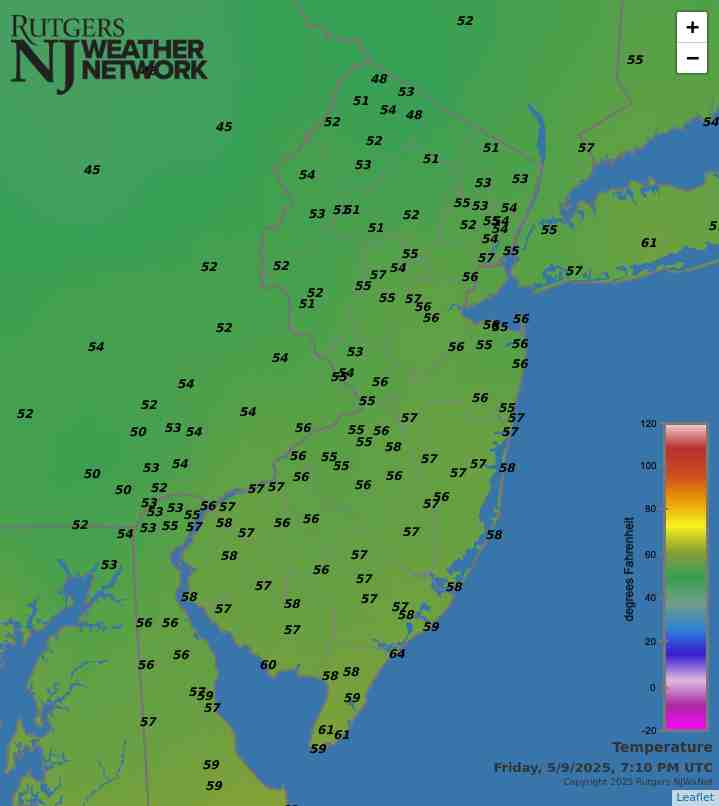
Latest Temperatures

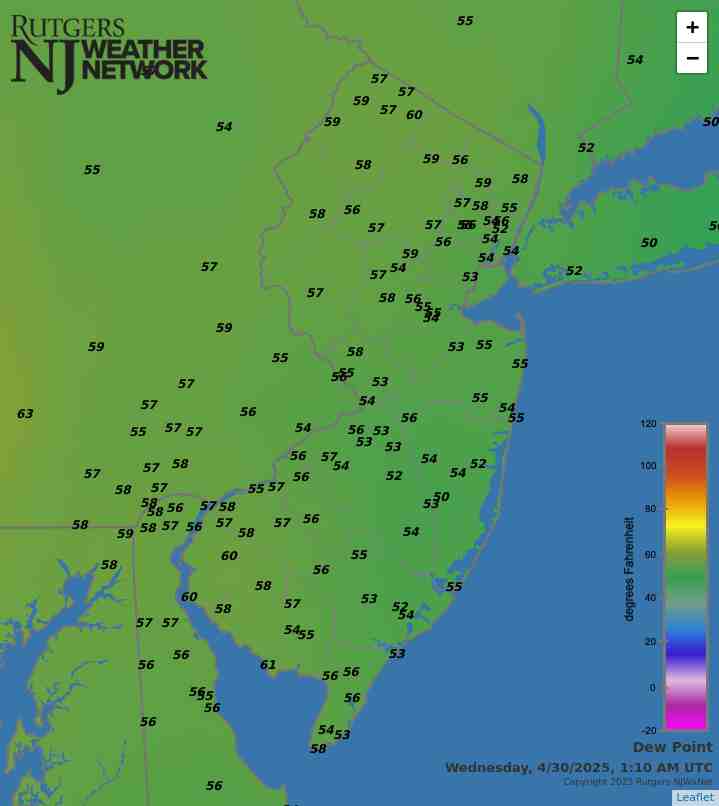
Current Dew Point

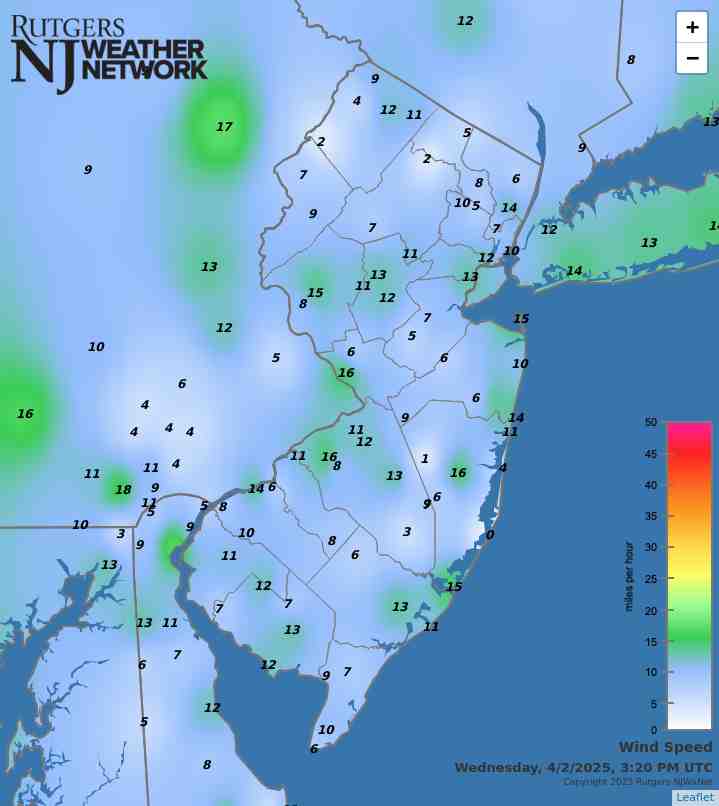
Latest Wind Speeds

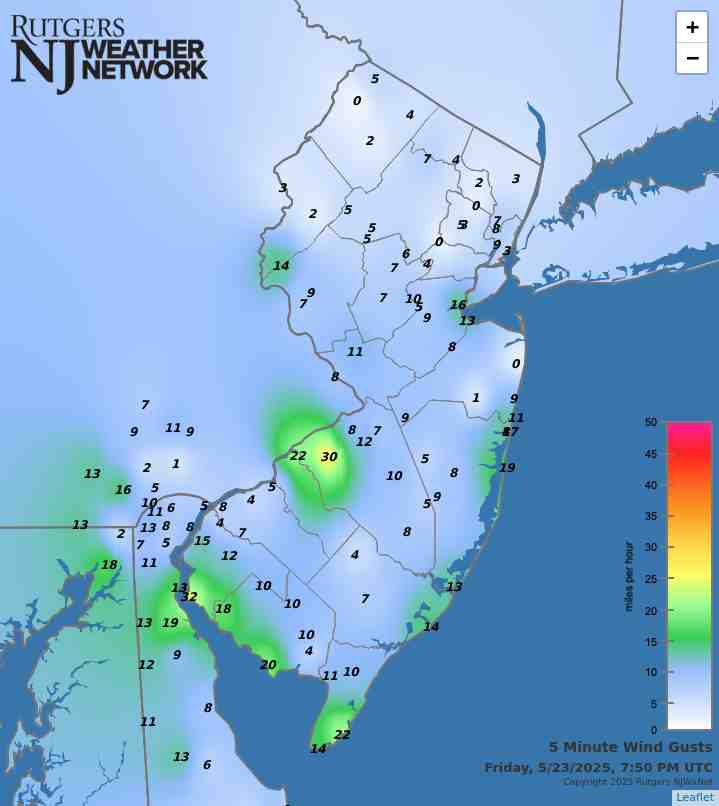
Wind Gusts

Top Story

Firefighters battle the Jones Road Wildfire in Ocean County (photo courtesy of the New Jersey Department of Environmental Protection).

If it is weather variety you enjoy, April certainly must have proved rather satisfying. Atmospherically, this was expressed by a cool, wet first half of the month and a warm, dry second half. When all was totaled and averaged, the full month emerged with above-normal temperatures and close-to-normal precipitation. Toss in one northern snow event, considerable wind, lingering drought in some areas, and a major Pinelands wildfire, and there was quite a potpourri of conditions.

Looking first at precipitation, the statewide average of rain and melted snowfall was 3.72”. This was 0.02” above the 1991–2020 normal and ranked as the 62nd wettest April dating back to the start of statewide records in 1895.

April snowfall occurred in a single event that will be discussed below. This resulted in a statewide average of 0.3”, which is 0.2” below normal and ranks as the 37th snowiest April back to 1895. The northern snow division averaged 1.2” (+0.4”, 28th snowiest), while the central and southern divisions did not record snowfall (0.6” and 0.4” below normal, respectively), situations that have occurred during numerous past Aprils.

The statewide monthly average temperature was 53.3°. This was 1.8° above the 30-year mean and ranked as the 12th mildest (3-way tie). Nine of the 16 mildest Aprils in the past 131 years have occurred over the past 23 years.

Latest Extremes

City, State Temp
Harvey Cedars, NJ 58
Atlantic City Marina, NJ 58
Seaside Heights, NJ 58
Cape May Court House, NJ 58
Egg Harbor Twp., NJ 57
City, State Temp
High Point Monument, NJ 46
Blue Mountain Lakes, NJ 47
Vernon Twp., NJ 47
High Point, NJ 48
Wantage, NJ 49
most current information as of May 9 8:20 PM

Latest Conditions & Forecast

New Brunswick, NJ

Rutgers University Meteorology Program

55°F

Wind

7 mph from the WNW

Wind Gust

13 mph from the WNW

Chance Showers
48 °F
Becoming Sunny
71 °F
Mostly Clear
51 °F
Sunny
75 °F
Mostly Clear
49 °F
Sunny
77 °F
Partly Cloudy
55 °F
Mostly Cloudy
76 °F
Chance Showers
61 °F
Showers Likely
73 °F
Chance Showers
61 °F
Chance Showers
78 °F
Mostly Cloudy
63 °F
Partly Sunny then Chance Showers
83 °F

Tonight

A chance of showers, mainly before 9pm. Mostly cloudy, with a low around 48. West wind 5 to 10 mph, with gusts as high as 20 mph. Chance of precipitation is 30%. New precipitation amounts of less than a tenth of an inch possible.

Saturday

Partly sunny, then gradually becoming sunny, with a high near 71. Northwest wind around 15 mph, with gusts as high as 30 mph.

Saturday Night

Mostly clear, with a low around 51. Northwest wind around 5 mph becoming calm in the evening.

Sunday

Sunny, with a high near 75. Northwest wind around 5 mph.

Sunday Night

Mostly clear, with a low around 49. Calm wind.

Monday

Sunny, with a high near 77.

Monday Night

Partly cloudy, with a low around 55.

Tuesday

Mostly cloudy, with a high near 76.

Tuesday Night

A chance of showers after 8pm. Cloudy, with a low around 61. Chance of precipitation is 50%.

Wednesday

Showers likely, mainly before 2pm. Cloudy, with a high near 73. Chance of precipitation is 60%.

Wednesday Night

A chance of showers. Cloudy, with a low around 61. Chance of precipitation is 50%.

Thursday

A chance of showers. Mostly cloudy, with a high near 78. Chance of precipitation is 40%.

Thursday Night

Mostly cloudy, with a low around 63.

Friday

A chance of showers. Partly sunny, with a high near 83. Chance of precipitation is 30%.

Search by zipcode or city/state for the latest conditions, forecasts, graphs, maps and more nearest to you.

More News

A Robin signals the arrival of spring in Hawthorne (Passaic County) on March 20th. Photo by Judy Kopitar.

Some Marches in past years have kept you guessing when, sometimes even if, spring will arrive. That certainly was not the case this year, nor, for that matter, has it been much so in recent years. With a statewide ranking of tenth warmest, March 2025 was the fourth of the past ten years to rank in the top ten. Eight of the sixteen mildest Marches in the past 131 years have occurred since 2000. Not even a late-season snow event occurred to temporarily stifle spring fever, as no measurable snow was observed anywhere in the state. Spring showers arrived and were plentiful enough to approach...

A blowout tide caused by strong westerly winds on February 18th in Brick Township (Ocean County).

Upon updating a weather friend regarding February conditions that transpired while they were away from the region, he remarked that most of what I reported appeared to have been more along the line of nuisances, while nothing of a blockbuster status occurred. I agreed, as while there were a few plowable events, one soaker (freezing rain at higher elevations), some cold and mild days, and (like in January) quite a few windy days, precipitation and temperatures came in close to normal and not much occurred that will leave lasting memories. In many respects, this applies to the entire winter...

Ice boating on the Navesink River (Monmouth County) on January 24th.

The first month of 2025 was cold, dry, and windy. It was the coldest January since 2014, one of the driest of the past 131 years, dew points dropped below zero or into the single digits on 23 days, and winds gusted to 40 mph or higher on 16 days. No doubt, a profitable outcome for those in the lip balm business! Statewide, precipitation (rain and melted snow) averaged 0.89”. This was 2.60” below the 1991–2020 normal and ranked as the 3rd driest since records commenced in 1895. Quite a difference from last year, when January 2024 came in with 6.20”, the 7th greatest total on record. While...

More News

Another Dry Spring Month: April 2016 Recap

May 9, 2016 - 11:18am -- Dave Robinson

Brush fire photo

April continued a dry period that began in March. Monthly rain and melted snow totaled 2.34”. This was 1.72” below the 1981–2010 normal and ranks as the 20th driest April since 1895. The 4.35” March–April total was 3.94” below average and ranks as the 7th driest such interval. Unlike the abnormal warmth of March, the average April temperature of 50.7° was 0.5° below normal. This ranks as the 48th mildest on record.

Statewide snowfall averaged 0.2”, which is 0.7” below the 1981–2010 mean. The southern counties averaged 0.3” (-0.3”), central 0.0” (-0.9”), and the north 0.2” (-1.2”). The 2015–16 snow season ended with a statewide average of 28.0”. This is 4.3” above the 1981–2010 average and 1.8” above the 1895–2016 average. The north was least snowy with 26.5” (-6.5”), the central snowiest at 31.0” (+4.3”), and the south with 27.4” averaged 9.8” above normal. The January blizzard provided the bulk of the snow, well over 75% of the winter total in some locations.

Spring Warmth Arrives Early: March 2016 Recap

April 4, 2016 - 7:53pm -- Dave Robinson

Mild and dry conditions prevailed throughout the Garden State during most of March. This included record-breaking early-season warmth, only one event that dropped more than an inch of rain over multiple locations, and a few minor forest fires. There were also two episodes of measurable snow that focused on coastal counties and 11 days where winds gusted to 40 mph or higher somewhere in the state. The statewide average temperature of 46.7° was 5.6° above the 1981–2010 average. This ranks as the 6th mildest March since 1895. Precipitation averaged 2.09”. This is 2.14” below normal and ranks as the 13th driest March.

March snowfall average 2.4” across the state, which is 1.9” below average. Northern counties saw only 0.8”, which is 5.3” below normal, while the central portion of the state received 1.6” (3.3” below normal). The southern counties were the winners, averaging 0.7” above normal at 3.7”. While snow may fall in April (the morning of April 3rd saw 2.7” at Highland Lakes [Sussex County]), a look at what are likely close to the final seasonal totals includes a statewide average of 27.9”, which is 1.8” above normal. North Jersey took it on the chin, with an average of 26.3”, some 8.4” below average. Central NJ was the winner at 31.0”, 4.0” above normal. Meanwhile the south Jersey total of 27.1” exceeded that of the north, even in an absolute sense, and was 7.1” above normal.

Volatility Reigns: February 2016 and 2015/2016 Winter Recaps

March 7, 2016 - 7:10pm -- Dave Robinson

Fire photo/radar combo graphic

Much like this past January, the second month of 2016 had considerable swings and occasional extremes in temperature and precipitation. This included a brief, exceedingly cold mid-month outbreak with subzero wind chills and a late-month evening with severe thunderstorms bringing strong winds, hail, and flash flooding across NJ. A key indicator of the volatile weather pattern was the wind, which on 13 days gusted to 40 mph or higher somewhere in the state, with five of these days gusting to at least 50 mph. The statewide average temperature was 35.6°, which is 1.8° above the 1981–2010 normal. This ranks as the 19th mildest February since 1895. Precipitation (rain and melted snow) averaged 4.21”. This is 1.35” above normal and ranks as the 24th wettest. Snowfall was below normal, with a statewide average of 5.1”. This is 3.0” below normal and ranks as the 52nd least snowy of the past 122 Februaries. Northern counties tallied only 4.6” (-5.5”), the central region 6.3” (-2.7”), and the south 4.7” (-1.9”).

What Can NJ Expect from El Niño Going into Spring?

March 1, 2016 - 5:13pm -- Ariel Schabes

Spring temperature anomalies during past strong El Niños.

Following a winter of widely-varying conditions, likely in part due to the influence of the major El Niño event that has been underway since last fall, it is useful to look back at past spring weather in years that, like this year, experienced strong El Niños. While certainly not providing a definitive forecast for what we might see over the next several months, this exercise will provide some insights into what might be seen. Here, much as we have done for summer, fall, and winter we will examine the seven strongest El Niño events since 1950.

Looking first at temperature, March was warmer than average in five of the seven years, while for April and May, temperatures tended to be below to well-below average. In fact, only two of the 14 Aprils and Mays averaged more than a half-degree above average, while nine averaged a degree or more below average.

A Winter Sampler: January 2016 Recap

February 8, 2016 - 10:35am -- Dave Robinson

Snow

While average monthly temperature and precipitation (rain and melted snow) did not vary much from their long term averages, January 2016 certainly had enough of a potpourri of atmospheric conditions to satisfy (or displease) most anyone in the Garden State. Temperatures ranged from 67° to -2°, a storm deposited as much as 2.35" of rain, and a blizzard dumped record-breaking snow in several locations and caused moderate to major flooding, especially in south Jersey coastal communities.

The statewide monthly average temperature of 31.1° was 0.1° below the 1981–2010 normal and ranked as the 66th coldest since 1895. The temperature averaged 16.7° colder than the record-shattering December 2015 warmth. This is not a record for a December to January swing in temperature, nor for several other monthly pairs too, however it ranks among the largest. Precipitation averaged 3.65", which is 0.17" above normal and 44th wettest. Statewide snowfall averaged 20.0". This was 12.1" above normal and ranks as the 7th highest since 1895 and the largest since the record 23.1" total in 2011. The north received 20.4", which is 11.1" above normal and ranks 13th largest for January, 23.1" (+15.3") fell in central NJ, ranking 5th greatest for the month, and the south averaged 18.2" (+12.5") tied for the 4th highest January total.

Baked December 2015 and Annual Summary, Including the Top 10 Events of 2015

January 3, 2016 - 8:25pm -- Dave Robinson

Beach fog

New Jersey residents will long remember the last month of 2015 as one where the grass remained green, weeds grew, and a few blossoms were seen on trees and shrubs. In fact, with an average temperature of 47.8°, it was the mildest December on record by a wide margin based on records dating back to 1895. Five of the 6 mildest Decembers have occurred since 2001. The anomaly of +12.2° exceeds the +11.0° value in January 1932 as the largest positive anomaly of any month on record. The 5.6° difference between this December's average and the second mildest in 2006 is by far the largest difference between first and second warmest values of any month. The second largest margin is 2.3° between October 2007 and 1971. With 121 years of records, the difference between one ranking and the next is often a tenth to a few tenths of a degree.

December precipitation averaged 4.91" statewide. This is 1.00" above normal and ranks as 27th wettest on record. Snow and sleet fell on one occasion, with light accumulations reported in the north. The statewide 0.1" snowfall average was 5.4" below normal. While certainly on the light side, this is not too out of the ordinary. Seven Decembers since 1895 have failed to see any snow accumulate, and 12 prior Decembers had a statewide average somewhere between 0.1" to 0.5".

ONJSC's Top 10 NJ Weather and Climate Events of 2015

January 1, 2016 - 4:33pm -- Dave Robinson

Listed below is the Office of the NJ State Climatologist’s ranking of the top 10 weather and climate events of 2015. More about each event can be found in the monthly narratives posted on njclimate.org. You might be tempted to rearrange the rankings, particularly as some of the events down the list may have affected you more than others ranked higher. Or perhaps you best recall one that didn’t make the list. That’s the enjoyment (and frustration!) of lists. While there are a variety of events that made the list, the variable that more often than not took center scene in 2015 was the temperature. Be it warm or cold, the thermometer had stories to tell. Unless stated otherwise, observations are based on an average of several dozen stations. The period of record for monthly and annual departures is 1981–2010; while for extremes and rankings it is from 1895–present.

Will the Present Strong El Niño Event Have a Major Impact on New Jersey’s Weather?

December 18, 2015 - 12:24pm -- Ariel Schabes

Roughly every two to seven years, a joint ocean – atmosphere phenomenon known as “El Niño” occurs. Right now happens to be one of those times and this event is showing every indication of being one of the three strongest El Niños of the past 65 years. An El Niño is defined as the prolonged warming of sea surface temperatures (SST) over the central and eastern equatorial Pacific and associated anomalies of atmospheric variables such as winds, clouds, and precipitation. According to the National Oceanic and Atmospheric Administration (NOAA), to be categorized as an El Niño, a 3-month SST anomaly of at least 0.9°F (0.5°C) above average must be observed in the central and eastern equatorial Pacific. There are related atmospheric anomalies elsewhere around the globe that are associated with conditions in the tropical Pacific. Do these anomalies extend to New Jersey, especially during a strong event? This article discusses the current El Niño episode as of mid-December and speculates as to whether NJ is already being impacted by this event and may continue to be into spring 2016.

Unseasonably Mild and Dry: November and Fall 2015 Recaps

December 4, 2015 - 4:11pm -- Dave Robinson

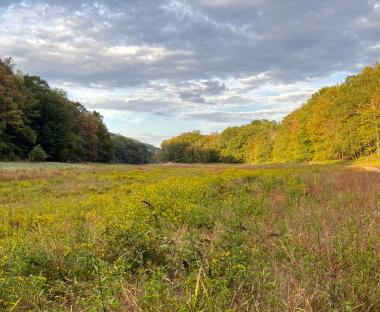
Sunset picture

The climatological fall season ended on a mild note, with the statewide November average temperature of 49.3° coming in at 3.7° above normal. This ranks as the 5th mildest November on record, tied with 1948. Observations go back 121 years to 1895, yet five of the nine warmest Novembers have occurred since 2001. The month had an abundance of sunny days, during what is commonly a rather cloudy time of the year. Precipitation averaged 2.33” across NJ, which is 1.31” below normal and ranks as the 41st driest November. Only two significant rain events occurred during the mid-month interval.

On Average, Rather Average, Bookended by Stormy Conditions: October 2015 Recap

November 6, 2015 - 4:58pm -- Dave Robinson

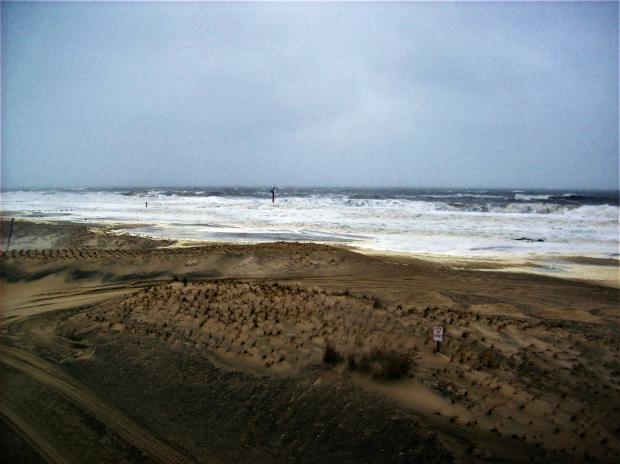
Waves picture

There were many sides to New Jersey’s October 2015 weather, however, when temperature and rainfall observations were averaged, conditions were quite close to long-term (1981–2010) means. The statewide average temperature of 54.4° was 0.4° below normal. This ranked as the 53rd coolest since 1895 (121 years). Precipitation averaged 4.17", which is 0.24" above normal and ranks as 44th wettest. October was bookended by events that dumped the vast majority of the month’s precipitation, with an extended period of very dry weather in between. This led to a continuation of moderate drought in the northeast, with nearby areas remaining abnormally dry. The late-month rain, which for the first time in many months was heaviest over the driest areas, staved off the need for any further drought deterioration, at least for the time being. The major weather event of the month extended over the first five days, when incessant onshore winds generated the worst beach erosion and back bay flooding since Sandy three years ago, though not nearly in the same ballpark of what Sandy wrought.

Pages

Subscribe to Front page feed