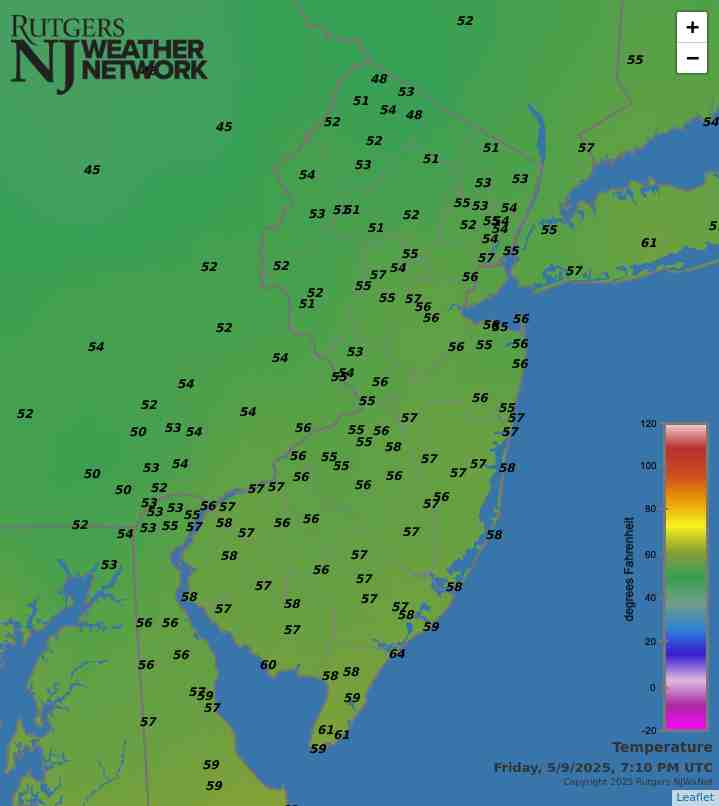
Latest Temperatures

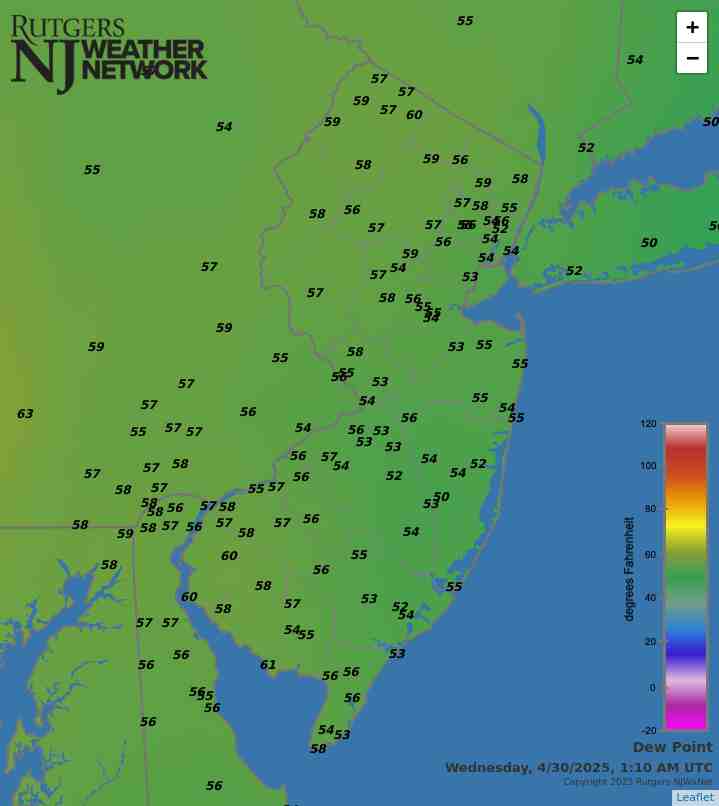
Current Dew Point

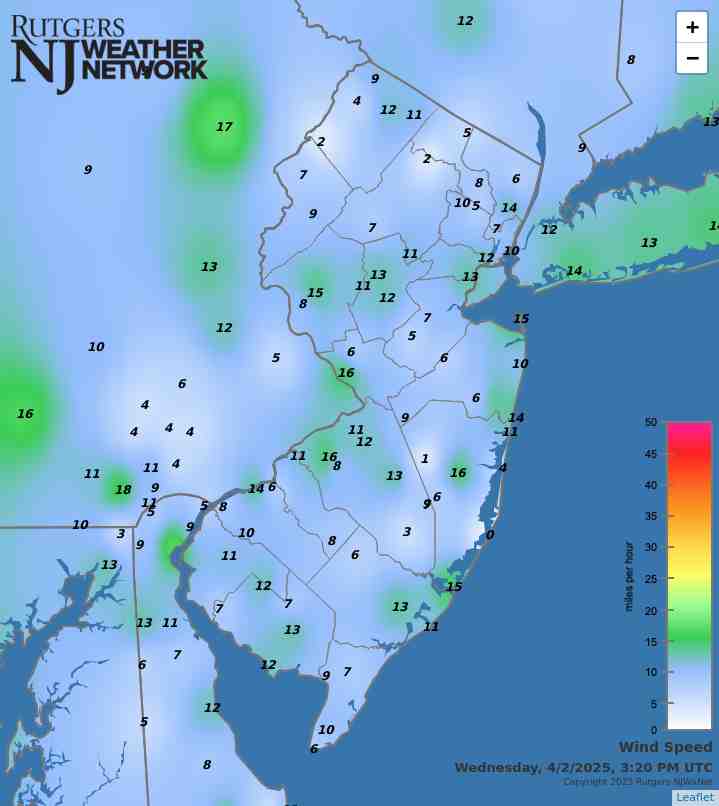
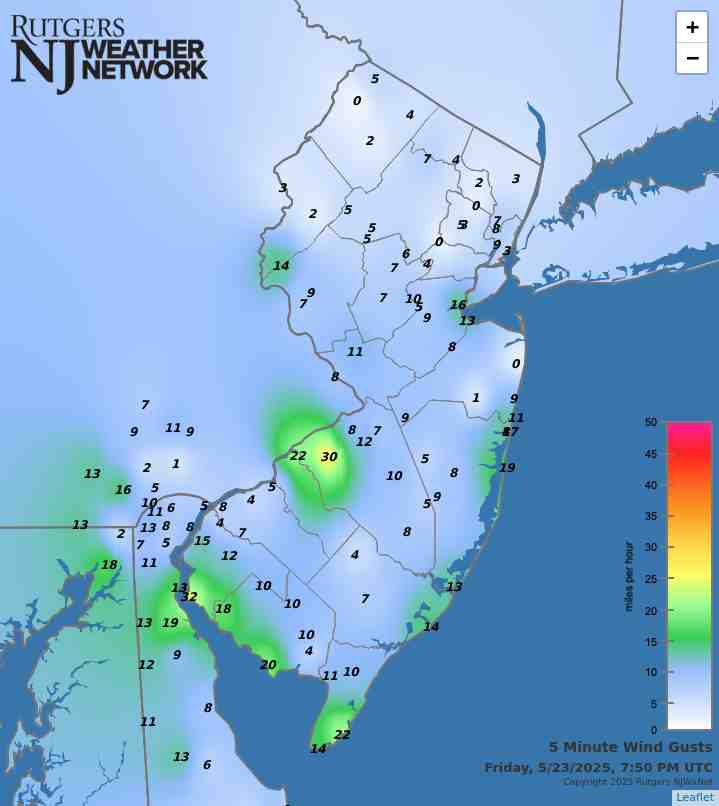
Latest Wind Speeds

Wind Gusts

Top Story

Aurora Borealis as seen from High Point on October 10th, 2024 (photo courtesy of Shawn Viggiano).

New Jersey has transitioned into a worrisome drought situation following historically low October precipitation. So, too, was the September–October combined total a record low. The NJ Department of Environmental Protection issued a Drought Watch on October 17th, serving as a “heads up” that the state had been exceedingly dry for weeks. This continued through the end of the month, one in which, averaged statewide, precipitation totaled only 0.02”. This was 4.17” below the 1991–2020 normal and surpassed October 1963 as the driest October on record. Many gauges failed to collect any measurable precipitation and those that did, at best, saw no more than about 0.10”. The northern climate division averaged 0.03” (-4.42”, driest), southern division 0.01” (-4.02, driest), and coast 0.02” (-4.07”, driest).

This was not a record low precipitation just for October, rather for any month. Seven of the ten driest months since 1895 have occurred in the fall. When warm-season showers and possible late-season tropical systems fail to deliver rain to the Garden State, and early cold-season low pressure systems fail to arrive, extended dry spells may occur. Still, runs of 30 or more days without measurable precipitation are quite rare. Dry streaks at some stations were continuing into November as of the report publication date (November 8th).

October precipitation futility in conjunction with the third driest September on record resulted in the driest of any pairing of consecutive months on record. The 0.80” total was 0.55” lower than the previous record in December 1980–January 1981. The southern half of the state was drier than the north, though both were woefully dry.

Latest Extremes

City, State Temp
Fortescue, NJ 33
Lower Alloways Creek, NJ 33
Mannington Twp., NJ 32
Jersey City, NJ 32
Cape May Court House, NJ 32
City, State Temp
High Point Monument, NJ 22
High Point, NJ 24
Vernon Twp., NJ 25
Cedar Bridge, NJ 26
Woodland Twp., NJ 26
most current information as of Dec 7 5:45 AM

Latest Conditions & Forecast

New Brunswick, NJ

Rutgers University Meteorology Program

31°F

Wind

8 mph from the SW

Wind Gust

10 mph from the WSW

Mostly Sunny
39 °F
Mostly Cloudy
32 °F
Decreasing Clouds
51 °F
Partly Cloudy
30 °F
Chance Rain then Rain
50 °F
Chance Showers
41 °F
Mostly Cloudy then Chance Rain
54 °F
Rain
45 °F
Rain
59 °F
Chance Rain
29 °F
Sunny
39 °F
Partly Cloudy
23 °F
Mostly Sunny
39 °F

Today

Mostly sunny, with a high near 39. West wind around 10 mph, with gusts as high as 20 mph.

Tonight

Mostly cloudy, with a low around 32. Southwest wind around 5 mph.

Sunday

Mostly cloudy, then gradually becoming sunny, with a high near 51. West wind 5 to 15 mph.

Sunday Night

Partly cloudy, with a low around 30. West wind around 5 mph becoming calm in the evening.

Monday

Rain, mainly after 1pm. High near 50. Calm wind becoming southeast around 5 mph in the afternoon. Chance of precipitation is 100%. New precipitation amounts between a quarter and half of an inch possible.

Monday Night

A chance of showers before 1am. Mostly cloudy, with a low around 41. Chance of precipitation is 40%. New precipitation amounts of less than a tenth of an inch possible.

Tuesday

A chance of rain after 1pm. Mostly cloudy, with a high near 54. Chance of precipitation is 40%.

Tuesday Night

Rain. Low around 45. Chance of precipitation is 90%.

Wednesday

Rain. High near 59. Chance of precipitation is 90%.

Wednesday Night

A chance of rain before 1am. Mostly cloudy, with a low around 29. Chance of precipitation is 40%.

Thursday

Sunny, with a high near 39.

Thursday Night

Partly cloudy, with a low around 23.

Friday

Mostly sunny, with a high near 39.

Search by zipcode or city/state for the latest conditions, forecasts, graphs, maps and more nearest to you.

More News

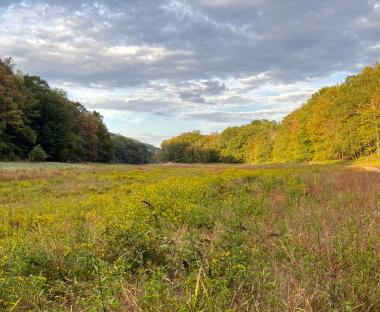
Marine fog shrouds the Brigantine Bridge that connects Atlantic City and Brigantine (Atlantic County) on September 28th (photo courtesy of Chris Stachelski).

Perhaps the title for this month’s report has captured your attention. Hope so, because while September was a rather quiet month weather-wise for New Jersey, it certainly was an unusual one. As many of you reading this report know, the prevailing winds across the middle latitudes, including New Jersey, tend to be westerlies, comprised of winds blowing from west to east. However, an unusually persistent atmospheric pattern this past month resulted in easterly winds most often blowing across the state. This led to minor coastal flooding, rip currents, and foggy conditions along the coast, and...

Low-lying fog blankets a farm field in Sparta Township (Sussex County) on the morning of August 16th (photo courtesy of Nick Stefano).

While it is exceedingly rare to see monthly or seasonal temperature departures from normal differ in sign or even notable magnitude between southern and northern portions of New Jersey, such is not always the case for precipitation. This August and summer as a whole exemplify such disparities. While rain was often plentiful in the north, more often than not, the south did not see gauges fill as much or as often. This report will first address August conditions in the Garden State, finishing with a recap of climatological summer (June–August). August precipitation averaged 6.52” across NJ...

A smoke plume from the early July Tea Time Hill fire in Wharton State Forest (photo courtesy of the NJ Forest Fire Service).

Yet another warmer-than-normal July is in the books. This first sentence is just how last July’s report began. With a statewide average temperature of 77.9°, July 2024 ranked as the 7th warmest since records commenced in 1895. It was 2.5° above the 1991–2010 normal. The average high of 87.8° was 2.1° above normal, ranking 10th warmest. The average low of 68.0° was 2.9° above normal, ranking 3rd warmest. Eight of the ten warmest Julys have occurred since 2010 and ten of fifteen since 1999. Only three Julys in the past 25 years have averaged below the 1991–2010 normal. The June-July average...

More News

A Return to Hot Julys After a Two-Year Respite; Awfully Wet Too: July 2016 Recap

August 3, 2016 - 5:01pm -- Dave Robinson

Flooding photo

The second half of the 2016 NJ weather and climate year began with plenty to talk about. Maximum temperatures were 90° or higher somewhere in the state on 20 afternoons. This, along with many warm nights, helped boost the mean monthly temperature into the top 10, based on statewide records back to 1895. Yet, remarkably, this was only NJ’s 5th warmest July in the past 11 years. The 77.2° mean was 2.2° above the 1981–2010 average.

On 15 July days an inch or more of rain fell somewhere in NJ. This included eight days with greater than 2” in spots and four days where a few locations exceeded 4”. Statewide, the average rainfall was 6.85”. This was 2.33” above average and ranks as the 14th wettest July since 1895. It was the wettest July since 2004, and the 4th wettest in the past 41 years. The northern half of the state (Mercer/Somerset/Union northward) averaged 7.27” (+2.49”, 14th wettest), while the southern region averaged 6.77” (+2.38”, 12th wettest). This all came in a month where the northern half of the state remained classified as being in moderate drought (D1) on the US Drought Monitor, with about half of south Jersey considered abnormally dry (D0). Also, on July 26th the NJ Department of Environmental Protection placed the northern half of the state in a drought watch. These actions were the result of notable rainfall deficits dating back to the early spring, with the warmth of the month exasperating low soil moisture, stream flow, ground water, and reservoir conditions. Clearly, the late-month heavy rainfall in a good portion of the state warrants a re-evaluation of drought status as NJ heads into August.

Rather Dry, but Still Some Storms: June 2016 Recap

July 6, 2016 - 1:58pm -- Dave Robinson

Tipped helicopter

Despite some damaging storms impacting portions of New Jersey on several days and some localized deluges near month’s end, June rainfall came in well below average. The statewide average of 2.36” was 1.66” below the 1981–2010 average. This ranks as the 20th driest June since 1895. Northern and central counties were generally drier than those to the south. At month’s end, the counties from Hunterdon, Somerset, and northern Middlesex northward were classified as being in “moderate drought,” the D1 category on the US Drought Monitor. The counties to the south, through Ocean and Burlington, were in the Monitor’s “abnormally dry” D0 category. June stream flow, ground water, and precipitation levels were all well below average, while reservoir capacities in the north began to dip below average near the end of the month.

Temperatures began on the cool side, but the second half of the month was warm enough to bring the statewide average June temperature to 70.6°, which was 0.5° above average. This ranks as the 30th mildest June on record. There was one minimal heat wave at some inland lower-elevation locations, where temperatures climbed to 90° or higher from the 19th–22nd. However, no location exceeded 93° this month. The dry conditions helped to rid the atmosphere of the previous day’s warmth during the nighttime hours, thus temperatures of 45° or lower were observed in spots on seven mornings.

A Tale of Multiple Seasons Within a Month and an Almost Backward Spring: May and Spring 2016 Recaps

June 7, 2016 - 4:54pm -- Dave Robinson

May 15 graupel photo

May had many weather faces. Cool, damp weeks to start things off, a blustery mid-month day with some frozen precipitation, a week of summer heat, and an early Memorial Day deluge up the New Jersey Turnpike corridor. When all was summed and averaged, the mean monthly statewide temperature came in at 60.0°. This was 0.8° below normal and ranked as the 55th coolest of the past 122 Mays. Precipitation averaged 5.01”, which is 1.01” above average and 23rd wettest.

Rain fell on a number of May days across NJ, keeping vegetation green and fire danger down. It was most plentiful in the southern half of the state, where Mount Laurel Township (Burlington County) totaled 7.74”. This was followed by Mount Ephraim (Camden) with 7.68”, Washington Township (Gloucester) 7.54”, Salem (Salem) 7.41”, Cinnaminson (Burlington) 7.02”, and Estell Manor (Atlantic) and Merchantville (Camden) each with 7.00”. The northwest corner had the least rainfall in May, with just 3.01” in Andover (Sussex) and North Arlington (Bergen), along with Mount Olive (Morris) at 3.04”, Hackettstown (Warren) 3.05”, and Franklin (Sussex) and Wantage (Sussex) each with 3.06”.

Another Dry Spring Month: April 2016 Recap

May 9, 2016 - 11:18am -- Dave Robinson

Brush fire photo

April continued a dry period that began in March. Monthly rain and melted snow totaled 2.34”. This was 1.72” below the 1981–2010 normal and ranks as the 20th driest April since 1895. The 4.35” March–April total was 3.94” below average and ranks as the 7th driest such interval. Unlike the abnormal warmth of March, the average April temperature of 50.7° was 0.5° below normal. This ranks as the 48th mildest on record.

Statewide snowfall averaged 0.2”, which is 0.7” below the 1981–2010 mean. The southern counties averaged 0.3” (-0.3”), central 0.0” (-0.9”), and the north 0.2” (-1.2”). The 2015–16 snow season ended with a statewide average of 28.0”. This is 4.3” above the 1981–2010 average and 1.8” above the 1895–2016 average. The north was least snowy with 26.5” (-6.5”), the central snowiest at 31.0” (+4.3”), and the south with 27.4” averaged 9.8” above normal. The January blizzard provided the bulk of the snow, well over 75% of the winter total in some locations.

Spring Warmth Arrives Early: March 2016 Recap

April 4, 2016 - 7:53pm -- Dave Robinson

Mild and dry conditions prevailed throughout the Garden State during most of March. This included record-breaking early-season warmth, only one event that dropped more than an inch of rain over multiple locations, and a few minor forest fires. There were also two episodes of measurable snow that focused on coastal counties and 11 days where winds gusted to 40 mph or higher somewhere in the state. The statewide average temperature of 46.7° was 5.6° above the 1981–2010 average. This ranks as the 6th mildest March since 1895. Precipitation averaged 2.09”. This is 2.14” below normal and ranks as the 13th driest March.

March snowfall average 2.4” across the state, which is 1.9” below average. Northern counties saw only 0.8”, which is 5.3” below normal, while the central portion of the state received 1.6” (3.3” below normal). The southern counties were the winners, averaging 0.7” above normal at 3.7”. While snow may fall in April (the morning of April 3rd saw 2.7” at Highland Lakes [Sussex County]), a look at what are likely close to the final seasonal totals includes a statewide average of 27.9”, which is 1.8” above normal. North Jersey took it on the chin, with an average of 26.3”, some 8.4” below average. Central NJ was the winner at 31.0”, 4.0” above normal. Meanwhile the south Jersey total of 27.1” exceeded that of the north, even in an absolute sense, and was 7.1” above normal.

Volatility Reigns: February 2016 and 2015/2016 Winter Recaps

March 7, 2016 - 7:10pm -- Dave Robinson

Fire photo/radar combo graphic

Much like this past January, the second month of 2016 had considerable swings and occasional extremes in temperature and precipitation. This included a brief, exceedingly cold mid-month outbreak with subzero wind chills and a late-month evening with severe thunderstorms bringing strong winds, hail, and flash flooding across NJ. A key indicator of the volatile weather pattern was the wind, which on 13 days gusted to 40 mph or higher somewhere in the state, with five of these days gusting to at least 50 mph. The statewide average temperature was 35.6°, which is 1.8° above the 1981–2010 normal. This ranks as the 19th mildest February since 1895. Precipitation (rain and melted snow) averaged 4.21”. This is 1.35” above normal and ranks as the 24th wettest. Snowfall was below normal, with a statewide average of 5.1”. This is 3.0” below normal and ranks as the 52nd least snowy of the past 122 Februaries. Northern counties tallied only 4.6” (-5.5”), the central region 6.3” (-2.7”), and the south 4.7” (-1.9”).

What Can NJ Expect from El Niño Going into Spring?

March 1, 2016 - 5:13pm -- Ariel Schabes

Spring temperature anomalies during past strong El Niños.

Following a winter of widely-varying conditions, likely in part due to the influence of the major El Niño event that has been underway since last fall, it is useful to look back at past spring weather in years that, like this year, experienced strong El Niños. While certainly not providing a definitive forecast for what we might see over the next several months, this exercise will provide some insights into what might be seen. Here, much as we have done for summer, fall, and winter we will examine the seven strongest El Niño events since 1950.

Looking first at temperature, March was warmer than average in five of the seven years, while for April and May, temperatures tended to be below to well-below average. In fact, only two of the 14 Aprils and Mays averaged more than a half-degree above average, while nine averaged a degree or more below average.

A Winter Sampler: January 2016 Recap

February 8, 2016 - 10:35am -- Dave Robinson

Snow

While average monthly temperature and precipitation (rain and melted snow) did not vary much from their long term averages, January 2016 certainly had enough of a potpourri of atmospheric conditions to satisfy (or displease) most anyone in the Garden State. Temperatures ranged from 67° to -2°, a storm deposited as much as 2.35" of rain, and a blizzard dumped record-breaking snow in several locations and caused moderate to major flooding, especially in south Jersey coastal communities.

The statewide monthly average temperature of 31.1° was 0.1° below the 1981–2010 normal and ranked as the 66th coldest since 1895. The temperature averaged 16.7° colder than the record-shattering December 2015 warmth. This is not a record for a December to January swing in temperature, nor for several other monthly pairs too, however it ranks among the largest. Precipitation averaged 3.65", which is 0.17" above normal and 44th wettest. Statewide snowfall averaged 20.0". This was 12.1" above normal and ranks as the 7th highest since 1895 and the largest since the record 23.1" total in 2011. The north received 20.4", which is 11.1" above normal and ranks 13th largest for January, 23.1" (+15.3") fell in central NJ, ranking 5th greatest for the month, and the south averaged 18.2" (+12.5") tied for the 4th highest January total.

Baked December 2015 and Annual Summary, Including the Top 10 Events of 2015

January 3, 2016 - 8:25pm -- Dave Robinson

Beach fog

New Jersey residents will long remember the last month of 2015 as one where the grass remained green, weeds grew, and a few blossoms were seen on trees and shrubs. In fact, with an average temperature of 47.8°, it was the mildest December on record by a wide margin based on records dating back to 1895. Five of the 6 mildest Decembers have occurred since 2001. The anomaly of +12.2° exceeds the +11.0° value in January 1932 as the largest positive anomaly of any month on record. The 5.6° difference between this December's average and the second mildest in 2006 is by far the largest difference between first and second warmest values of any month. The second largest margin is 2.3° between October 2007 and 1971. With 121 years of records, the difference between one ranking and the next is often a tenth to a few tenths of a degree.

December precipitation averaged 4.91" statewide. This is 1.00" above normal and ranks as 27th wettest on record. Snow and sleet fell on one occasion, with light accumulations reported in the north. The statewide 0.1" snowfall average was 5.4" below normal. While certainly on the light side, this is not too out of the ordinary. Seven Decembers since 1895 have failed to see any snow accumulate, and 12 prior Decembers had a statewide average somewhere between 0.1" to 0.5".

ONJSC's Top 10 NJ Weather and Climate Events of 2015

January 1, 2016 - 4:33pm -- Dave Robinson

Listed below is the Office of the NJ State Climatologist’s ranking of the top 10 weather and climate events of 2015. More about each event can be found in the monthly narratives posted on njclimate.org. You might be tempted to rearrange the rankings, particularly as some of the events down the list may have affected you more than others ranked higher. Or perhaps you best recall one that didn’t make the list. That’s the enjoyment (and frustration!) of lists. While there are a variety of events that made the list, the variable that more often than not took center scene in 2015 was the temperature. Be it warm or cold, the thermometer had stories to tell. Unless stated otherwise, observations are based on an average of several dozen stations. The period of record for monthly and annual departures is 1981–2010; while for extremes and rankings it is from 1895–present.

Pages

Subscribe to Front page feed