August Overview
While it is exceedingly rare to see monthly or seasonal temperature departures from normal differ in sign or even notable magnitude between southern and northern portions of New Jersey, such is not always the case for precipitation. This August and summer as a whole exemplify such disparities. While rain was often plentiful in the north, more often than not, the south did not see gauges fill as much or as often. This report will first address August conditions in the Garden State, finishing with a recap of climatological summer (June–August).
August precipitation averaged 6.52” across NJ. This is 1.95” above the 1991–2020 normal and ranks as the 22nd wettest August since records commenced in 1895 (Figure 1). The northern climate division (Hunterdon-Somerset-Union and all counties to their north) averaged 8.53”. This is 3.97” above normal and ranks as the 10th wettest. The southern division (Mercer-Middlesex-Monmouth and all but immediate coastal areas to the south) came in at 5.39”. This is 0.82” above normal and ranks 41st wettest of the past 130 Augusts. The coastal division averaged 4.37”, which is 0.23” below normal and ranks 60th wettest (71st driest). More local specifics on August precipitation follow in the next section.
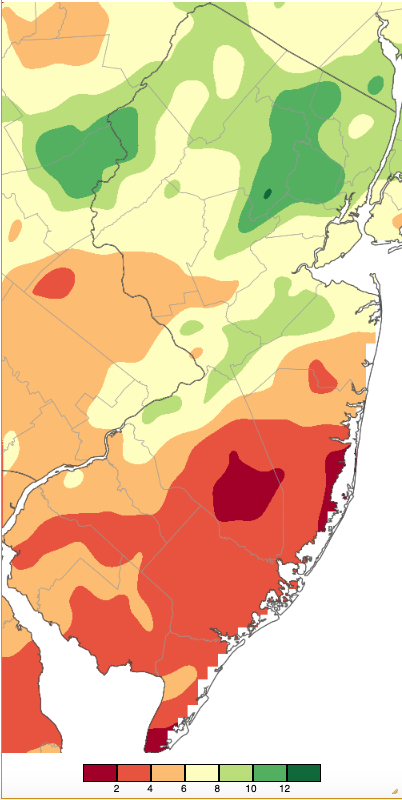
Figure 1. August 2024 precipitation across New Jersey based on a PRISM (Oregon State University) analysis generated using NWS Cooperative, CoCoRaHS, NJWxNet, and other professional weather station observations from approximately 8 AM on July 31st to 8 AM on August 31st. Note the scale in inches at the bottom of the map. Totals range from 0.00”–1.99” (dark red) to 12.00”–13.99” (dark green).
Despite wide-ranging weekly differences, statewide August temperatures were just 0.3° above normal, averaging 73.9°. This ranks as the 30th warmest back to 1895, certainly not near a ranking close to the mid-point of the entire period of record, thus exemplifying how much NJ has warmed over recent decades. The north averaged 72.2° (+0.3°, 28th warmest), the south 75.0° (+0.4°, 30th warmest), and the coast 75.0° (+0.3°, 25th warmest).
Precipitation and Storms
The north/south disparity in August precipitation was clearly evident in the distribution of station extremes. In the wet north, North Arlington (Bergen County) led the way with 12.78”, followed by Madison (Morris) 12.46”, Warren Township (Somerset) 12.37”, Chatham (Morris) 12.23”, Maplewood Township (Essex) 12.13”, Basking Ridge (Somerset) 12.09”, Knowlton Township (Warren) 11.96”, and Ringwood (Passaic) 11.90”. Driest in the south was Barnegat Light (Ocean) at 1.18”, Surf City (Ocean) 1.42”, Berkeley Township (Ocean) 1.44”, Lower Township (Cape May) 1.60” and 1.92” (two stations), Egg Harbor City (Atlantic) 1.95”, and Brigantine (Atlantic) 2.03”.
There were 12 events during the month where one or more, often many more, locations received at least an inch of rain, and three events with more than two inches. The first soaking resulted from widely scattered afternoon and evening thunderstorms on the 2nd. Ringwood caught 1.97”, Greenwich Township (Cumberland) 1.43”, Evesham Township (Burlington) 1.41”, Oakland (Bergen) 1.40”, and 20 stations from 1.00”–1.39”. Strong winds gusted to 67 mph at Pennsauken (Camden) and 42 mph in Cream Ridge (Monmouth) with damage reports from trees and wires down in Burlington, Camden, Monmouth, and Salem counties.
Strong storms returned during the afternoon and evening of a hot 3rd with 1.90” of rain accompanied by hail as large as one half inch in diameter in Blairstown Township (Warren). Rain amounted to 1.87” in East Windsor Township (Mercer), Rockaway Township (Morris) 1.83”, West Milford Township (Passaic) 1.76”, New Brunswick (Middlesex) 1.72”, and Oakland 1.66”. Thirty-four CoCoRaHS stations saw from 1.00”–1.65”. A wind gust of 75 mph was observed at Brandywine Shoal Light, 9 miles west northwest of Cape May Point (Cape May), while onshore, gusts reached 42 mph at Logan Township (Gloucester) and 40–41 mph at four other NJWxNet stations. Reports of downed trees and wires were received by the NWS from nine counties extending from Sussex to Cape May, suggesting that damaging winds likely impacted other counties too. Figure 2 (top) shows a radar image of the eastward moving squall line shortly after 5PM as it had entered the northwest and was about to do so further south. Accompanying the line, a sharp drop in temperatures can be seen in Figure 2 (bottom) from recent highs in the 90°s to immediate post-storm values in the 70°s.
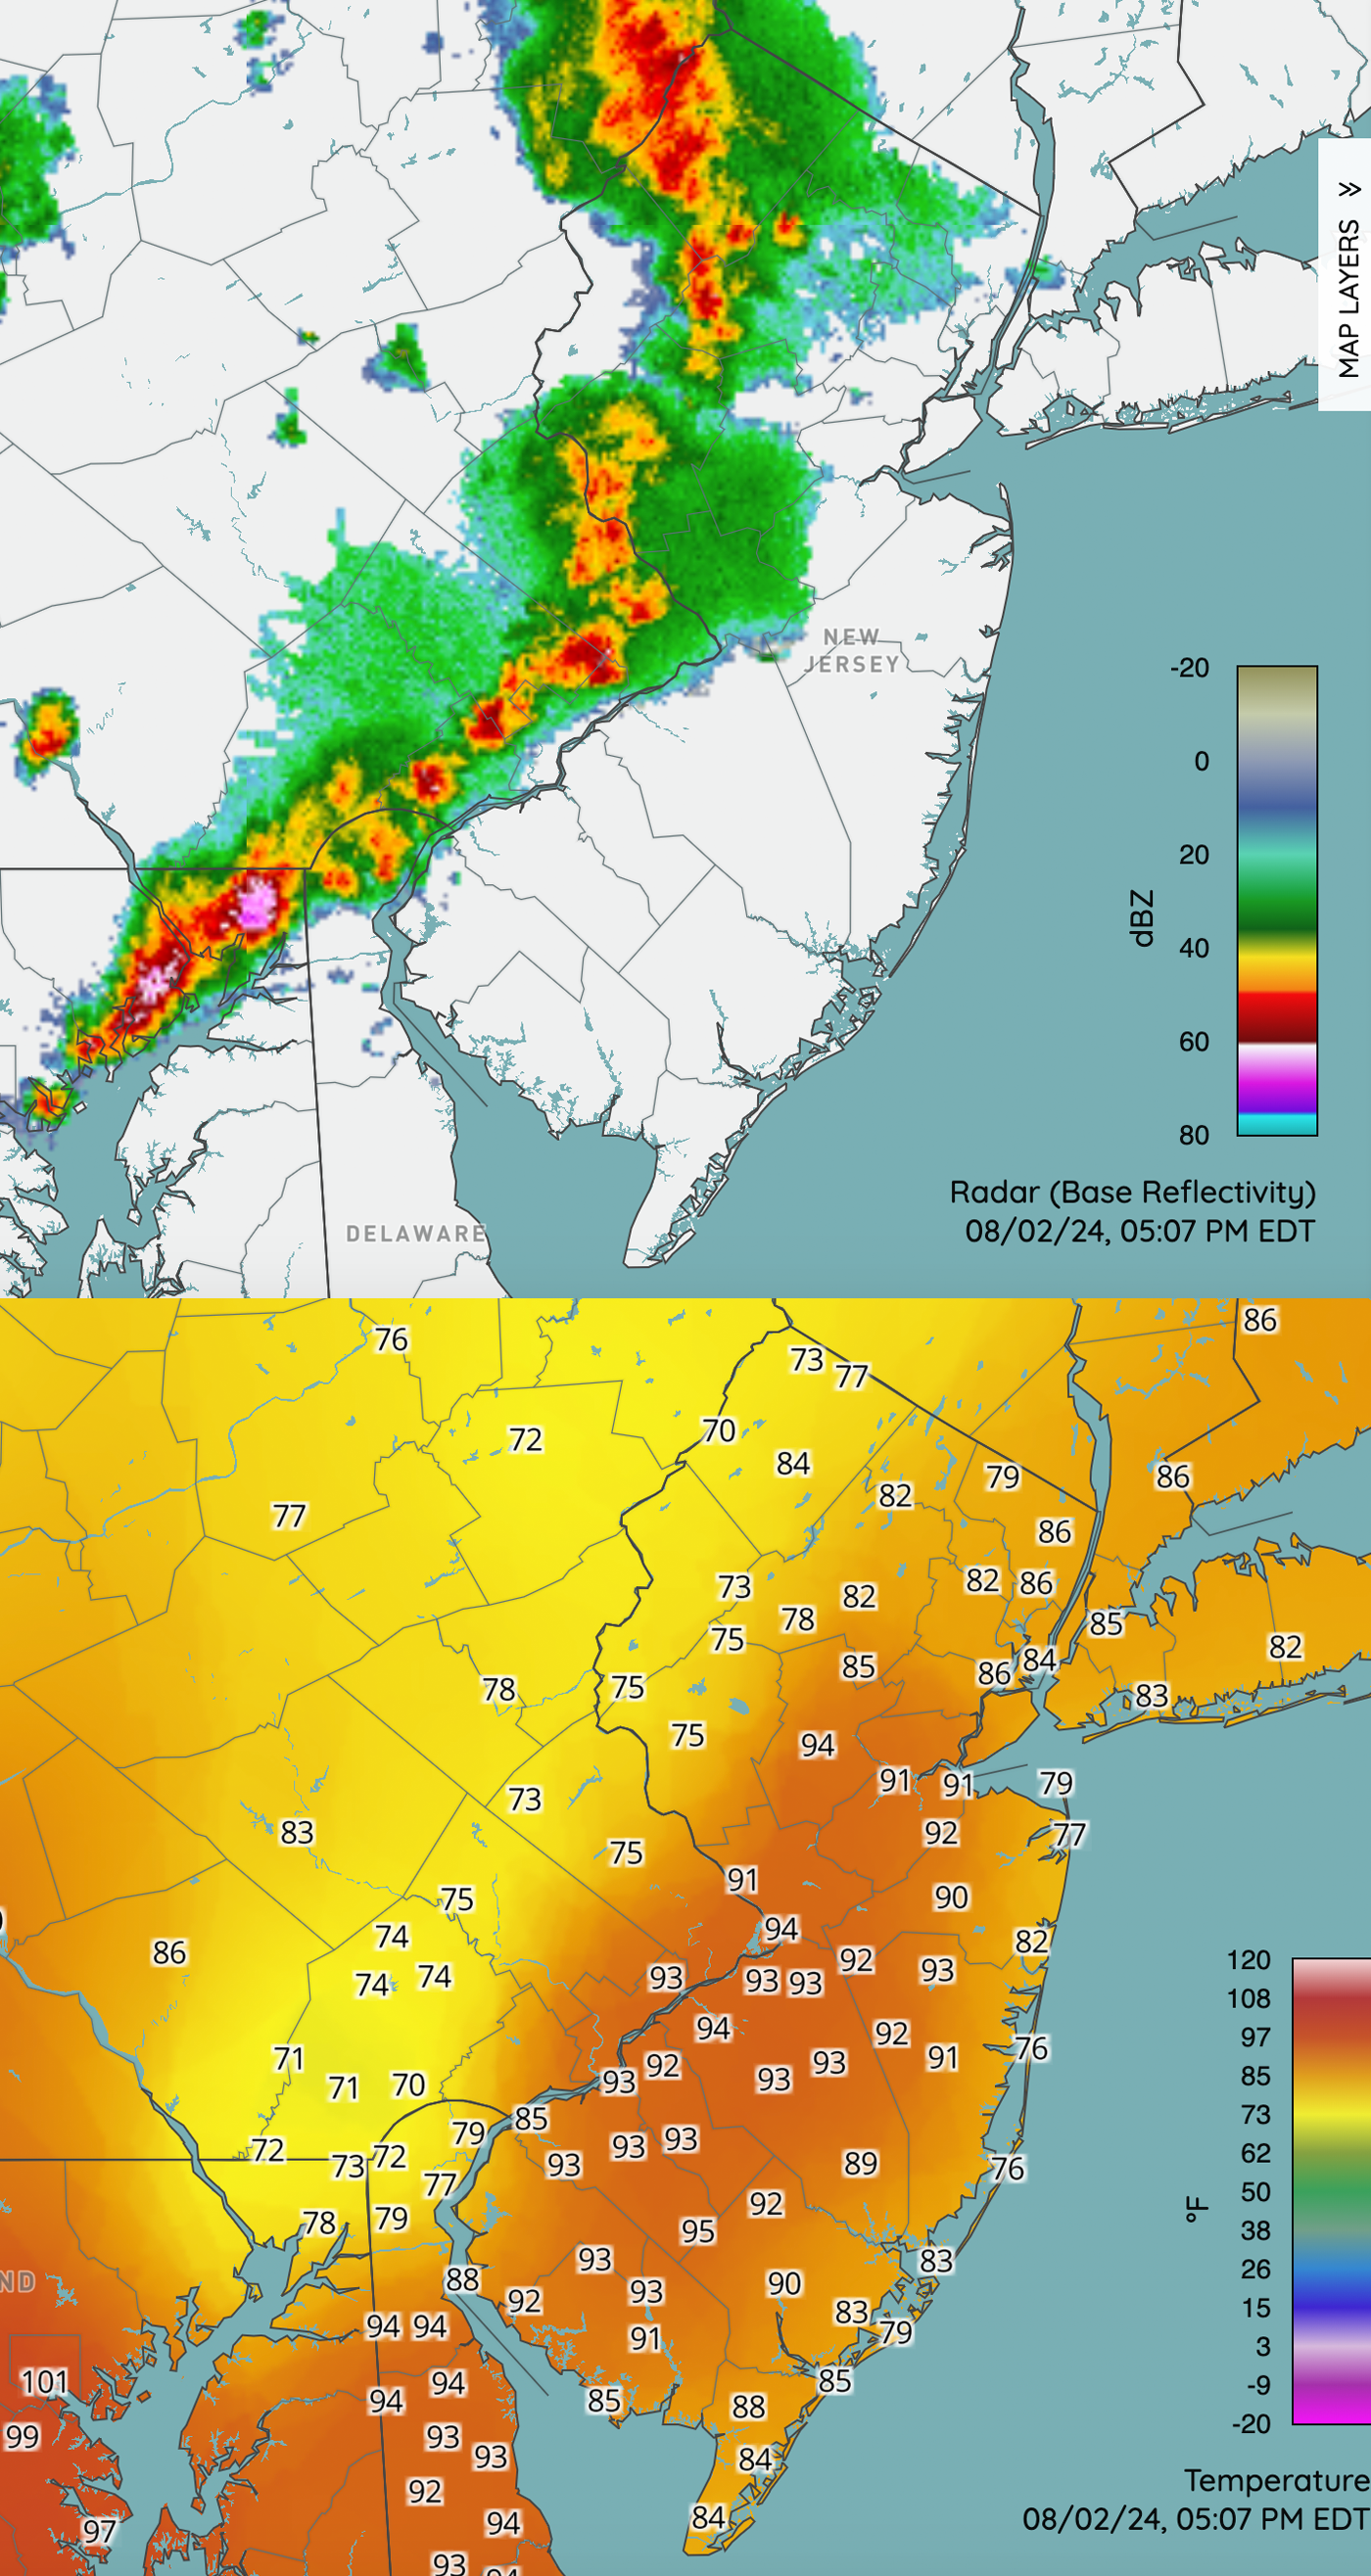
Figure 2. NWS radar (top) and air temperatures (bottom) at 5:07PM on August 2nd (Rutgers NJ Weather Network).
Yet another day with midday and afternoon thunderstorms followed on the 4th. Storms were more scattered than previous days but still brought 1.63” to Medford Lakes (Burlington), Hillsborough Township (Somerset) 1.43”, and Bridgewater Township (Somerset) 1.32”.
Following a one-day break, storms returned during the afternoon and evening of the 6th, ending in the pre-dawn hours of the 7th. Exceptional totals arose from several storms, with as much as 5.00” in an hour reported in Pennington (Mercer), where two CoCoRaHS stations received 7.76” and 6.79”. Nearby, a Hopewell Township station caught 7.48” while another just 1.76”. Elsewhere, two Ewing Township (Mercer) stations saw 5.45” and 5.26”, Cinnaminson Township (Burlington) 5.67”, and Manalapan Township (Monmouth) 5.24”. Of 286 CoCoRaHS reports, six were from 4.00”–4.99”, 30 from 3.00”–3.99”, 55 from 2.00”–2.99”, and 92 from 1.00”–1.99” (Figure 3). Meanwhile, much of the south and the northwest saw less than 0.50”. Flash flooding occurred where the heaviest rain fell, while Sea Girt (Monmouth) saw a gust of 50 mph, and trees and wires were reported down in scattered locations.
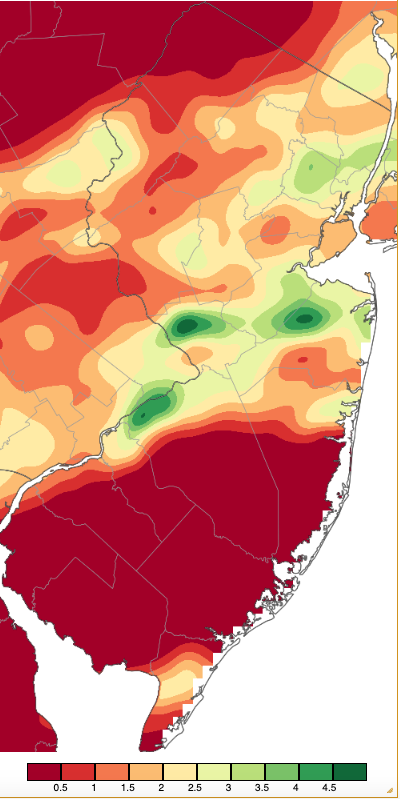
Figure 3. Precipitation across New Jersey from 8 AM on August 6th through 8 AM August 7th based on a PRISM (Oregon State University) analysis generated using NWS Cooperative, CoCoRaHS, NJWxNet, and other professional weather station observations. Note the scale in inches beneath the map.
Right on the heels of this frontal event, the remnants of Hurricane Debby began moving northward from the Carolinas, eventually passing through Pennsylvania early on the 9th. Widely scattered showers during the daytime and evening hours of the 7th, scattered rain and drizzle on the 8th, and rain on the 9th were generally associated with the system. Figure 4 shows the multi-day totals for the event, with top honors going to Lebanon Township (Hunterdon) at 3.33” followed by Vernon Township (Sussex) 3.16” and 3.09”, Franklin Township (Hunterdon) 3.11” and 3.09”, Frelinghuysen Township (Warren) 3.11”, and Holland Township (Hunterdon) 3.04”. Fifty-eight of 270 CoCoRaHS reports were from 2.00”–2.99” and 143 from 1.00”–1.99”. As the storm departed on the 9th, Vernon Township reported a 47-mph gust, eight stations gusted from 40–45 mph, and many others reached the 30–39 mph range.
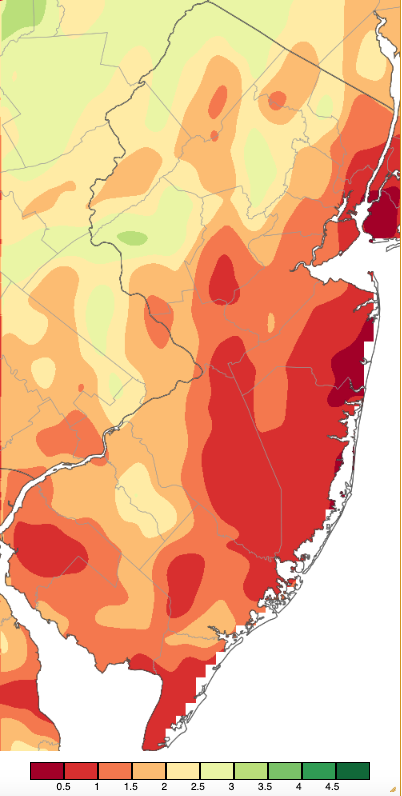
Figure 4. Precipitation across New Jersey from 8 AM on August 7th through 8 AM August 10th based on a PRISM (Oregon State University) analysis generated using NWS Cooperative, CoCoRaHS, NJWxNet, and other professional weather station observations. Note the scale in inches beneath the map is the same as in Figure 3.
Pre-dawn showers on the 11th clipped the far south, with 1.27” in Middle Township (Cape May) and 1.03” in Dennis Township (Cape May). Afternoon and evening storms returned on the 17th, with rains heaviest near the intersection of Mercer-Monmouth-Burlington counties. East Windsor Township received 1.98”, Bordentown (Burlington) 1.45”, and Mt. Laurel Township (Burlington) 1.45”, but only seven other stations reported over 1.00”. Strong storms hit a broad zone from Warren County east to Bergen County on the afternoon and evening of the 18th into the pre-dawn hours of the 19th. Where storms tended to train over an area, large rain totals occurred with associated flash flooding and reports of wind damage (Figure 5). Warren Township was deluged with 5.85”, Columbus (Burlington) 4.62”, Long Hill Township (Morris) 4.54” and 4.33”, Madison 4.52”, and New Providence (Union) 4.46”. Of 261 CoCoRaHS reports, nine exceeded 4.00”, 19 from 3.00”–3.99”, 44 from 2.00”–2.99”, and 42 from 1.00”–1.99”. Away from the main action, a gust of 43 mph was recorded in Fortescue (Cumberland) and an interesting roll cloud was observed in Cape May (Cape May; Figure 6) as lighter rain producing storms moved through other parts of the state
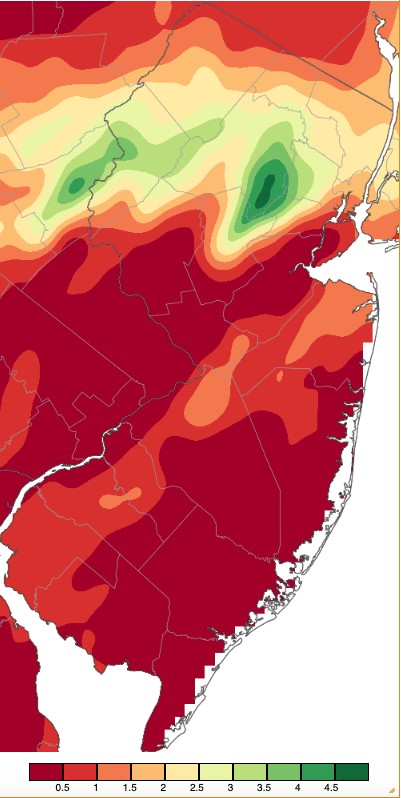
Figure 5. Precipitation across New Jersey from 8 AM on August 18th through 8 AM August 19th based on a PRISM (Oregon State University) analysis generated using NWS Cooperative, CoCoRaHS, NJWxNet, and other professional weather station observations.
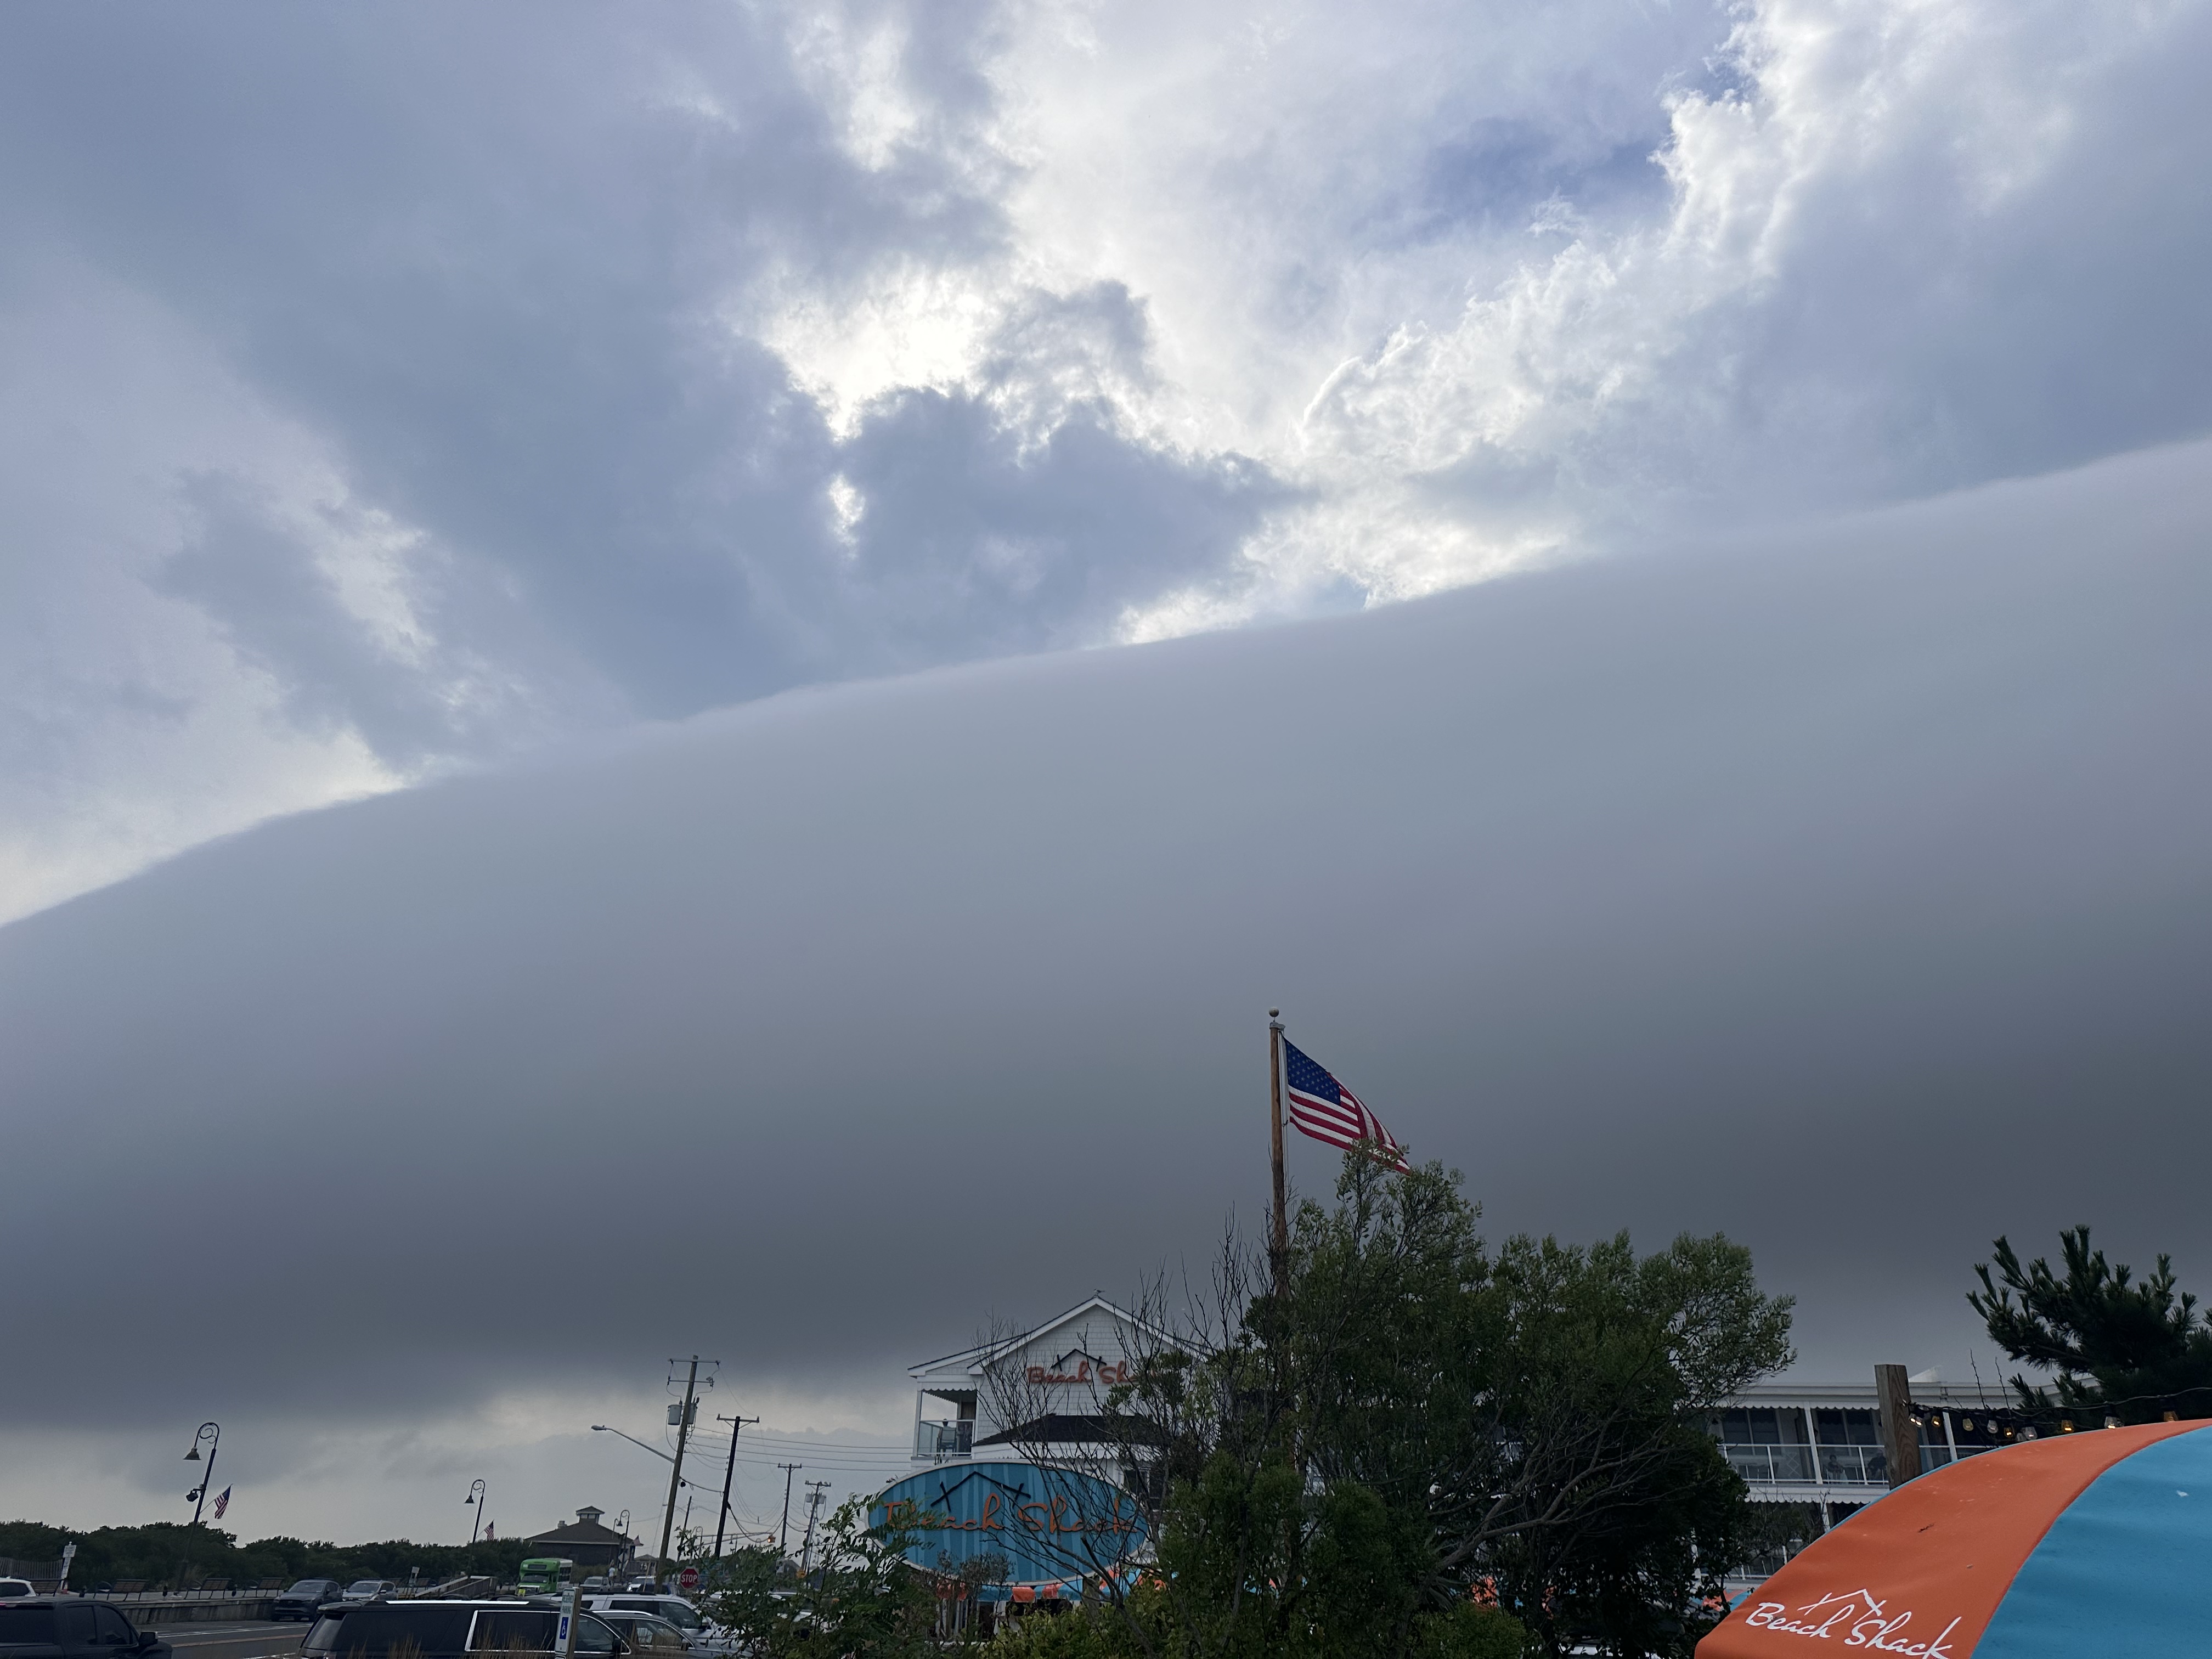
Figure 6. A roll cloud over Cape May on August 18th (courtesy of J. Read).
Dry and cool weather prevailed for the next week, finally exiting with the arrival of warmer and more humid conditions to finish the month. This included very widely scattered storms on the 25th that brought 1.40” to one station Sparta Township (Sussex) while none at another station in the community, and 0.90” at Sandyston. Scattered storms on the 26th deposited 1.36” at Port Republic (Atlantic) and 1.10” and 0.93” at two Galloway Township (Atlantic) locations. A gust of 43 mph occurred in Little Egg Harbor Township (Ocean). Evening storms in central and northern areas on the 28th brought 1.38” to Lopatcong Township (Warren), East Brunswick (Middlesex) 1.37”, Greenwich Township (Warren) 1.29”, and Franklin Township (Hunterdon) 1.08”. A wind gust of 44 mph hit Hillsborough-Duke (Somerset), with a 58-mph gust reported at an airport weather station at Solberg-Hunterdon Airport in Readington Township (Hunterdon).
To close the month’s precipitation, daytime and evening showers on the 29th into the pre-dawn hours of the 30th delivered 1.48” to Millville (Cumberland) and 0.97” at Deerfield Township (Cumberland) in a northwest-to-southeast swath of Salem and Cumberland counties in the south and a similarly-oriented path just south of the NY border in the north where High Point Monument (Sussex) saw 1.61”, Ringwood 1.13”, and Oakland 1.12”.
The lowest barometric pressures of the month were observed on the 19th, falling between 29.60”–29.70”. The highest pressures were on the 23rd, ranging from 30.30”–30.40”.
The last US Drought Monitor weekly map of August (data valid August 27th) indicates a sizeable portion of south Jersey classified as Abnormally Dry (D0; Figure 7). This suggests conditions have an expected recurrence interval of approximately 3–5 years.
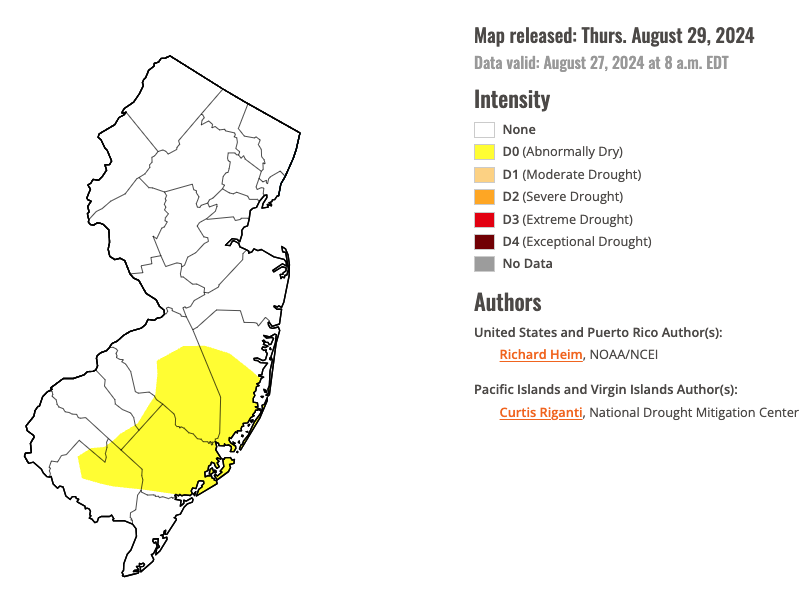
Figure 7. U.S. Drought Monitor map of conditions in NJ as of August 27th.
Temperature
August temperatures flip flopped from hot to, ultimately, comfortable, emerging close to the 1991–2020 normal. Eleven days had high temperatures of 90° or higher at one or more of the 68 Rutgers NJ Weather Network stations. Thirteen days saw lows of 55° or cooler within the network.
The month began with what proved to be its hottest day. Hamilton (Mercer) reached 100°, 36 stations were 95°–99°, and 19 made it to 90°–94° (Figure 8). Point Pleasant (Ocean) was coolest at 81°. The 2nd rivaled the 1st for hottest with Hillsborough-Duke at 100°, 30 stations from 95°–99°, and 17 from 90°–94°, with West Cape May only to 79°. Berkeley Township and Hillsborough-Duke reached 96° on the 3rd, with 46 sites from 90°–95°, this time with coastal Atlantic City Marina coolest at 80°. Hillsborough-Duke and Pennsauken led at 95° on the 5th, with 43 sites 90°–94°. Howell (Monmouth) reached 95° on the 6th, again with 43 sites 90°–94°.

Figure 8. Maximum temperatures on August 1st based on a PRISM (Oregon State University) analysis generated using NWS, NJWxNet, and other professional weather stations. Note the 2° scale beneath the map.
Lower Alloways Creek (Salem) squeaked out a 90° maximum on the 10th, while Piney Hollow (Gloucester) reached 91° on the 16th and 90° on the 18th during the overall cooler mid-month period. Heat returned in late August with Hammonton (Atlantic) and Silas Little (Burlington) up to 91° on the 26th. Hammonton reached 93° on the 27th with Vineland (Cumberland) at 92° and 14 stations 90° or 91°. The hottest day since the 3rd occurred on the 28th, with six stations topping out at 98°, 25 from 95°–97°, and 26 from 90°–94°. Indicative of late summer increasing ocean warmth, the coolest coastal station, Harvey Cedars (Ocean), made it to an air temperature of 85°, the same as the two highest elevation stations in the NJWxNet, High Point Monument and Vernon Township.
Most often, the coolest daily low temperatures in summer within the NJWxNet are found in northwest valleys. Such was mostly the case this August. The first 55° or cooler low waited until the 11th when Sandyston (Sussex) reached 54°. Pequest (Warren) and Sandyston were 52° on the 12th. Walpack (Sussex) fell to 50° on the 13th, with 12 stations from 51°–55°. A three-day run of Sandyston being coolest included 53° lows on the 14th and 15th, and down to 55° on the 16th.
The second six-day run of 55° or cooler lows commenced on the 20th, with an interesting combination of High Point Monument and Walpack sharing low honors at 49°. As cool air invaded the state, the 21st found Walpack down to 44°, 25 stations from 45°–50°, and 30 from 51°–55° (Figure 9). Even Atlantic and Delaware coastal stations were chilled, with five stations the mildest in the NJWxNet at 58°. Rivaling the previous morning, Sandyston led the way on the 22nd with a low of 44°, with 27 sites from 45°–50° and 28 from 51°–55° (Figure 10).
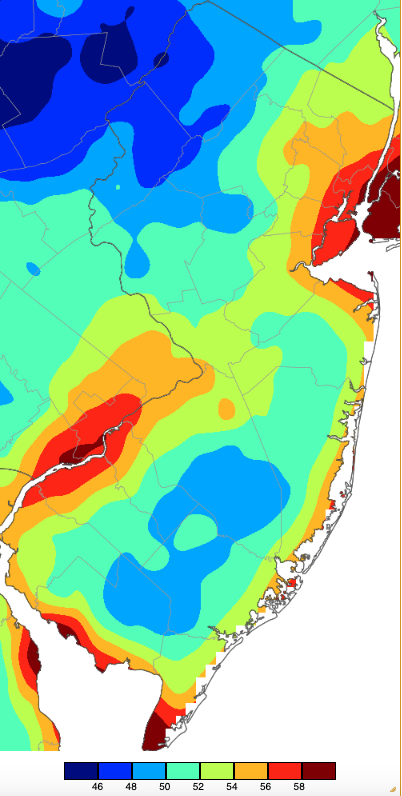
Figure 9. Minimum temperatures on August 21st based on a PRISM (Oregon State University) analysis generated using NWS, NJWxNet, and other professional weather stations.
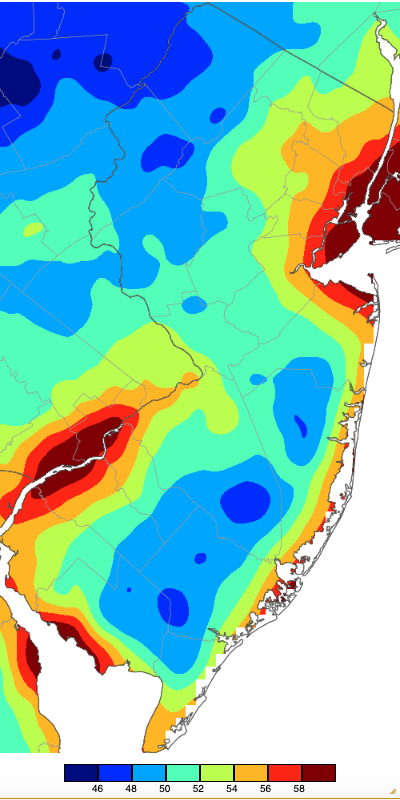
Figure 10. Minimum temperatures on August 22nd based on a PRISM (Oregon State University) analysis generated using NWS, NJWxNet, and other professional weather stations.
The August chill continued on the 23rd, with Sandyston at 46°and 45 stations from 47°–55°. Three locations fell to 50° on the 24th, spreading low-lying chill to Pequest, Kingwood (Hunterdon), and Oswego Lake (Burlington). Five stations reached 53° on the 25th, with Hopewell Township joining Kingwood, Pequest, Sandyston, and Walpack on the list. The 27th brought 55° lows to Pequest, Sandyston, and Walpack.
Summer 2024 Overview
While regional disparities in rainfall were headlined in this report, what is a remarkable recent transition to warmer summers in the Garden State should certainly not be ignored. With the 2024 summer coming in as third warmest since 1895, the ten warmest on record have all occurred since 2005 (Table 1). This includes six of the last eight summers. The 75.1° average for this year is 2.0° above the 1991–2020 normal. The past 15 summers have averaged 74.1°, which is 2.5° milder than the 1895–2023 average.
| Rank | Year | Summer Avg. Temp. |
|---|---|---|
| 1 | 2010 | 75.7° |
| 2 | 2020 | 75.3° |
| 3 | 2024 | 75.1° |
| 4 | 2022 | 75.0° |
| 5 | 2016 | 74.9° |
| 6 | 2005 | 74.8° |
| 7 | 2011 | 74.6° |
| 8 | 2021 | 74.5° |
| 9 | 2019 | 74.4° |
| 9 | 2018 | 74.4° |
Table 1. The 10 warmest summers (June–August) across New Jersey since 1895.
This past June was the 3rd warmest on record and July the 7th warmest. Only the near-normal August kept this summer from rivaling 2010 as New Jersey’s warmest. Forty-five of the 92 summer days had one or more NJWxNet station reaching 90° or higher (May also had three days reach that mark). Figure 11 depicts the hottest temperatures across the state at some point (not all occurring on one day) this summer. June 22nd was the hottest summer day, with eight stations topping out at 100°. July 15th found Hamilton (Mercer) up to 100°, July 16th saw Hamilton and the NWS Cooperative station in Harrison (Hudson) up to a summer maximum of 101°, with four stations at 100°. Hamilton again reached 100° on August 1st and Hillsborough-Duke hit 100° on the 2nd.
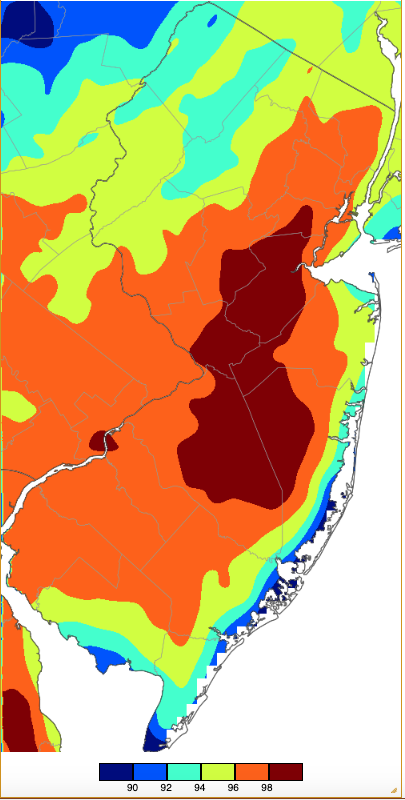
Figure 11. Extreme maximum temperatures during the summer of 2024 (June 1st–August 31st) based on a PRISM (Oregon State University) analysis generated using NWS, NJWxNet, and other professional weather stations. The seasonal maximum occurred on different days at different locations. Note the 2° scale beneath the map.
Summer lows are shown in Figure 12. The summer kicked off with the coldest morning of the season when Walpack (Sussex) fell to 39° on June 1st. Ten other June days found one or more NJWxNet station in the 40°s. The 2nd was the coolest July day with Walpack (Sussex) down to 47° and this site also accounting for two other July mornings at 49° (26th and 27th). Completing a total of 18 summer days with one or more station at 49° or cooler, August had four. This included 44° at Walpack on the 21st and at Sandyston (Sussex) on the 22nd.
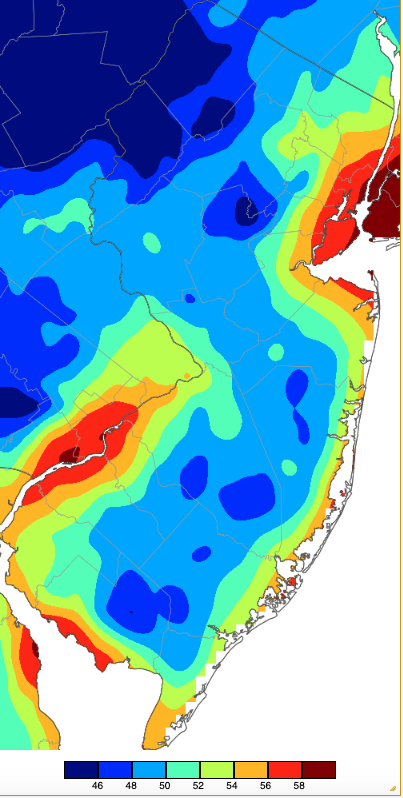
Figure 12. Extreme minimum temperatures during the summer of 2024 (June 1st–August 31st) based on a PRISM (Oregon State University) analysis generated using NWS, NJWxNet, and other professional weather stations. The seasonal minimum occurred on different days at different locations. Note the 2° scale beneath the map.
Looking divisionally, the north averaged 73.5°. This was 2.1° above normal and ranks 4th warmest on record. The south averaged 76.2°, which was 2.0° above normal and ranks 3rd warmest. The coast averaged 75.4°, which was 1.6° above normal and ranks 7th warmest. While not much cooler compared to normal than the other divisions, the immediate coast saw closer-to-normal temperatures than inland areas all summer long due to prevailing winds that induced upwelling of cool water along the coast that helped cool the coastal air when frequent sea breezes arose. For instance, the NWS Atlantic City Marina station averaged 73.2° for the summer, which was 0.2° below normal.
Statewide summer precipitation averaged 12.87". This was 0.71" below the 1991–2020 normal and ranks as the 62nd wettest/69th driest of the past 130 summers. As mentioned previously in this report, there was a notable disparity between the north and south (Figure 13). The northern division averaged 14.34”, which was 0.45” above normal and ranks 54th wettest. Meanwhile, the south averaged 12.02”, which was 1.43” below normal and ranks 60th driest (71st wettest). The coast averaged 11.48”, which was 1.35” below normal and ranks 73rd wettest (58th driest).
Two localized deluges in late June and July over Cape May County are the exception to the rule in the south, as they led to the two highest seasonal totals, 20.41” at Dennis Township and 20.40” in Middle Township. The next highest totals were found in the north, including Warren Township (Somerset) 19.68”, Chatham (Morris) 19.36”, Madison (Morris) 18.96”, and North Arlington (Bergen) 18.85”. The season’s lowest totals include Barnegat Light (Ocean) with just 8.12”, Pine Beach (Ocean) 8.49”, Beachwood (Ocean) 8.60”, Freehold Township (Monmouth) 9.11”, Hopewell Township (Mercer) 9.46”, and Millville (Cumberland) 9.87”.
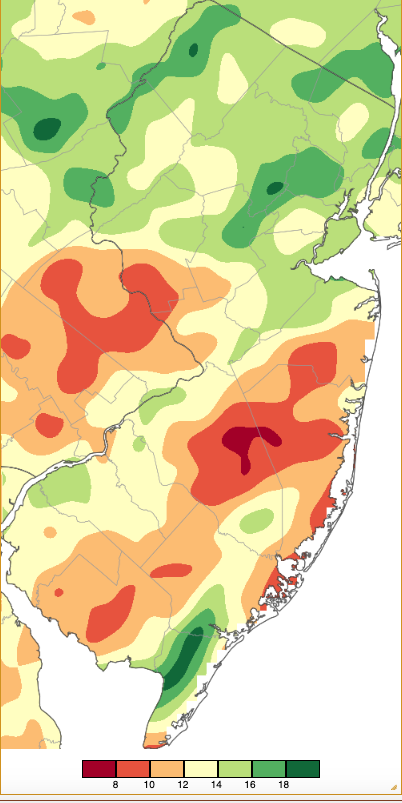
Figure 13. Summer precipitation across New Jersey from 8 AM on May 31st through 8 AM August 31st based on a PRISM (Oregon State University) analysis generated using generated using NWS Cooperative and CoCoRaHS observations. Note the scale in inches beneath the map.


