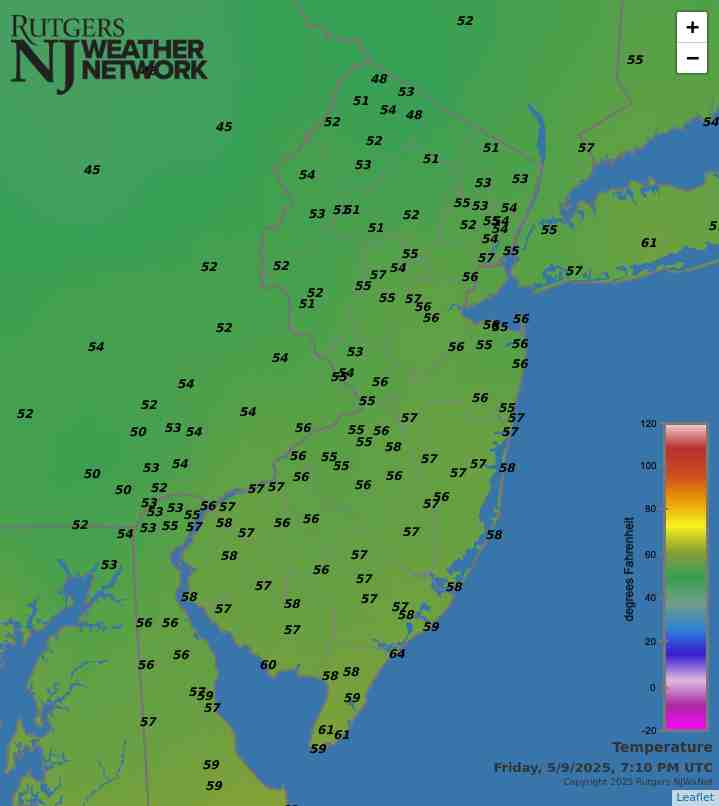
Latest Temperatures

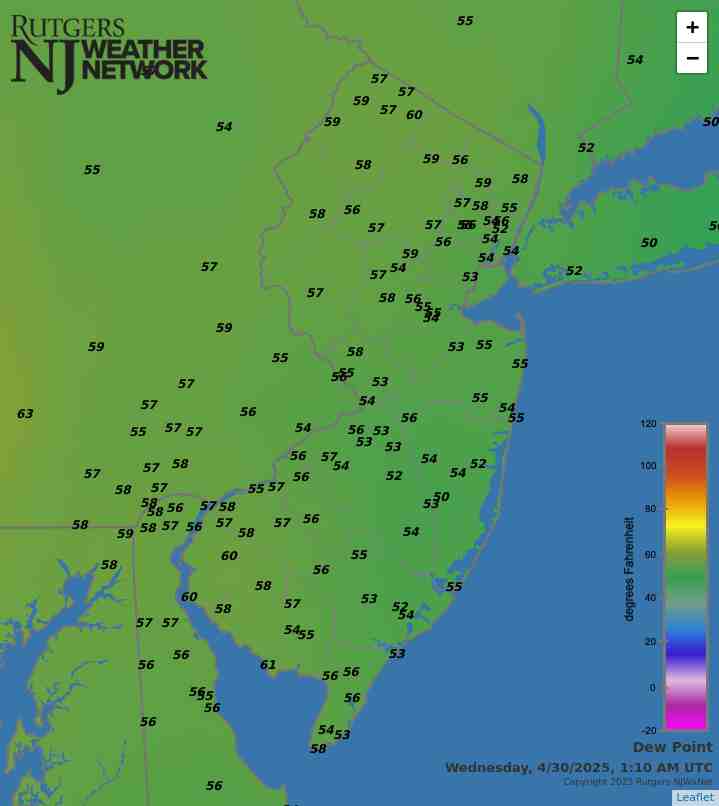
Current Dew Point

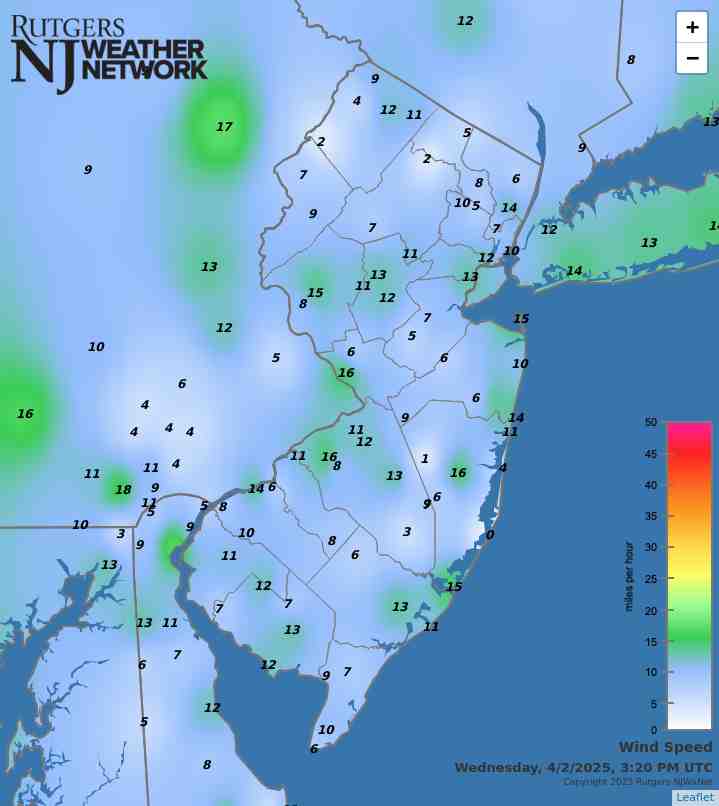
Latest Wind Speeds

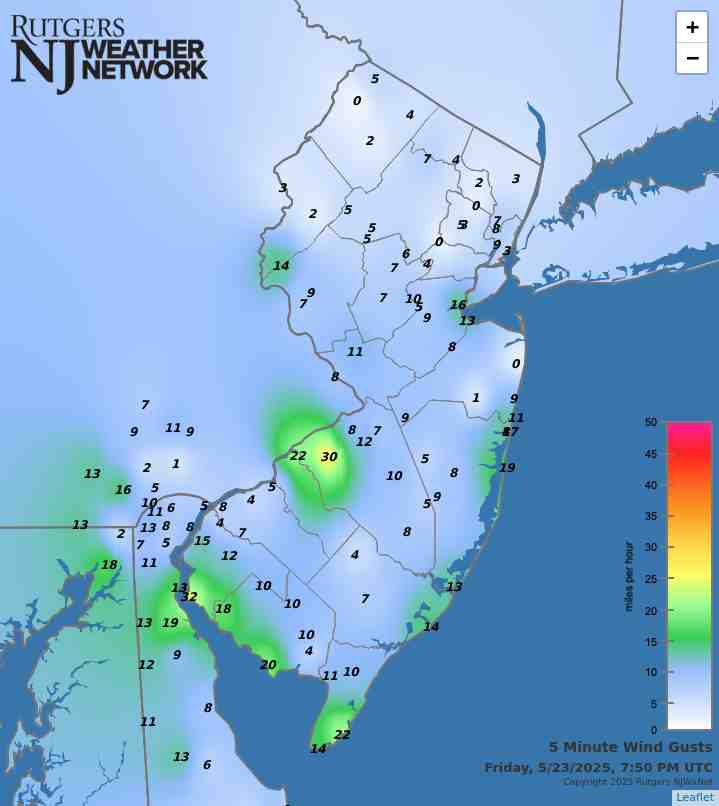
Wind Gusts

Top Story

Debris and rubble in the aftermath of flash flooding that occurred on July 14th in North Plainfield (Somerset County).
Debris and rubble in the aftermath of flash flooding that occurred on July 14th in North Plainfield (Somerset County). Photo by Seth Wenig/AP Photo.

Tragically, this July demonstrated how weather danger lurks across the Garden State during summer months. July thunderstorm winds felled trees that resulted in three fatalities, lightning strikes killed two and injured others, and flash flooding took two lives and put countless others in perilous situations. No doubt, the often-relentless heat and humidity led to medical issues for those most vulnerable, be they old, young, infirmed, employed outdoors, or living in stifling locations devoid of air conditioning.

Temperature-wise, the July statewide average temperature of 78.1° was 2.7° above the 1991–2020 mean and ranked as the 6th warmest since records commenced in 1895. The average high of 87.7° was 2.0° above normal, ranking 12th warmest, while the average low of 68.5° was 3.4° above normal, ranking 3rd warmest. Eight of the ten warmest Julys have occurred since 2010 and twelve of fifteen since 1999. Only three Julys in the past 25 years have averaged below the 1991–2010 normal. The June–July average of 75.0° is the 5th warmest, only exceeded by 76.1° in 2010, 75.6° in 2024, and 75.2° in both 2020 and 2011.

The 5.44” statewide average July precipitation was 0.73” above normal, ranking 42nd wettest of the past 131 Julys. As is often seen during summer months, totals varied markedly over rather short distances, seen this month in both the north and south. Overall, the north averaged 4.62” (-0.10”, 64th wettest/68th driest), south 5.93” (+1.19”, 26th wettest), and coast 6.08” (+1.70”, 20th wettest).

Latest Extremes

City, State Temp
Little Egg Harbor Twp., NJ 76
Fortescue, NJ 74
Piney Hollow, NJ 74
New Brunswick, NJ 74
Hamilton, NJ 74
City, State Temp
High Point Monument, NJ 63
Vernon Twp., NJ 64
Hackettstown, NJ 66
High Point, NJ 67
Stewartsville, NJ 68
most current information as of Aug 31 10:40 AM

Latest Conditions & Forecast

New Brunswick, NJ

Rutgers University Meteorology Program

74°F

Wind

6 mph from the N

Wind Gust

11 mph from the NNE

Sunny
80 °F
Mostly Cloudy
56 °F
Mostly Sunny
79 °F
Mostly Clear
56 °F
Sunny
80 °F
Mostly Clear
57 °F
Mostly Sunny
82 °F
Partly Cloudy
60 °F
Mostly Sunny
82 °F
Chance Showers
62 °F
Showers Likely
80 °F
Showers Likely then Chance Showers
57 °F
Sunny
79 °F

Today

Sunny, with a high near 80. Calm wind becoming northeast around 5 mph.

Tonight

Mostly cloudy, with a low around 56. Calm wind.

Labor Day

Mostly sunny, with a high near 79. Calm wind becoming east around 5 mph in the morning.

Monday Night

Mostly clear, with a low around 56. East wind around 5 mph becoming calm.

Tuesday

Sunny, with a high near 80. Calm wind becoming northeast around 5 mph.

Tuesday Night

Mostly clear, with a low around 57.

Wednesday

Mostly sunny, with a high near 82.

Wednesday Night

Partly cloudy, with a low around 60.

Thursday

Mostly sunny, with a high near 82.

Thursday Night

A chance of showers after 8pm. Mostly cloudy, with a low around 62. Chance of precipitation is 50%.

Friday

Showers likely. Mostly cloudy, with a high near 80. Chance of precipitation is 60%.

Friday Night

Showers likely. Partly cloudy, with a low around 57. Chance of precipitation is 60%.

Saturday

Sunny, with a high near 79.

Search by zipcode or city/state for the latest conditions, forecasts, graphs, maps and more nearest to you.

More News

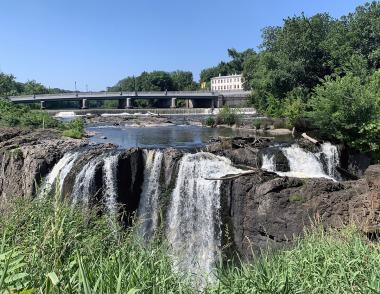
Photo of The Great Falls along the Passaic River in Paterson (Passaic County) on June 25th.

Looking back at the past month, or the first half of this year for that matter, “mysterious,” “puzzling,” or “difficult to understand” may best describe what has transpired when it comes to New Jersey’s weather and climate behavior. In other words, enigmas. More on the previous six months toward the end of this report. First a look at June, which followed a drought-busting (and hopefully not just interrupting) 7th wettest May, but resumed an only twice-broken string of months with below-normal precipitation back to May 2024 (August 2024 and May 2025). Then there were cool days that had some...

Photo of the Tour of Somerville bicycle race, held on the sunny and dry afternoon of May 26th.

It took a frustratingly long time for the cool season “recharge” of New Jersey’s water resources to get well underway. Following a record dry fall 2024, December through April precipitation remained below normal, including the third driest January of the past 131 years. However, February, March, and April precipitation totals were only a bit below normal, so while precipitation deficits were not recovering, they did not worsen, and reservoirs began to fill. Then along came May, with near record-high precipitation, just in time to bring most water resources up to normal heading into summer....

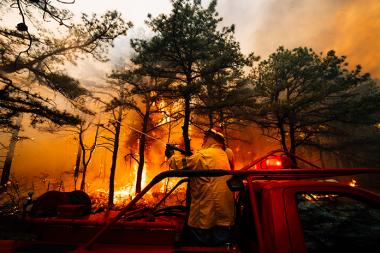
Firefighters battle the Jones Road Wildfire in Ocean County (photo courtesy of the New Jersey Department of Environmental Protection).

If it is weather variety you enjoy, April certainly must have proved rather satisfying. Atmospherically, this was expressed by a cool, wet first half of the month and a warm, dry second half. When all was totaled and averaged, the full month emerged with above-normal temperatures and close-to-normal precipitation. Toss in one northern snow event, considerable wind, lingering drought in some areas, and a major Pinelands wildfire, and there was quite a potpourri of conditions. Looking first at precipitation, the statewide average of rain and melted snowfall was 3.72”. This was 0.02” above...

More News

Will the Present Strong El Niño Event Have a Major Impact on New Jersey’s Weather?
December 18, 2015 - 12:24pm -- Ariel Schabes

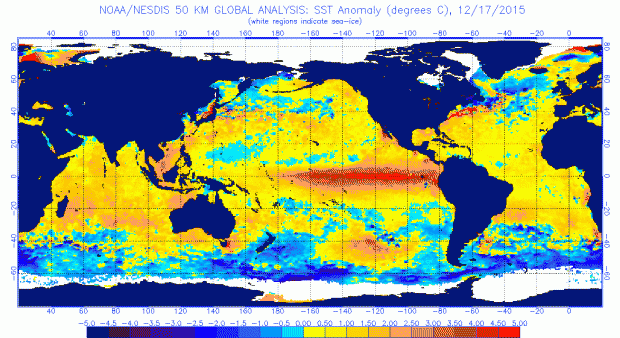
Roughly every two to seven years, a joint ocean – atmosphere phenomenon known as “El Niño” occurs. Right now happens to be one of those times and this event is showing every indication of being one of the three strongest El Niños of the past 65 years. An El Niño is defined as the prolonged warming of sea surface temperatures (SST) over the central and eastern equatorial Pacific and associated anomalies of atmospheric variables such as winds, clouds, and precipitation. According to the National Oceanic and Atmospheric Administration (NOAA), to be categorized as an El Niño, a 3-month SST anomaly of at least 0.9°F (0.5°C) above average must be observed in the central and eastern equatorial Pacific. There are related atmospheric anomalies elsewhere around the globe that are associated with conditions in the tropical Pacific. Do these anomalies extend to New Jersey, especially during a strong event? This article discusses the current El Niño episode as of mid-December and speculates as to whether NJ is already being impacted by this event and may continue to be into spring 2016.

Unseasonably Mild and Dry: November and Fall 2015 Recaps

December 4, 2015 - 4:11pm -- Dave Robinson

Sunset picture

The climatological fall season ended on a mild note, with the statewide November average temperature of 49.3° coming in at 3.7° above normal. This ranks as the 5th mildest November on record, tied with 1948. Observations go back 121 years to 1895, yet five of the nine warmest Novembers have occurred since 2001. The month had an abundance of sunny days, during what is commonly a rather cloudy time of the year. Precipitation averaged 2.33” across NJ, which is 1.31” below normal and ranks as the 41st driest November. Only two significant rain events occurred during the mid-month interval.

On Average, Rather Average, Bookended by Stormy Conditions: October 2015 Recap

November 6, 2015 - 4:58pm -- Dave Robinson

Waves picture

There were many sides to New Jersey’s October 2015 weather, however, when temperature and rainfall observations were averaged, conditions were quite close to long-term (1981–2010) means. The statewide average temperature of 54.4° was 0.4° below normal. This ranked as the 53rd coolest since 1895 (121 years). Precipitation averaged 4.17", which is 0.24" above normal and ranks as 44th wettest. October was bookended by events that dumped the vast majority of the month’s precipitation, with an extended period of very dry weather in between. This led to a continuation of moderate drought in the northeast, with nearby areas remaining abnormally dry. The late-month rain, which for the first time in many months was heaviest over the driest areas, staved off the need for any further drought deterioration, at least for the time being. The major weather event of the month extended over the first five days, when incessant onshore winds generated the worst beach erosion and back bay flooding since Sandy three years ago, though not nearly in the same ballpark of what Sandy wrought.

Near Record Warmth and Quite Dry…until the 30th: September 2015 Recap

October 4, 2015 - 3:30pm -- Dave Robinson

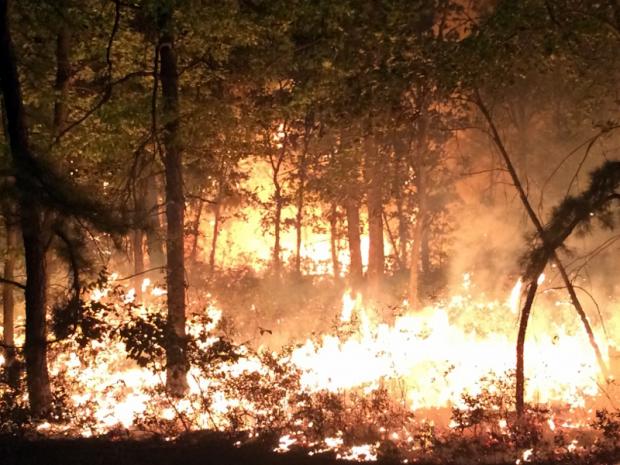
Wildfire photo

The ninth month of 2015 served as a bookend of sorts to an extended warm season. The average statewide temperature of 70.7° was 4.5° above the 1981–2010 normal and ranks as the 3rd warmest on record (since 1895). This ranking is the same as that achieved in May, with the intervening months all above average, though not nearly as much so as these shoulder months. Five of the ten warmest Septembers have occurred since 2002. A look back at the past five months finds that this most recent May through September interval was the third warmest on record. Even more notable than the recent run of warm Septembers, eight of the top ten warm seasons occurred within the last 18 years and four within the last six years.

What had been a rather dry month with drought concerns ended on a damp note on the 30th with a wet episode that extended into early October. Through the 29th, the month ranked as the 14th driest. However, an approximate statewide-average rainfall of 1.50” on the 30th brought the monthly average to 3.44” (-0.63”) and with it the rank of 63rd driest.

New Jersey Smart Lawn Watering Initiative: Conserving Water Starts With You!

September 15, 2015 - 4:49pm -- Jessica Raff

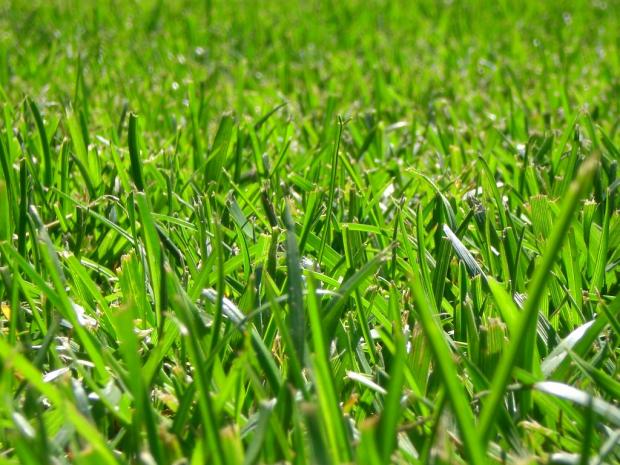
Grass photo

About 70% of the fresh water used around the world is devoted to irrigation, and a similar figure holds true with respect to New Jersey’s water use. Much of this in New Jersey is put towards lawn watering. It is apparent to anyone paying attention to the frequency and timing of when lawns are watered that, just as research suggests, many New Jersey homeowners are over-irrigating their lawns. This wastes precious water that could be conserved wisely by employing more efficient irrigation methods. This article outlines a simple way that you can participate in our New Jersey Smart Lawn Watering Initiative without investing in new sprinkler equipment or devoting large amounts of time to lawn management. By following the instructions discussed below, you can save water and money, while keeping your lawn green and beautiful.

Consistently Warm and a Mixed Distribution of Precipitation: August & Summer 2015 Recaps

September 2, 2015 - 9:58pm -- Dave Robinson

Dry Reservior

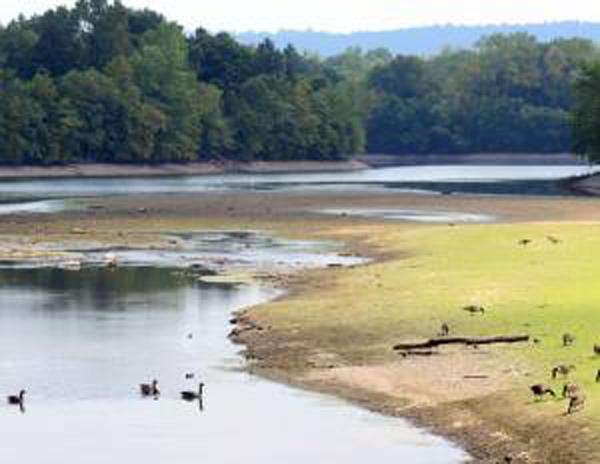
This month had quite a variety of weather conditions around the state. This resulted in some areas experiencing flash flooding and others encroaching drought conditions. Damage resulted from the flooding and one storm even produced a nocturnal “heat burst.” Some minor brush fires and declining river, ground water, and reservoir levels accompanied subnormal rain totals. The dry conditions helped produce some wide daily swings from cool nighttime temperatures to consistently warm daytime maximums. Preliminary values show August 2015 to have a statewide average rainfall of 2.18”. This is 2.03” below normal and ranks as the 13th driest since statewide records commenced in 1895 (Table 1). The 74.5° average temperature was 1.1° above the 1981–2010 mean and ranks 21st warmest.

Leaning Warm, Leaning Dry: July 2015 Recap

August 1, 2015 - 8:23pm -- Dave Robinson

Flooding photo

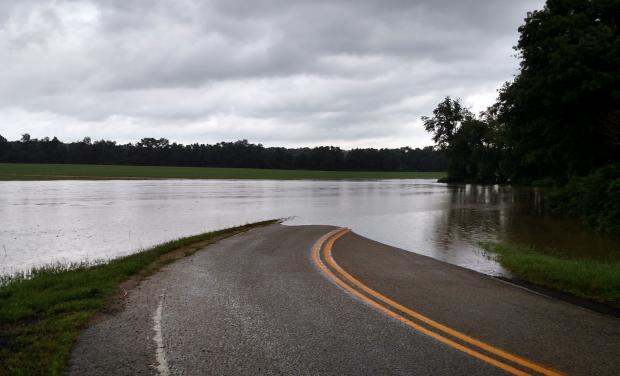
In most respects, July 2015 was a rather common one in the weather department. The statewide average temperature of 75.5° was 0.5° deg above the 1981–2010 mean. This past June had the same positive anomaly. This ranks as the 28th warmest July since 1895. It may seem strange to have such a small departure from normal yet rank in the top quartile for warmth. This can be explained by the fact that New Jersey has gotten warmer since the end of the 19th century. Compared to all Julys since 1895, this past July was 1.3° above average. Again, this might not seem like a large difference, however, given that temperatures do not vary from year to year nearly as much in summer as in winter, this change over the past century is notable.

With an El Niño underway, how much of an impact can we expect it to have on NJ's summer weather?

July 23, 2015 - 2:29pm -- Dave Robinson

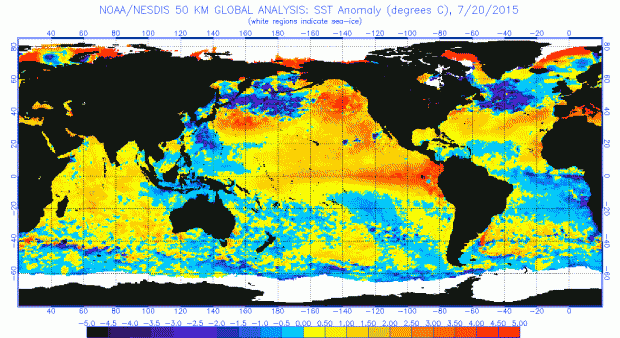
Sea Surface Temperature (SST) anomalies for July 20, 2015.  NOAA/NESDIS.

Scientists are carefully monitoring sea-surface temperatures in the tropical Pacific Ocean for a potential El Niño event. An El Niño occurs when warmer-than-average waters start to form in the eastern Pacific Ocean, specifically near the equatorial latitudes. Easterly winds (blowing from the east) typically move warmer water to the western Pacific (near Indonesia), permitting cooler water to upwell to the surface in the east (near South America). When these winds are weaker, or if they reverse direction, the warm water stays in the eastern Pacific. This difference in sea surface temperatures and winds creates a new dynamic between the ocean and atmosphere, distinctly affecting weather patterns across the world. No two El Niño events are alike; they vary in magnitude and location of the largest temperature anomalies. El Niño events can be classified as Strong, Moderate or Weak.

Drought? What Drought?: June 2015 Recap

July 4, 2015 - 7:34pm -- Dave Robinson

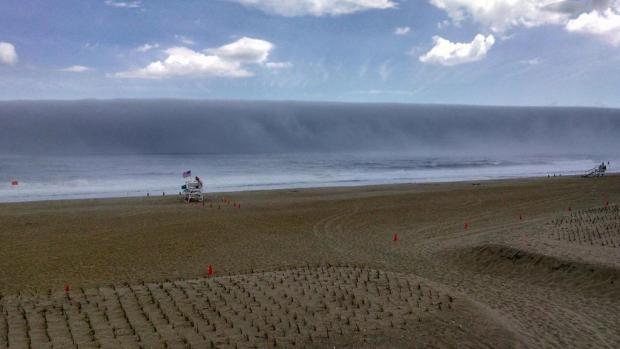
Roll Cloud photo

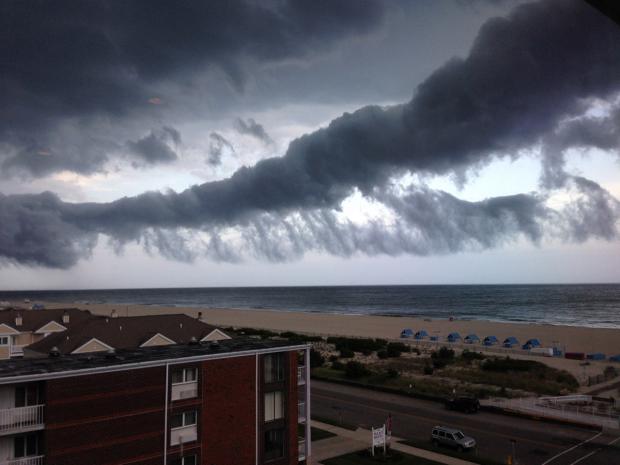
Toward the end of May, the threat of a significant drought loomed over the Garden State, as May proved to be the 3rd driest on record. Crops were in bad shape or not growing at all, and reservoir levels were declining at a faster than seasonal rate. However, New Jersey had yet to reach the point where average and timely rainfall could not remedy the situation. Not only was this prescription filled, it was done in abundance. June rainfall averaged 8.21" across NJ. This was 4.19" above the 1981-2010 normal and ranked 4th wettest since 1895 (Table 1). It joined four other Junes in the past 13 years to rank in the top eight over this 121-year period. As explained in last month's report, the rains that fell during the daytime and evening hours of May 31st factored into the June total, much as the localized afternoon and evening rains on June 30th (discussed below) will count toward the July total.

Third Warmest and Driest as Drought Concerns Arise, and a Pronounced Transition: May and Spring 2015 Recap

June 4, 2015 - 8:52pm -- Dave Robinson

Sea fog photo

May 2015 was a warm and dry month across New Jersey. As the month ended, drought concerns were looming large, though rainfall in the north during the afternoon and evening of the 31st and continuing into the first days of June resulted in at least a temporary braking of the downward slide. Based on data gathered at long-term National Weather Service Cooperative Observing (COOP) stations, May rainfall averaged 1.08" across NJ. This is 2.92" below the 1981-2010 mean and ranks as the 3rd driest May since records commenced in 1895.

As those who have been reading these monthly narratives for some time now know, precipitation that falls at COOP stations after observation time on the last day of the month gets recorded as falling on the first day of the next month. Most COOP stations observe in the morning, thus the heavy showers that fell across north Jersey on the 31st were not factored into this May average, except for a few stations such as Newark Airport (which registered 3.83" on the 31st alone) that observe at midnight. The last time this situation had a notable impact on monthly rainfall was a daytime heavy rain event on April 30, 2014.

Pages

Subscribe to Front page feed