Flood

Turn! Turn! Turn!: September 2023 Recap
October 9, 2023 - 2:32pm -- Dave Robinson

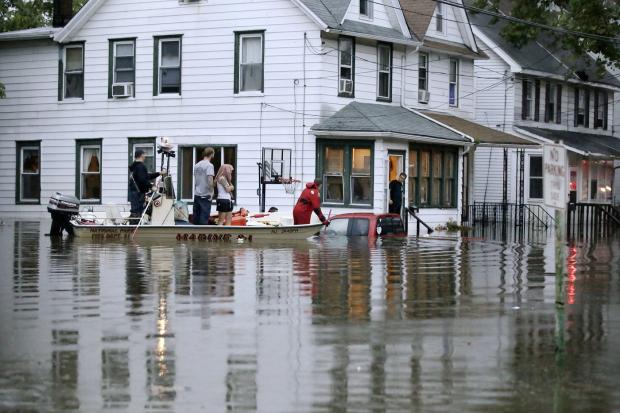
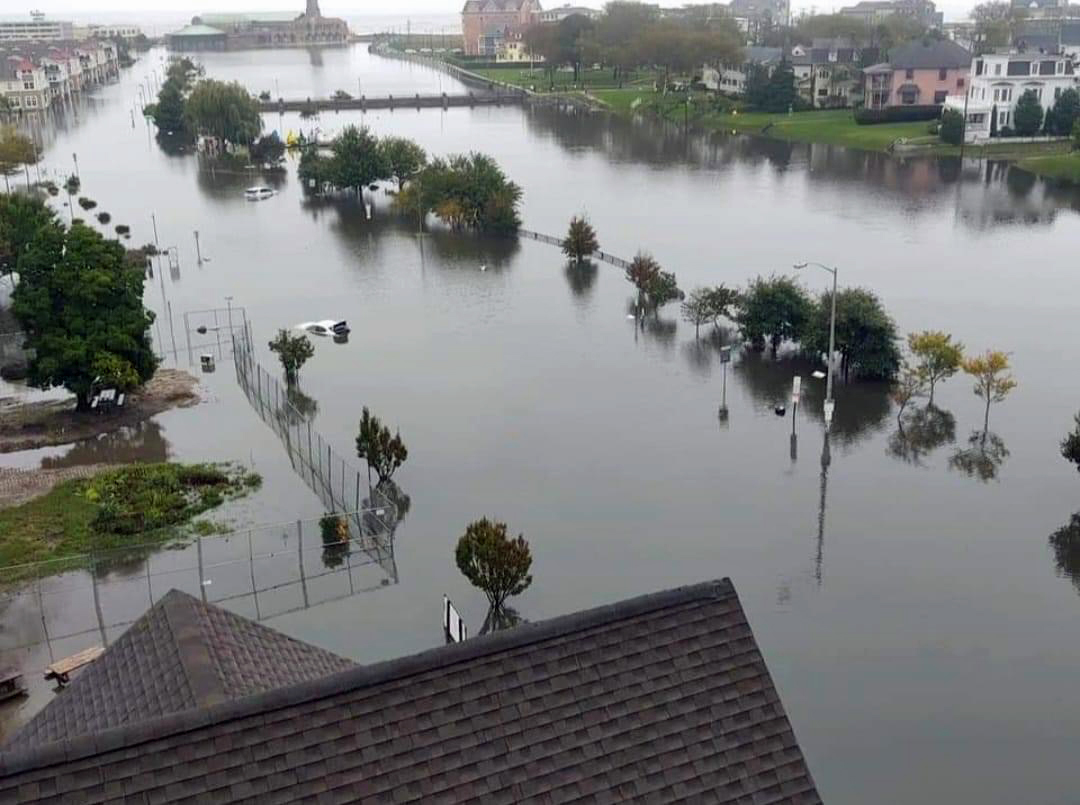
Flooding of Wesley Lake on the border of Asbury Park and Ocean Grove (Monmouth County) on September 29th. Submerged cars are located on aptly named Lake Avenue. (Photo courtesy of S. Isk).

Fall and spring months are considered to be seasonal transition ones. At times, the change of season takes place rather slowly. Then there are months like this past September when the turn is quite abrupt. September 2023 began with the hottest day and week of 2023. Several rainy periods, some with severe storms, ensued as temperatures began to decline and Hurricane Lee, while remaining far offshore, brought rough surf and some clouds to NJ. Soon after came chilly conditions with the remnants of Tropical Storm Ophelia twice bringing heavy rain into portions of the state and over a week of minor to occasional moderate coastal flooding at times of high tide.

Statewide, the average temperature of 68.1° was 1.2° above the 1991–2020 normal. This ranked as the 16th warmest September since records commenced in 1895. The average high temperature was 77.4°, which 0.2° above normal and ranks 35th warmest. The average low temperature of 58.8° was 2.2° above normal, ranking 8th warmest. The northern climate division averaged 65.8° above (+0.9°, 21st warmest), southern +69.5° (+1.4°, 14th warmest), and coastal 69.9° above (+1.2°, 14th warmest).

September rainfall was excessive, with the southwest and northwest the driest regions of the state yet averaging above the statewide 30-year normal. The wettest area was along the northern coast with rainfall as much as 3 to 4 times above the climatological mean. Statewide, September precipitation averaged 7.55”, which is 3.39” above normal and ranks as the 9th wettest. The northern division averaged 7.73” (+3.27”, 11th wettest), southern 7.38” (+3.39”, 11th wettest), and coastal 8.01” (+4.12”, 3rd wettest).

Unprecedented: September 2021 Recap

October 11, 2021 - 4:38pm -- Dave Robinson

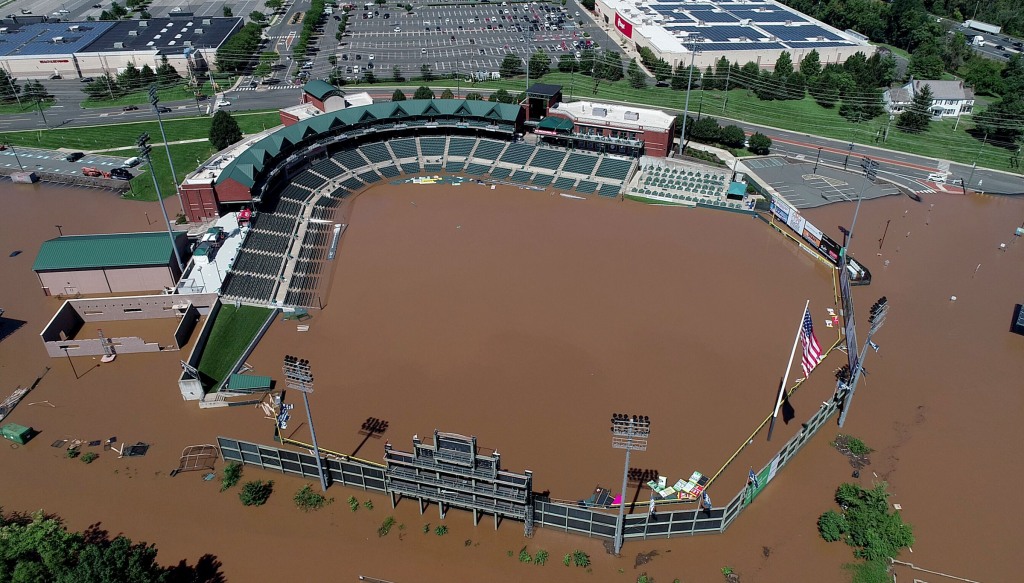
A flooded TD Bank Ballpark in Bridgewater (Somerset County) on September 2nd following the staggering rainfall caused by the remnants of Ida. Photo by Thomas P. Costello and Tariq Zehawi/USA Today Network.

Post-tropical storm Ida. The title of this month’s report speaks to this momentous weather extreme that will forever be the defining event of this month and likely the entire year. The storm delivered the most powerful tornado to strike the Garden State since 1990, demolishing multiple homes in Gloucester County. Rainfall exceeding 3.00” per hour led to the most widespread flash flood event on record for the state, resulting in the tragic deaths of 30 individuals in central and northeastern locales. A separate report on Ida has been prepared and may be accessed in the "News" menu.

There were 29 other days of weather this month that fortunately were not as dramatic as Ida on the 1st. All told, monthly precipitation averaged 6.20” across NJ. This was 2.04” above the 1991–2020 normal and ranks as the 15th wettest September since 1895. The north, where the bulk of Ida’s rain fell, averaged 8.92”, which was 4.46” above normal and ranks 7th wettest. The south averaged 4.61”, which was 0.62” above normal and ties as the 31st wettest. Along the coast, only 3.81” fell, some 0.08” below normal and ranking 44th wettest.

Ida Remnants Strike New Jersey

October 6, 2021 - 2:59pm -- Dave Robinson

Photo of flood debris from business establishments on Main Street in Manville on September 7 (photo credit: M. Holzer).

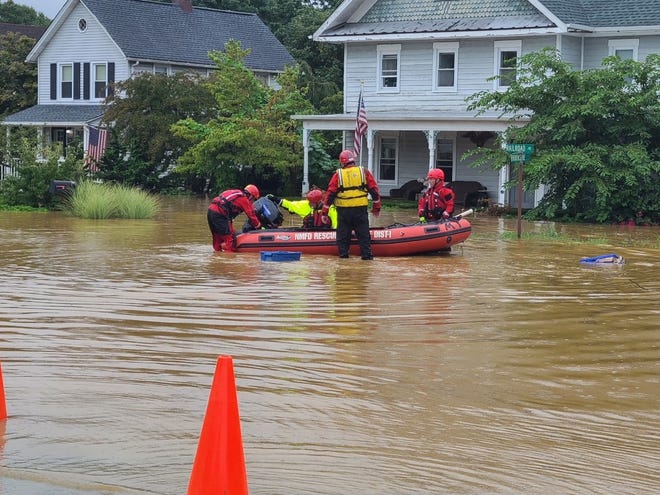
Post tropical storm Ida moved across the Garden State during the afternoon of September 1st into the early hours of the 2nd. It brought with it torrential rainfall, leading to flash and river flooding that took the lives of approximately 30 individuals and the rescue of countless more from raging waters. Additionally, it brought three tornadoes to southwestern and central areas, including the first EF-3 twister to strike New Jersey in 31 years. There were only minor injuries and no deaths from the tornadoes.

Ida developed in the Caribbean, being named a tropical storm on August 26th. From there, it moved northwestward, attaining hurricane status on the 27th as it passed over extreme western Cuba and moved into the Gulf of Mexico. It maintained a steady course as it strengthened into a major category 4 hurricane, making landfall in Louisiana on the 29th with sustained one-minute wind speeds as high as 150 mph. Once inland, winds diminished rather quickly but rainfall associated with the tempest remained heavy as the storm began to curve toward the northeast. This track remained quite steady as the storm weakened to a tropical depression on the 30th and became an extratropical low-pressure system as it approached the central Appalachians. On September 1st, Ida’s remnants merged with an advancing cold front as the system entered the Mid-Atlantic and crossed New Jersey before moving into southeast New England on the 2nd.

Sticky: August 2021 and Summer 2021 Recaps

September 10, 2021 - 6:30pm -- Dave Robinson

Flash flooding and residential evacuations in Helmetta on August 22

Whether the thermometer was reading high or low this August or whether rain was falling or not, one factor that most always had to be considered was the high level of humidity. The “Dog Days” of summer indeed. Of course, there was much else to consider this month, including contributions of rain from two tropical storms, one of which brought the largest crests on some rivers since May 1, 2014, 11 days where one or more locations received at least 2.00” of rain, and 16 days where the high temperature reached 90° or higher somewhere in the state.

Adding up all the rainfall, the statewide monthly average was 6.87”. This is 2.30” above the 1991–2020 normal and ranks as the 15th wettest August since 1895. The northern climate division led the way with 7.89” (+3.33”, 11th wettest), followed by the coastal area with 6.65” (+2.05”, 21st wettest), and the southern division at 6.21” (+1.64”, 27th wettest).

The statewide average temperature of 75.9° is 2.3° degrees above normal and ranks 4th warmest. Seven of the top 10 and 13 of the warmest 20 have occurred this century. The warmth was most strongly a function of elevated nighttime temperatures, which, for NJ, averaged 66.9°. This is 3.6° above normal and ranks 2nd warmest. The maximum temperature averaged 84.9°, some 1.1° above normal and ranks 18th warmest.

Leaning Warm and a Bit Dry, and Once Again, Top-Ten Warmth: August and Summer 2019 Recaps

September 6, 2019 - 2:03pm -- Dave Robinson

Flash flood photo

The summer of 2019 concluded on a warm and a bit dry note when averaged across the Garden State. The warmth was a common theme throughout June to August, while the earlier summer months were on the wet side. The average August temperature of 74.4° was 1.4° above the 1981–2010 mean and is tied with 1983 and 1973 as the 14th warmest since 1895. On 12 days, the temperature topped out at 90° or hotter at one or more Rutgers NJ Weather Network station, but never exceeded 96°. The heat was somewhat tempered by seven mornings with lows in the 40°s at some northwestern NJWxNet locations.

August precipitation averaged 3.75” across NJ. This was 0.35” below normal and ranks as the 52nd driest of the past 125 Augusts. As expected during a summer month that is dominated by hit and miss showers, rainfall totals varied quite a bit, even on a local scale. The driest location in the state was Lambertville in Hunterdon County where 1.48” fell, while the wettest was Lebanon, also in Hunterdon County, with 7.99”. When and where the storms struck, they were, at times, intense. This included small tornadoes and more widespread strong winds, dangerous lightning, and flash flooding.

Mother Nature Picking on Two NJ Communities!: July 2019 Recap

August 4, 2019 - 2:30pm -- Dave Robinson

Thunderstorm wind damage in Holmdel

With 565 incorporated communities in New Jersey, one would think that the odds of multiple significant weather events specific to any one of them within a month would be exceedingly rare. Yet July 2019 brought such a duel scenario to not one but two NJ townships. Mt. Laurel (Burlington County) was visited by two tornadoes, while one rain gauge in Stafford Township (Ocean) caught 5.00” in two separate 24 hour periods. More specifics are provided later in this report. The good news is that, despite damage occurring in each of the four events, there were no fatalities nor reported injuries.

The month as a whole was a wet one, averaging 6.15” across the state. This is 1.58” above the 1981–2010 mean and ranks as the 20th wettest since 1895. Northern counties were wettest, averaging 7.20” or some 2.45” above normal and ranking 16th wettest. The south averaged 5.61”, which is 1.12” above normal and ranks 29th wettest.

Ten of the past 12 months and 15 of the past 18 months have received above-average precipitation across the state. While the 12 months ending in January this year ranks as wettest (66.61”) of 1484 such intervals dating back to 1895, the past 12 month period ending in July comes in second place with 65.74”, just ahead of the 12 months ending in June (65.50”).

Plenty Green: June 2019 Recap

July 8, 2019 - 5:04pm -- Dave Robinson

Flash flood photo

The moist and mild pattern of late spring and early summer has left the Garden State quite green. There is nothing new to this pattern, as the first six months of 2019 totaled 27.22” of rain and melted snowfall, some 4.92” above the 1981–2010 mean, and a 49.0° average temperature, which is 1.3° above average. Each of these ranks 13th highest of the past 125 years.

Even more impressive, the past 12 months have seen 10 wetter than average and 10 warmer than average. The two drier-than-average months (March and April) were closer to their 30-year mean than any of the wetter ones. The precipitation total for the past 12 months is 65.28”. This is the second wettest 12-month period on record out of all 1483 12-month periods dating back to 1895. The wettest was 66.62” for the period ending this past January. The majority of the top 20 such periods have occurred this decade. They have included the two wettest calendar years on record (2018 and 2011) and appear to have lasted longer than earlier wet intervals. Meanwhile, the warmth of the past 12 months (54.5°) would rank as the 9th warmest calendar year but not within the top 20 for any 12-month period.

Summer Personified: July 2018 Recap

August 3, 2018 - 11:45pm -- Dave Robinson

Flash flood photo

July 2018 had a classic variety of summer weather. There was: 1) an ongoing heatwave to begin the month; 2) dry conditions for the most part in the first half of the month; 3) some warm, exceedingly humid conditions with widespread, at times heavy, showers the second half of the month (courtesy of the subtropics); and 4) some “top 10” sunny dry days following several cold front passages (thank you Canada).

The average statewide July temperature was 76.4°. This is 1.8° above the 1981–2010 average and ranks as the 13th warmest July in 124 years of records (2.6° above the full period of record average). Eleven of the 18 warmest Julys since 1895 have occurred in the past 20 years (since 1999). The average daily maximum temperature across the state was 87.2°, which is 2.2° above average and ranks as the 15th warmest on record. The 65.6° average minimum was 1.4° above the 1981–2010 average and comes in as the 17th warmest.

Statewide, August precipitation averaged 5.63”. This was 1.53” above the 1981–2010 average and ranked as the 32nd wettest since 1895. It was the wettest August since the record wettest month in 2011. As is often seen in the summer, the majority of the precipitation fell in scattered showers and thunderstorms. This resulted in a wide range of monthly totals around the state, with some serious flash flooding occurring in several locations when moisture ladened storms parked themselves over an area for multiple hours. Where storms missed time and time again, rainfall totals were below average. The northern NJ climate division (Hunterdon, Somerset, and Union counties northward) saw their 10th wettest August on record, with an average of 8.28” falling. This is 4.17” above average. Since 1990, only August 2011 was wetter in this division.

A Slow Green Up: April 2018 Summary

May 4, 2018 - 2:17pm -- Dave Robinson

Flash flooding photo

If you think it has been a long time since New Jersey experienced as chilly an April as this past one, you are correct. With snow accumulating in a storm on the 2nd to snow showers on the 30th, one was hard pressed to find many days when pleasant spring conditions could be found. Toss in two mid-month days when temperatures soared into the middle 80°s and another with strong thunderstorms delivering flash flood-producing rains, and weather-oriented heads kept spinning. However, overall, it was the persistent chill that captured the most attention, with the green up of lawns and foliage, accompanied by the blossoming of spring flowers, delayed from normal by upwards of two weeks.

Statewide, the April average temperature of 47.7° was 3.2° below the 1981–2010 mean (2.0° below the 1895–2017 mean). This ranks as the 28th coolest April since 1895 and the chilliest since 1982 (also 47.7°). The highest temperature observed in NJ was 87° at Stewartsville (Warren County) on the 14th and the coldest 16° at Walpack (Sussex) on the 11th.

April precipitation across NJ averaged 4.20”. This was 0.21” above the 1981–2010 mean (0.48” above the period-of-record mean). This was the 38th wettest April on record. Plentiful precipitation since February has eliminated drought concerns as we enter the summer water consumption season. Reservoirs and ground water levels are in good shape. However, this never means we should let our guard down and not use water in a responsible manner.

Rainfall Corridors: July 2017 Summary

August 4, 2017 - 4:20pm -- Dave Robinson

Valley fog photo

July 2017 proved to be an active month of weather throughout the Garden State. Time and time again, storms traversed the state, often depositing the heaviest rainfall in 30–40 mile west-to-east “corridors,” while elsewhere totals were much lighter. Such is the nature of showery summer rainfall, although in one case, the swath of heavy rainfall was associated with an out-of-season coastal storm. When all was said and done, rainfall occurred frequently enough to leave most locations with average to well above average monthly totals. The statewide average July rainfall was 6.33”. This is 1.76” above the 1981–2010 average and ranks as the 19th wettest July of the past 123 years. Last year with 6.97” (ranking 13th) and 2004 with 7.51” (ranking 8th) were the most recent Julys to be wetter than this year. The statewide average temperature of 75.5° was 0.9° above average. This ranks as the 22nd warmest July on record. There have been nine warmer Julys since 2002, including last year at 77.1° (ranking 7th).

Pages

Subscribe to RSS - Flood