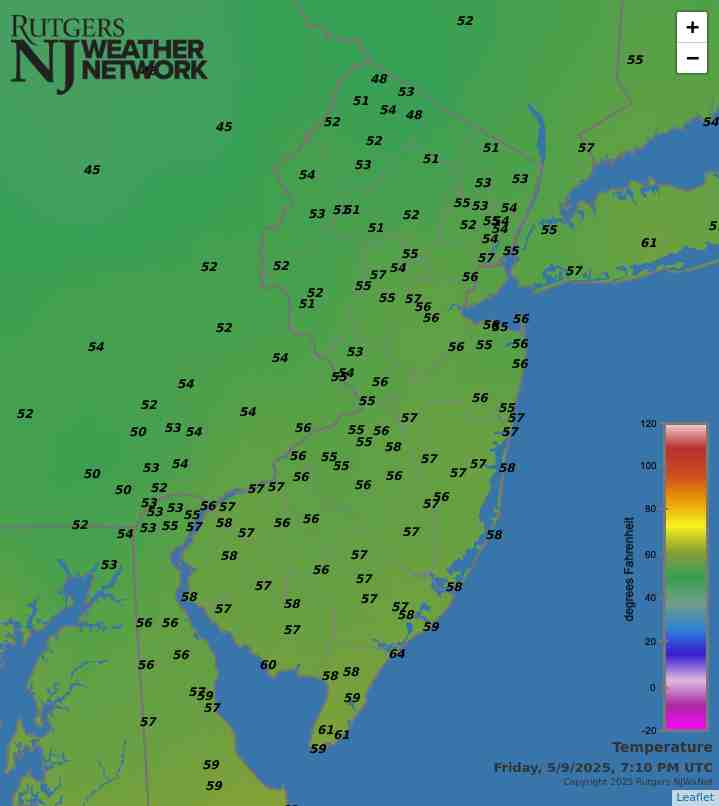
Latest Temperatures

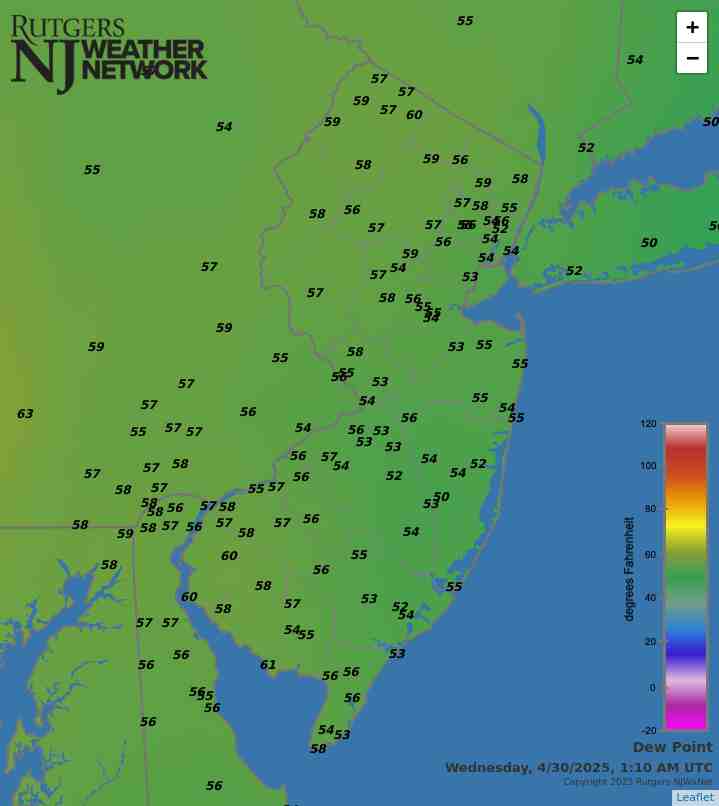
Current Dew Point

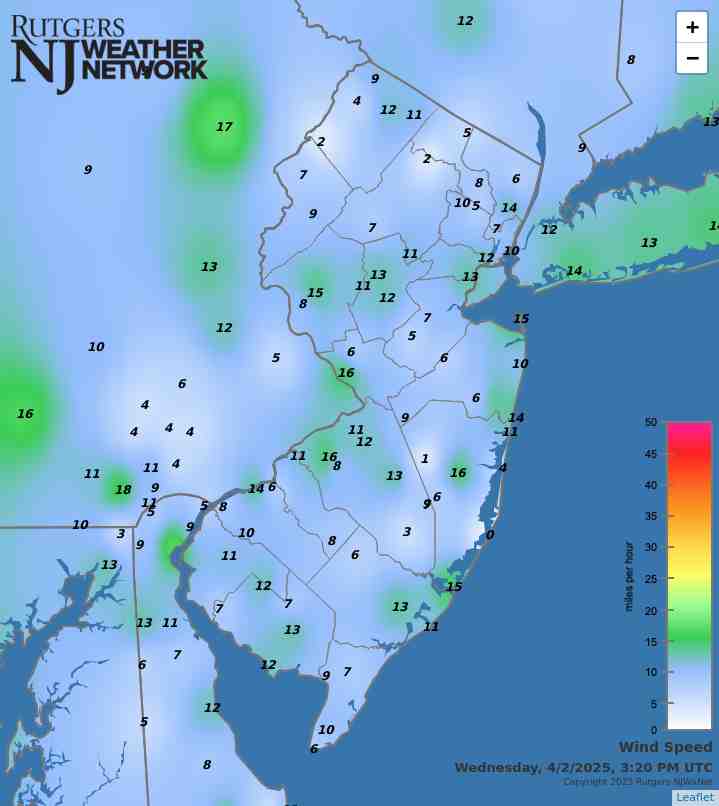
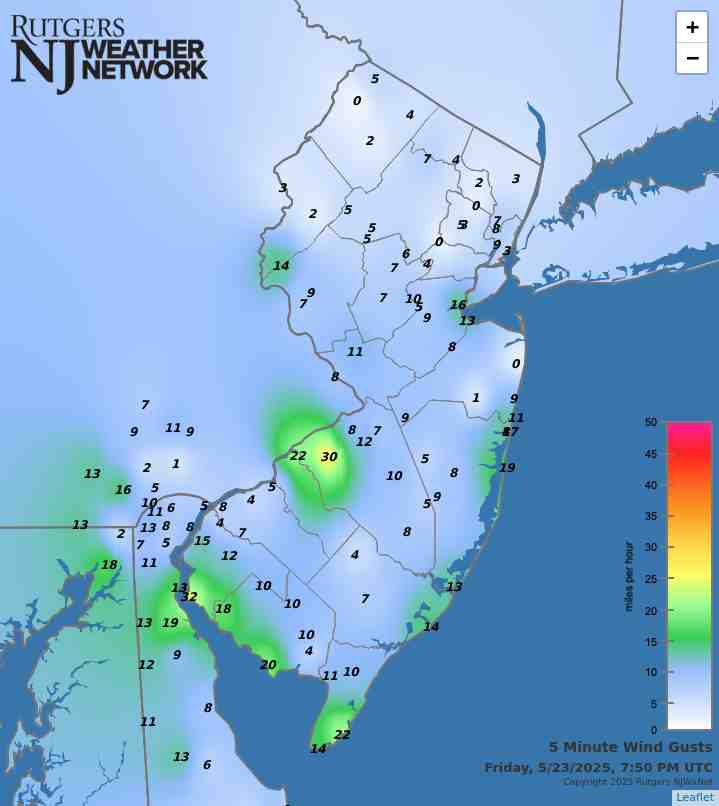
Latest Wind Speeds

Wind Gusts

Top Story

Firefighters battle the Jones Road Wildfire in Ocean County (photo courtesy of the New Jersey Department of Environmental Protection).

If it is weather variety you enjoy, April certainly must have proved rather satisfying. Atmospherically, this was expressed by a cool, wet first half of the month and a warm, dry second half. When all was totaled and averaged, the full month emerged with above-normal temperatures and close-to-normal precipitation. Toss in one northern snow event, considerable wind, lingering drought in some areas, and a major Pinelands wildfire, and there was quite a potpourri of conditions.

Looking first at precipitation, the statewide average of rain and melted snowfall was 3.72”. This was 0.02” above the 1991–2020 normal and ranked as the 62nd wettest April dating back to the start of statewide records in 1895.

April snowfall occurred in a single event that will be discussed below. This resulted in a statewide average of 0.3”, which is 0.2” below normal and ranks as the 37th snowiest April back to 1895. The northern snow division averaged 1.2” (+0.4”, 28th snowiest), while the central and southern divisions did not record snowfall (0.6” and 0.4” below normal, respectively), situations that have occurred during numerous past Aprils.

The statewide monthly average temperature was 53.3°. This was 1.8° above the 30-year mean and ranked as the 12th mildest (3-way tie). Nine of the 16 mildest Aprils in the past 131 years have occurred over the past 23 years.

Latest Extremes

City, State Temp
Fortescue, NJ 64
Lower Alloways Creek, NJ 62
Atlantic City Marina, NJ 62
Dennis Twp., NJ 61
West Cape May, NJ 60
City, State Temp
Sandyston, NJ 39
Hopewell Twp., NJ 41
Pequest, NJ 41
Hackettstown, NJ 41
Hillsborough-Duke, NJ 42
most current information as of May 11 4:05 AM

Latest Conditions & Forecast

New Brunswick, NJ

Rutgers University Meteorology Program

47°F

Wind

2 mph from the WSW

Wind Gust

2 mph from the WSW

Mostly Clear
51 °F
Sunny
77 °F
Mostly Clear
52 °F
Mostly Sunny
79 °F
Slight Chance Showers then Chance Showers
58 °F
Showers Likely
69 °F
Showers Likely
58 °F
Showers Likely
69 °F
Showers Likely
59 °F
Chance Showers
75 °F
Mostly Cloudy
62 °F
Mostly Cloudy then Chance Showers
81 °F
Chance Showers
64 °F
Mostly Cloudy then Chance Showers
83 °F

Overnight

Mostly clear, with a low around 51. Calm wind.

Sunday

Sunny, with a high near 77. Northwest wind 5 to 10 mph.

Sunday Night

Mostly clear, with a low around 52. North wind around 5 mph becoming east in the evening.

Monday

Mostly sunny, with a high near 79. East wind 5 to 10 mph becoming south in the afternoon.

Monday Night

A chance of showers, mainly after 2am. Mostly cloudy, with a low around 58. South wind around 5 mph becoming calm in the evening. Chance of precipitation is 50%. New precipitation amounts of less than a tenth of an inch possible.

Tuesday

Showers likely, mainly after 8am. Cloudy, with a high near 69. Chance of precipitation is 70%. New precipitation amounts between a tenth and quarter of an inch possible.

Tuesday Night

Showers likely, mainly after 2am. Cloudy, with a low around 58. Chance of precipitation is 60%.

Wednesday

Showers likely. Cloudy, with a high near 69. Chance of precipitation is 60%.

Wednesday Night

Showers likely, mainly before 2am. Cloudy, with a low around 59. Chance of precipitation is 60%.

Thursday

A chance of showers. Cloudy, with a high near 75. Chance of precipitation is 40%.

Thursday Night

Mostly cloudy, with a low around 62.

Friday

A chance of showers. Mostly cloudy, with a high near 81. Chance of precipitation is 30%.

Friday Night

A chance of showers. Mostly cloudy, with a low around 64. Chance of precipitation is 40%.

Saturday

A chance of showers. Mostly cloudy, with a high near 83. Chance of precipitation is 30%.

Search by zipcode or city/state for the latest conditions, forecasts, graphs, maps and more nearest to you.

More News

A Robin signals the arrival of spring in Hawthorne (Passaic County) on March 20th. Photo by Judy Kopitar.

Some Marches in past years have kept you guessing when, sometimes even if, spring will arrive. That certainly was not the case this year, nor, for that matter, has it been much so in recent years. With a statewide ranking of tenth warmest, March 2025 was the fourth of the past ten years to rank in the top ten. Eight of the sixteen mildest Marches in the past 131 years have occurred since 2000. Not even a late-season snow event occurred to temporarily stifle spring fever, as no measurable snow was observed anywhere in the state. Spring showers arrived and were plentiful enough to approach...

A blowout tide caused by strong westerly winds on February 18th in Brick Township (Ocean County).

Upon updating a weather friend regarding February conditions that transpired while they were away from the region, he remarked that most of what I reported appeared to have been more along the line of nuisances, while nothing of a blockbuster status occurred. I agreed, as while there were a few plowable events, one soaker (freezing rain at higher elevations), some cold and mild days, and (like in January) quite a few windy days, precipitation and temperatures came in close to normal and not much occurred that will leave lasting memories. In many respects, this applies to the entire winter...

Ice boating on the Navesink River (Monmouth County) on January 24th.

The first month of 2025 was cold, dry, and windy. It was the coldest January since 2014, one of the driest of the past 131 years, dew points dropped below zero or into the single digits on 23 days, and winds gusted to 40 mph or higher on 16 days. No doubt, a profitable outcome for those in the lip balm business! Statewide, precipitation (rain and melted snow) averaged 0.89”. This was 2.60” below the 1991–2020 normal and ranked as the 3rd driest since records commenced in 1895. Quite a difference from last year, when January 2024 came in with 6.20”, the 7th greatest total on record. While...

More News

First Widespread Freeze of the Season

October 19, 2018 - 10:51am -- Dave Robinson

Oct 19 minimum temperature map

This morning was a frosty one, with many NJWxNet locations across the state seeing their first freezing temperatures of the season. The accompanying map shows that most every location away from coastal and urban environs dipped to the freezing point or lower. Walpack (Sussex County), the traditional cold spot in NJ on calm clear nights, was the coldest spot at 24°. Atlantic City Marina (Atlantic) and Lower Alloways Creek, along the Delaware Bay coast in Salem County, were mildest, with lows of 46°. All other NJWxNet sites were no milder than 42°. One of the more interesting cold readings was the 32° minimum at Jersey City (Hudson). This station is located in Liberty State Park, demonstrating that even parkland within urban regions can get awfully chilly on calm, clear nights. However, it is a bit surprising to see this low, given that the station is quite close to the waters of NY Harbor.

Once Again, Summer is Slow to Depart: September 2018 Recap

October 7, 2018 - 8:18pm -- Dave Robinson

Coastal flood photo

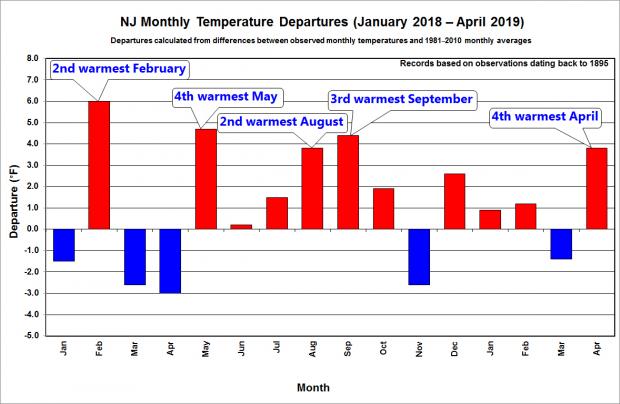
For the fourth consecutive year, summer weather stubbornly hung on well into September across the Garden State. The statewide average temperature of 70.4° was 4.6° above the 1981–2010 mean, and ranks as the third warmest since records commenced in 1895. September 2017, now ranking 11th, sat in the top 10 for just one year before being bumped out by 2018. This September was the fifth consecutive month of above-average temperatures. The past 12 months have seen the 2nd warmest October, 4th warmest May, 1st warmest August (tied with 2016 based on updated figures), and now the 3rd warmest September. The June through September period this year averaged 73.3° (+2.5°), making it the 4th warmest on record. The top 10 such intervals have all occurred since 2005. The August–September average of 73.7° (+4.3°) was the warmest on record, followed by 2005, 2016, 2015, and 2010.

Perhaps what was most interesting about temperatures this past month was the disparity between average maximum and minimum temperature anomalies. The average maximum of 77.7° was 1.4° above average and ranked 27th warmest. However, the average minimum of 63.2° was 7.9° above average and is a whopping 2.2° milder than the previous highest September average minimum. This came about due to the excessive cloud cover and humidity throughout most of the month, which kept the days from getting too warm and, come nighttime, “trapped” much of the heat gained during the day within the lower atmosphere. Thus, unlike the past three warm Septembers (as well as 2013 and 2014), each of which had below-average precipitation, this year was anything but dry. There were frequent rainy episodes, which at times produced localized deluges and resultant flash flooding. The statewide average rainfall of 7.60” is 3.55” above the 1981–2010 average, and is tied with 1960 as the sixth wettest September since 1895. The wettest September on record remains 1999, which averaged 9.50 inches, in no small part due to Tropical Storm Floyd’s rains. Aside from 1999, you have to go back to 1975 to find a September with more rain than this year.

Green Warmth: August and Summer 2018 Recaps

September 5, 2018 - 8:18pm -- Dave Robinson

Flash flood photo

The summer of 2018 concluded on a warm, wet note across the majority of what was a persistently green Garden State throughout the season. The warmth dated back to late June, with frequent humid conditions and abundant showers from mid-July onward. There will be more on the entire summer at the end of this report. First a look at August, with a statewide average temperature of 76.8° coming in 3.8° above the 1981–2010 average. This was the second warmest August since 1895, falling just behind 2016 by 0.1°. Nine of the 13 warmest Augusts during that 124-year interval have occurred since 2001.

Statewide, August precipitation averaged 5.63”. This was 1.53” above the 1981–2010 average and ranked as the 32nd wettest since 1895. It was the wettest August since the record wettest month in 2011. As is often seen in the summer, the majority of the precipitation fell in scattered showers and thunderstorms. This resulted in a wide range of monthly totals around the state, with some serious flash flooding occurring in several locations when moisture-ladened storms parked themselves over an area for multiple hours. Where storms missed time and time again, rainfall totals were below average. The northern NJ climate division (Hunterdon, Somerset, and Union counties northward) saw their 10th wettest August on record, with an average of 8.28” falling. This is 4.17” above average. Since 1990, only August 2011 was wetter in this division.

Summer Personified: July 2018 Recap

August 3, 2018 - 11:45pm -- Dave Robinson

Flash flood photo

July 2018 had a classic variety of summer weather. There was: 1) an ongoing heatwave to begin the month; 2) dry conditions for the most part in the first half of the month; 3) some warm, exceedingly humid conditions with widespread, at times heavy, showers the second half of the month (courtesy of the subtropics); and 4) some “top 10” sunny dry days following several cold front passages (thank you Canada).

The average statewide July temperature was 76.4°. This is 1.8° above the 1981–2010 average and ranks as the 13th warmest July in 124 years of records (2.6° above the full period of record average). Eleven of the 18 warmest Julys since 1895 have occurred in the past 20 years (since 1999). The average daily maximum temperature across the state was 87.2°, which is 2.2° above average and ranks as the 15th warmest on record. The 65.6° average minimum was 1.4° above the 1981–2010 average and comes in as the 17th warmest.

Statewide, August precipitation averaged 5.63”. This was 1.53” above the 1981–2010 average and ranked as the 32nd wettest since 1895. It was the wettest August since the record wettest month in 2011. As is often seen in the summer, the majority of the precipitation fell in scattered showers and thunderstorms. This resulted in a wide range of monthly totals around the state, with some serious flash flooding occurring in several locations when moisture ladened storms parked themselves over an area for multiple hours. Where storms missed time and time again, rainfall totals were below average. The northern NJ climate division (Hunterdon, Somerset, and Union counties northward) saw their 10th wettest August on record, with an average of 8.28” falling. This is 4.17” above average. Since 1990, only August 2011 was wetter in this division.

Rather Typical: June 2018 Recap

July 5, 2018 - 4:08pm -- Dave Robinson

Sandy Hook from plane

After an ample share of ups and downs throughout the past spring, the weather in June became rather typical for the start of summer. It was drier than average in the north and wetter than usual in the south, with the temperature close to the long-term mean. Fortunately, New Jersey entered the heart of summer with reservoirs full. However, with the onset of an apparent extended period of heat late in the month, it is certainly prudent to conserve water wisely.

The June average statewide temperature of 69.8° equaled the 1981–2010 mean, but is 1.0° above the 1895–present average. This tied with 1906 and 1967 as the 42nd mildest June on record. Precipitation averaged 3.43” across NJ, which is 0.58” below the 1981–2010 mean. This ranks as the 57th driest June, tied with 2011.

Warm and Wet May, and an Action Packed Spring: May 2018 Summary and Spring Recap

June 5, 2018 - 5:16pm -- Dave Robinson

Tree on house

After April timidly transitioned into milder weather, May was plenty bold in the thermal department, on multiple occasions behaving more like summer than late spring. Most NJ residents did not seem to mind the warmth; rather, from the second week onward, it was the frequent episodes of rain, often targeting weekends, which raised the level of crankiness among many! Statewide, this was the 5th warmest May since records commenced in 1895. The 65.0° average was 4.5° above the 1981–2010 mean. Five of the ten warmest Mays have occurred since 2004. In most locations, rain fell on at least half of the days of the month. The 5.96” average across NJ was 1.97” above the 1981–2010 mean. This ranks as the 13th wettest May on record, but 0.55” below last year’s average.

A Slow Green Up: April 2018 Summary

May 4, 2018 - 2:17pm -- Dave Robinson

Flash flooding photo

If you think it has been a long time since New Jersey experienced as chilly an April as this past one, you are correct. With snow accumulating in a storm on the 2nd to snow showers on the 30th, one was hard pressed to find many days when pleasant spring conditions could be found. Toss in two mid-month days when temperatures soared into the middle 80°s and another with strong thunderstorms delivering flash flood-producing rains, and weather-oriented heads kept spinning. However, overall, it was the persistent chill that captured the most attention, with the green up of lawns and foliage, accompanied by the blossoming of spring flowers, delayed from normal by upwards of two weeks.

Statewide, the April average temperature of 47.7° was 3.2° below the 1981–2010 mean (2.0° below the 1895–2017 mean). This ranks as the 28th coolest April since 1895 and the chilliest since 1982 (also 47.7°). The highest temperature observed in NJ was 87° at Stewartsville (Warren County) on the 14th and the coldest 16° at Walpack (Sussex) on the 11th.

April precipitation across NJ averaged 4.20”. This was 0.21” above the 1981–2010 mean (0.48” above the period-of-record mean). This was the 38th wettest April on record. Plentiful precipitation since February has eliminated drought concerns as we enter the summer water consumption season. Reservoirs and ground water levels are in good shape. However, this never means we should let our guard down and not use water in a responsible manner.

The Lion Roared All Month Long: March 2018 Summary

April 7, 2018 - 3:04pm -- Dave Robinson

While the first and last few days of the month came in disguised as a lamb, March 2018 was a roaring lion on many occasions. Three nor’easters pounded New Jersey, with a fourth grazing the state, turning more of its wrath on southeastern New England. In true nor’easter fashion, the storms brought minor to moderate coastal flooding, significant beach erosion, powerful winds, heavy rain, and record- to near-record-breaking snowfall. This led to two of the larger power outages since Sandy in 2012, numerous traffic accidents, significant tree damage, frequent school closings, and even someone being injured by lightning during a snowstorm.

Since When Did February Become March?: February 2018 Summary and Winter 2017/2018 Recap

March 6, 2018 - 5:11pm -- Dave Robinson

Snow photo

While the title of this report is guilty of some exaggeration, by just looking at the temperatures across New Jersey the past two Februaries you would not be far off the mark. The mildest February by far occurred in 2017 (40.4°), while this past February 2018 came in second mildest at 39.2°, just edging out 1998. This was 5.8° above the 1981–2010 mean and an impressive 8.3° above the 1895–present mean. The difference between mean periods further illustrates how Februaries in recent decades have been milder overall than earlier in the 20th century. So does the fact that February 2018 was milder than 62 of the past 123 Marches (February 2017 was milder than 70 Marches).

Not to be ignored due to February’s warmth, monthly precipitation certainly delivered in an impressive manner. The average statewide rainfall of 5.97” ranks as the third wettest on record. This is 3.17” above the 1981–2010 mean (2.87” above the period of record mean) and is the wettest February in well over 100 years.

Bitter Cold, a Blizzard, and a Thaw: January 2018 Summary

February 5, 2018 - 5:06pm -- Dave Robinson

Great Falls frozen

The first month of 2018 was replete with cold, warmth, snow, rain, and stretches of dry weather. First came an impressive episode of subfreezing conditions that began in late December and extended into the second week of January. This interval included a storm that brought over 10” of snow and blizzard conditions to coastal counties. Next was a heavy rain event accompanied by much warmer air, then later in the month, several scattered rain and snow episodes interspersed with dry conditions and some 60° warmth. Something for most everyone, I suppose you could say!

The statewide January mean temperature was 29.2°. This is 1.5° below the 1981–2010 mean and ranks as the 55th coldest January of the 124 since 1895. It was the coldest January since 2015. Precipitation (rain and melted snow) across NJ averaged 2.69”, which is 0.71” below average for the month. This was the 39th driest on record and the lowest total since 2010. January snowfall across the state averaged 8.3”, which was 1.1” above average. Northern counties averaged 7.9” (-1.4”), central ones 6.9” (-1.0”), and the south on top with 9.2” (+3.4”). Through January, this snow season has brought an average of 17.0” (+4.1”) to New Jersey, with the north at 16.6” (-0.8”), central 14.7” (+0.3”), and south 17.0” (+4.1”).

Pages

Subscribe to Front page feed