

August Overview
August 2026 was warm and wet across the Garden State. For the first time since March and April 2024, New Jersey recorded back-to-back months of statewide above-average precipitation. The recent wet period comes on the heels of an extended dry stretch of 23 out 26 below-average precipitation months dating back to May 2024 that led to deteriorating drought conditions throughout the state (Figure 1).
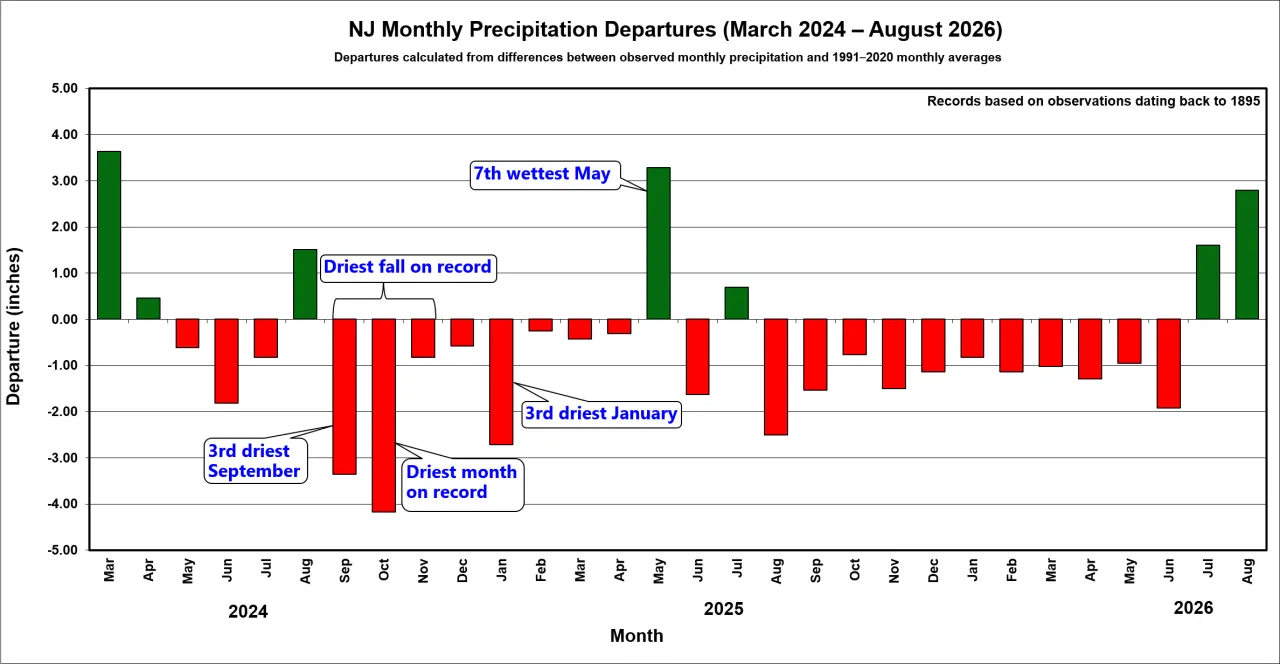
Figure 1. Statewide monthly precipitation departures from NClimDiv relative to the 1991–2020 climatological baseline period. Records are based on observations dating back to 1895.
Since the beginning of August, the rains have largely erased the abnormally dry and moderate drought conditions that existed in the northern and central parts of New Jersey. Drought conditions substantially improved in southwestern New Jersey along the Delaware River. Some improvement also occurred in the coastal counties, which often lag as soil conditions make it more difficult to retain soil moisture. Overall, the percent area of the state marked as either “abnormally dry” or “in drought” through the U.S. Drought Monitor dropped from 100% to 57% over the course of the month (Figure 2).
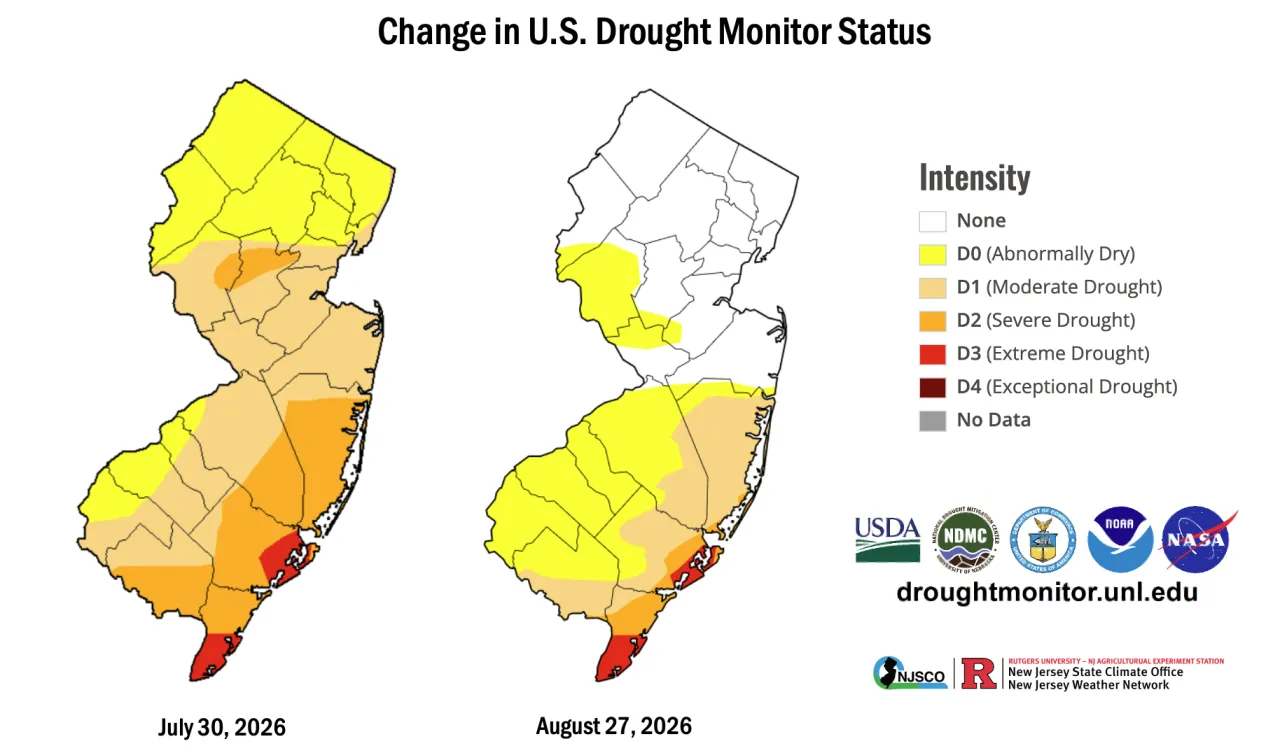
Figure 2. Change in U.S. Drought Monitor status from July 30 to August 27, 2026.
The rains brought marked flash-flood impacts, especially in the urban corridor near New York City. Similar to July, there were 11 stations that recorded 2” of rain in just one hour (Table 1). This amounts to nearly half a month’s worth of rain falling in just 60 minutes. Reports of flooding were a near-weekly occurrence, including high water rescues in Hawthorne (8/3), Rahway (8/5), Harrison (8/20), and Elizabeth (8/27).
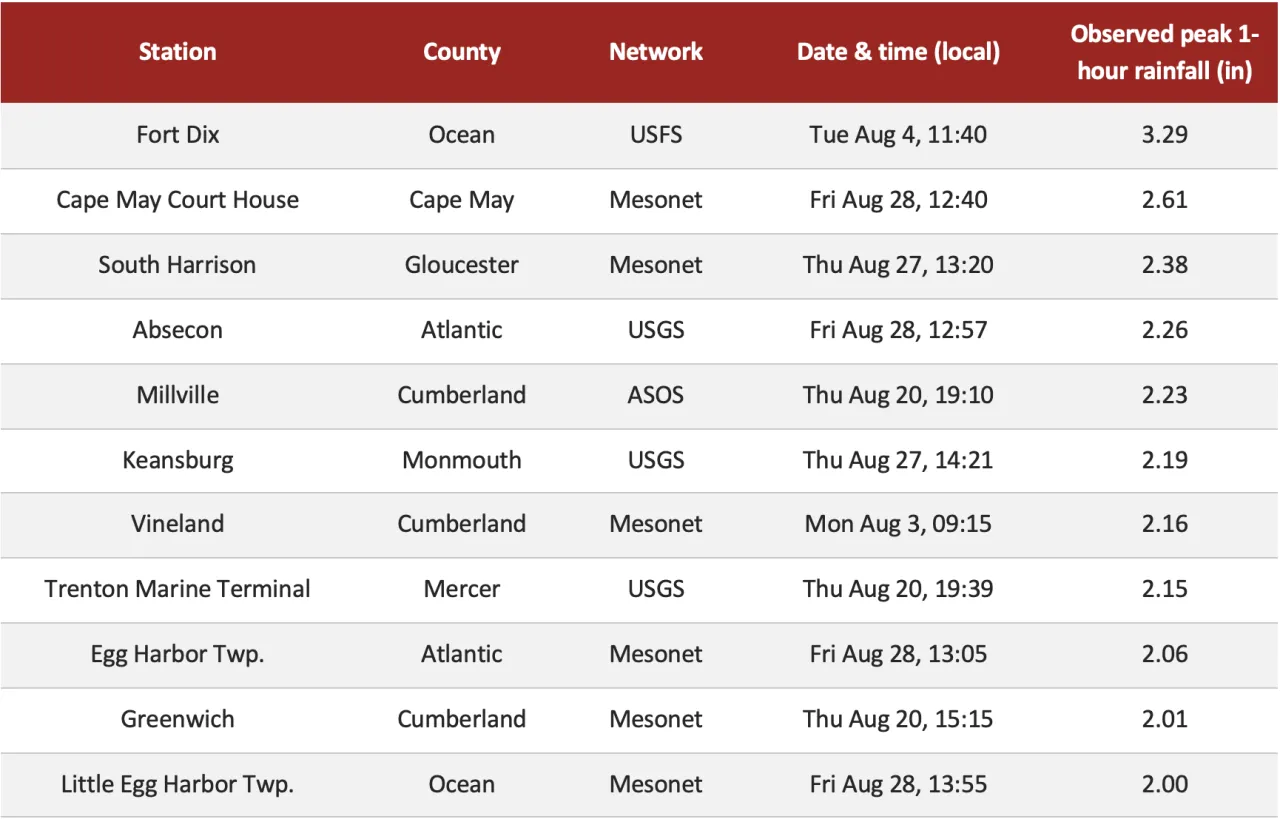
Table 1. Peak 1-hour rainfall amounts observed among NJWxNet, ASOS, USFS, and USGS stations during August 2026.
It was also oppressively humid across New Jersey at times during August. Analysis of hourly average dew points across the NJWxNet stations since 2012 shows that this year has had the most hours with average dew points at or above 75°F of any August. Averaged over 14 long-term stations, the statewide average for the total number of hours throughout August with oppressive dew points was 103, or a little more than 4 days’ worth of extreme humidity (Figure 3). This exceeds the previous maximum of 86 hours (in 2016, 2018, and 2021) and is roughly 2.5 times the average for August (41.6 hours) over the last decade and a half.
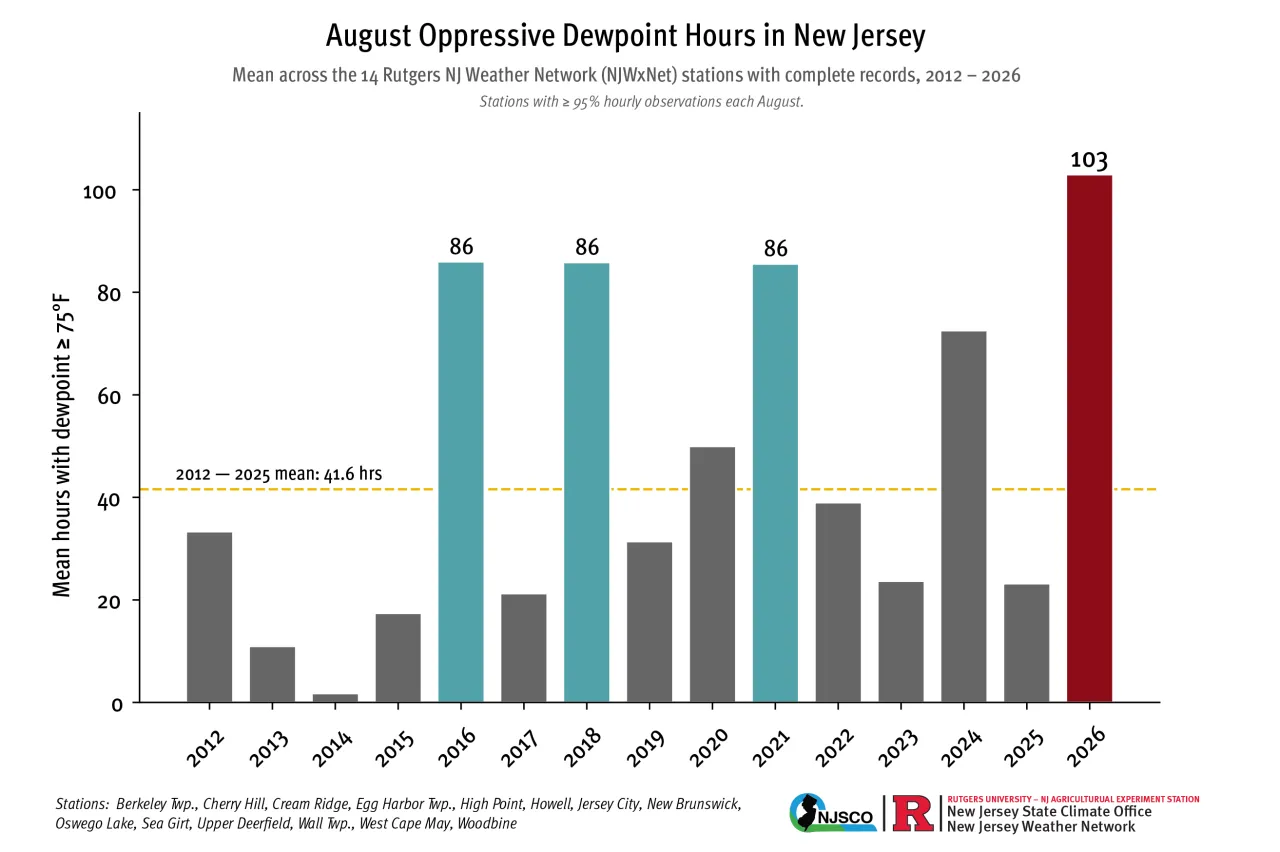
Figure 3. Average number of hours where the hourly average dew point was 75°F or greater, averaged over 14 long-term NJWxNet sites with at least 95% observational coverage since 2012.
Storms and Precipitation
The August statewide average precipitation was 7.36”, which was 2.79” above the 1991–2020 mean and ranked 13th wettest. Similar to July, the Northern division led with 7.73” (3.17” above normal and 12th wettest), followed by the Coastal division at 7.17” (+2.57”, 18th wettest), and then by the Southern division with 7.12” (+2.55”, 17th wettest).
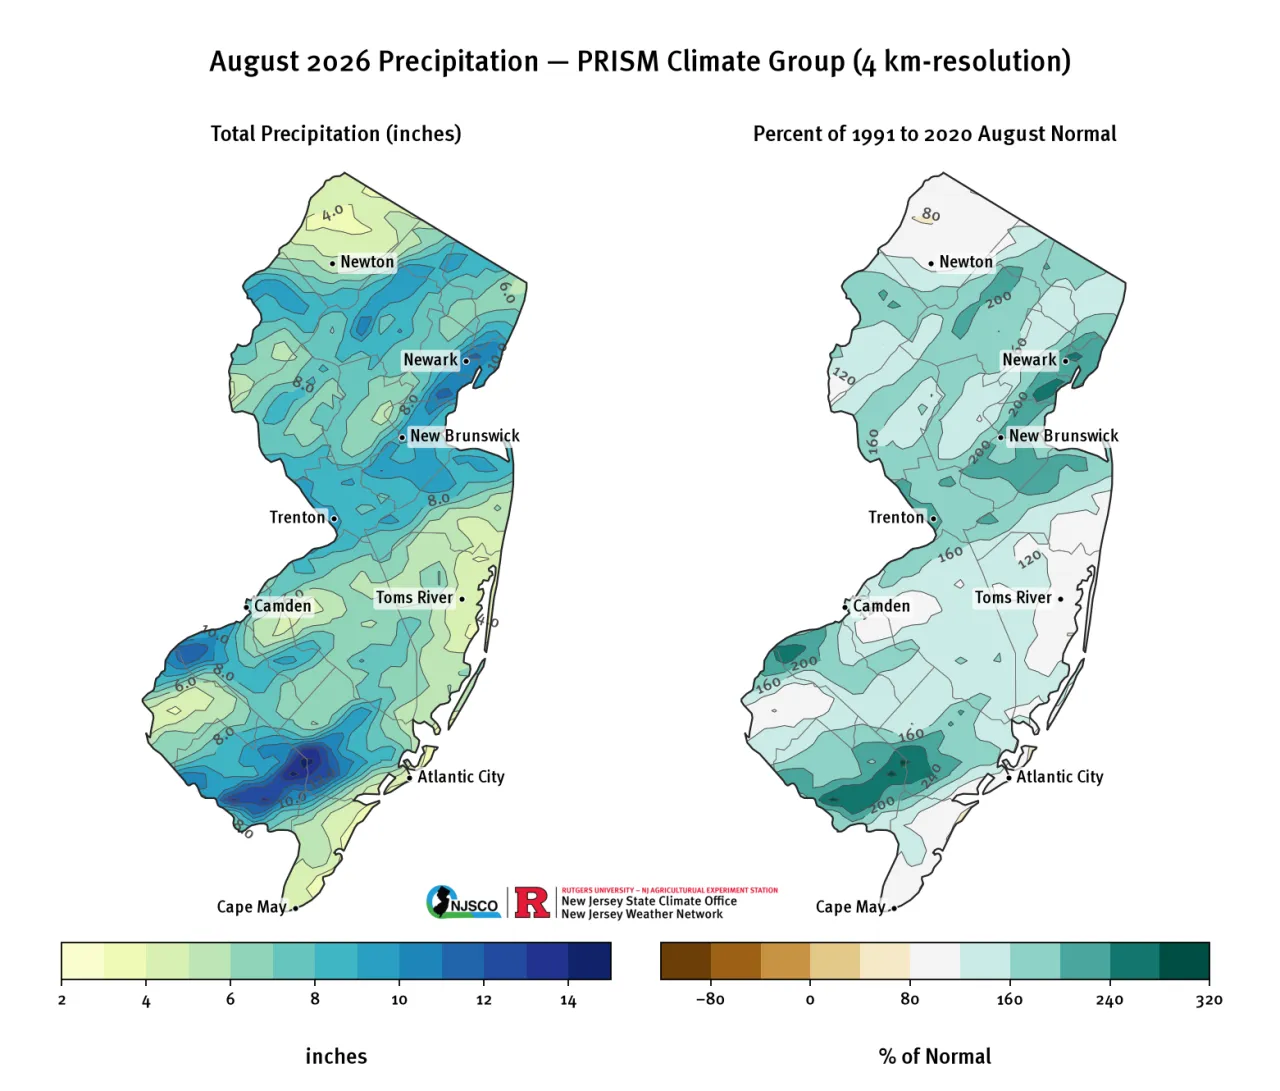
Figure 4. August 2026 total precipitation (left) and percentage of seasonal normal based on the 30-year monthly climatology (right) from PRISM (Oregon State, https://prism.oregonstate.edu).
August 2–3
Heavy rain arrived in New Jersey Sunday night (8/2) and lasted through midday Monday (8/3), leading to another widespread flash-flooding event, especially in the northern part of the state. This event was triggered by a slow-moving, decaying frontal boundary. Places that were hit hard at the end of July saw no reprieve from the heavy rains. Paterson experienced urban flooding once again, and water rescues took place in Hawthorne. Areas along I-95 recorded 2” to 4” of rain with this event. Higher amounts occurred in isolated pockets across South Jersey, leading to localized road closures along US-130 in Pennsauken. Some impressive two-day totals included Estell Manor 5.24”, Collingswood 4.73”, Cinnaminson Township 4.29”, and Willingboro Township 4.10” (Figure 6).
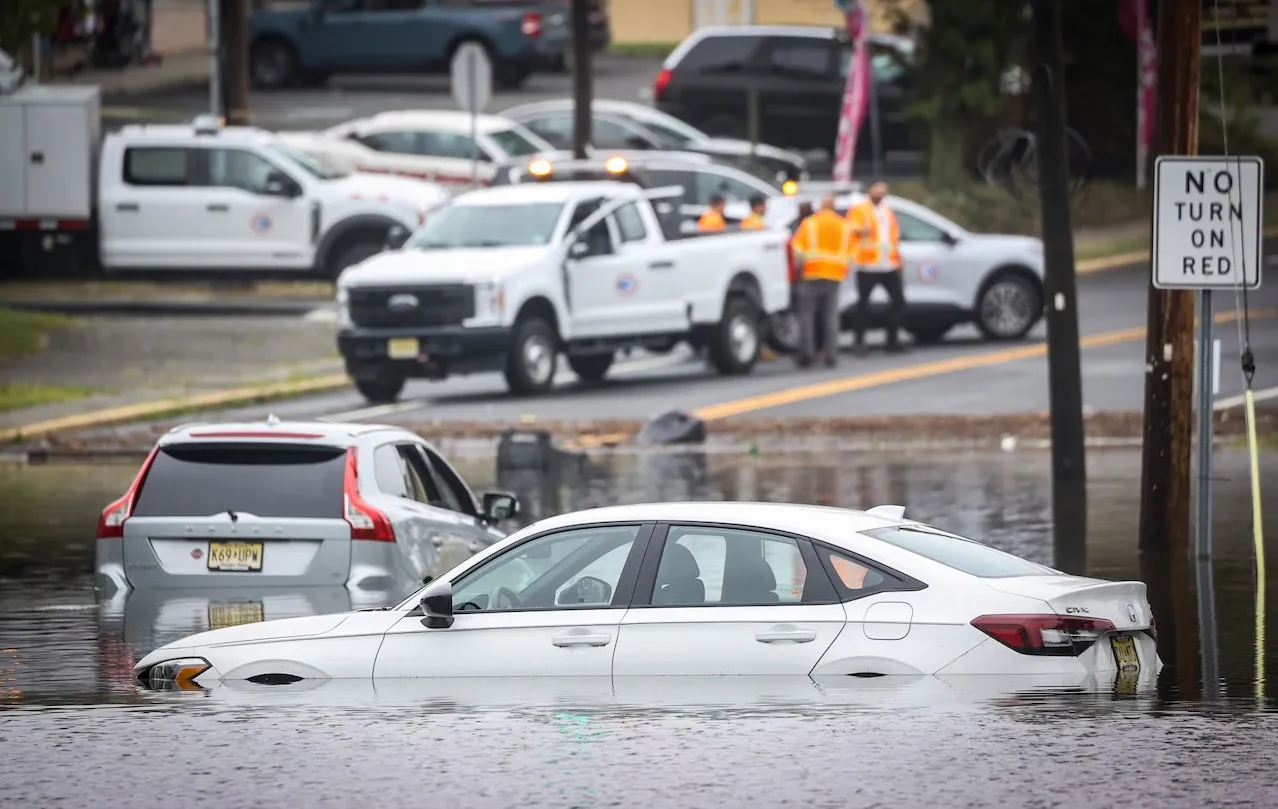
Figure 5. Stranded vehicles in Neptune on Monday, August 3, 2026. Photo by Andrew Mills, NJ.com.
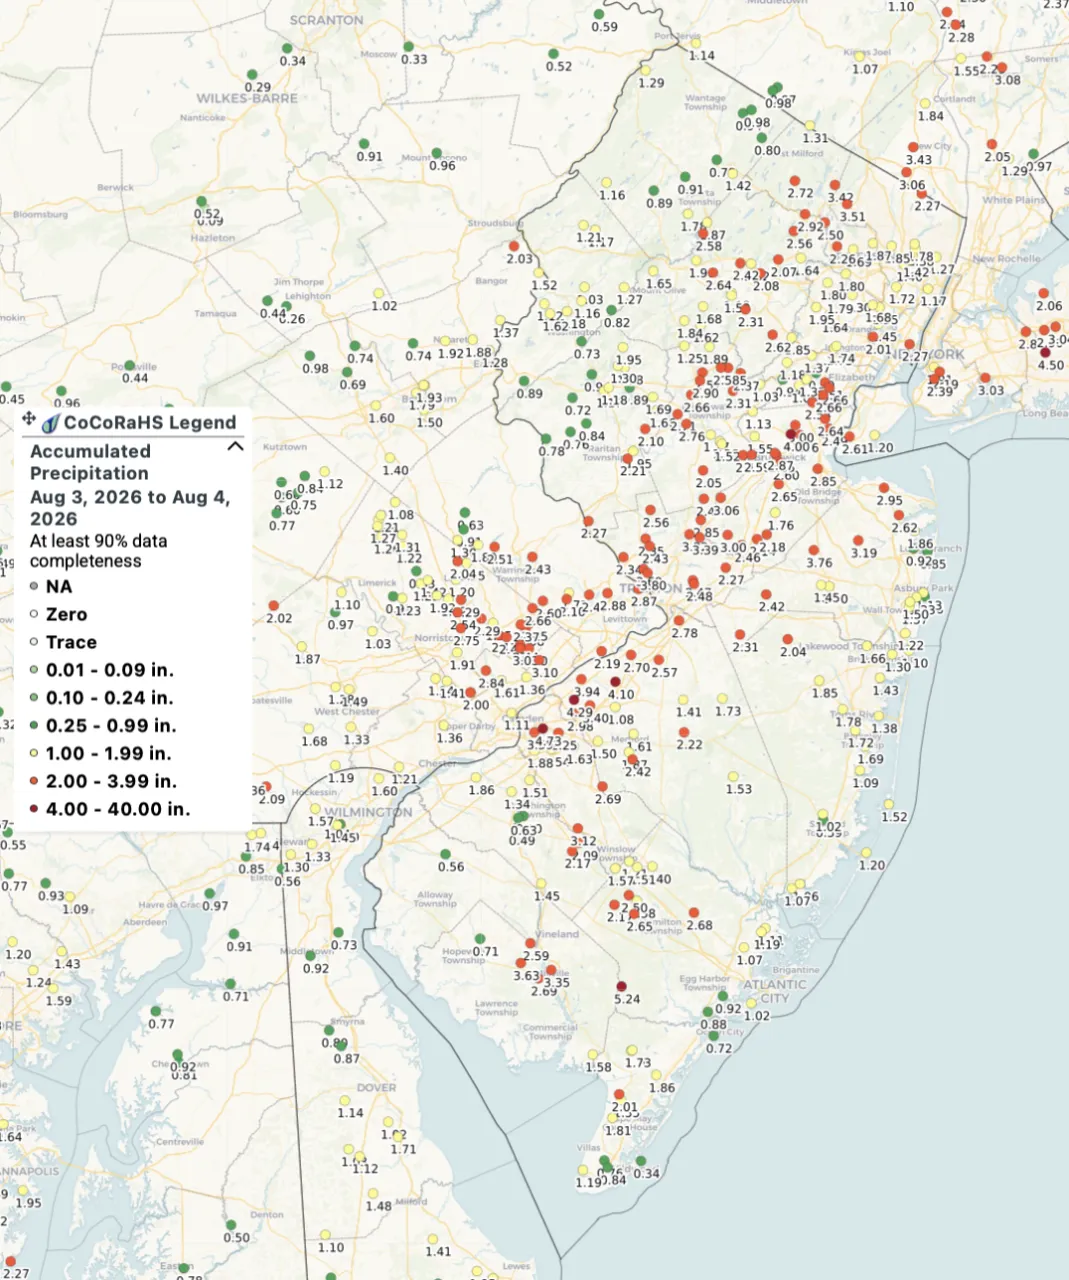
Figure 6. Two-day rainfall amounts from CoCoRaHS reflecting precipitation that fell on August 2 and August 3.
August 5
A warm front lifted north across the state on Wednesday (8/5) and brought more heavy showers and storms. Flash flooding occurred in parts of Camden and Burlington counties in the early afternoon and was more widespread across the central and northern parts of the state by rush hour. Middlesex and Union counties were hardest hit by flooding. Several CoCoRaHS observers reported more than 2” of rain, including Manchester Township (3.08”), Mine Hill Township (2.71”), Rockaway (2.54”), and Clark Township (2.05”).
August 7–8
After an oppressively hot and humid day on Friday (8/7), a squall line developed in the mid-afternoon and ripped across the northern half of New Jersey. The storm resulted in multiple severe weather events statewide. Most of the events were wind damage reports in the northern part of the state. Rainfall amounts were generally between 1” and 2”, with the highest amounts falling in parts of Hunterdon and Morris counties.

Figure 7. A worker was trapped and rescued by neighbors when a tree fell on an Amazon delivery truck in Plainfield, NJ, on August 7, 2026. Photo by Vincent T. Marchese.
More thunderstorms formed on Saturday morning (8/8) over southeastern Pennsylvania and moved east. The storms crossed over South Jersey in the afternoon hours and began to weaken as they encountered a more stable marine layer. Despite their weakening, the storms still produced a few wind damage reports (Figure 8), including a 64-mph wind gust at the NJWxNet station in Little Egg Harbor and 51 mph at both Fortescue and Lower Alloways Creek.
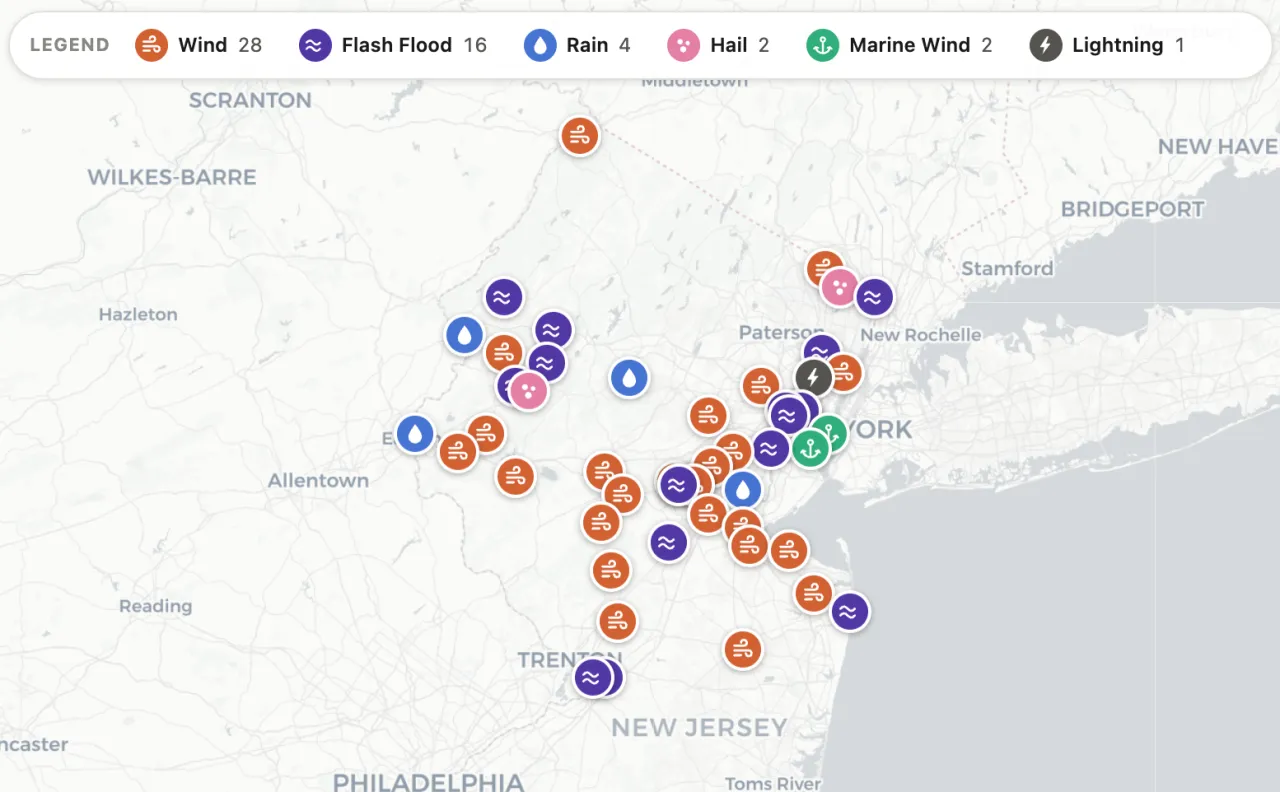
Figure 8. Local Storm Reports (LSRs) from 8 AM EDT August 7 through 8 AM EDT August 9 compiled from both the Mount Holly, NJ (PHI) and Upton, NY (OKX) National Weather Service Forecast Offices.
August 10–13
A slow-moving cold front triggered two lines of showers, one in the morning and the other in the early evening, that moved through the state on Monday (8/10). In both cases, the lines were weakening, resulting in only about 0.10”–0.25” of rain. The front weakened but remained close enough to help fuel scattered showers and storms Tuesday through Thursday (8/11 to 8/13). The storms were mostly confined to the northern half of New Jersey and produced about 0.25” to 0.50” of rain where they occurred.
August 16–18
More widespread rain returned to New Jersey on Sunday (8/16) as another front stalled out over the state. On Monday (8/17), the storms were not as widespread but had localized impacts, especially across Central New Jersey. Two-day rainfall totals were generally between 0.50” and 1.00”. However, parts of Hunterdon, Mercer, and Middlesex counties picked up more than 1.50”, including Princeton (1.63”), Lambertville (1.58”), and Monroe Township (1.58”).
The sea breeze, which mostly had a stabilizing effect on the atmosphere along the coast this summer, turned active and teamed up with the stalled frontal boundary on Tuesday (8/18). The front became the focal point for storm development in the afternoon (Figure 9). Part of Atlantic County generally picked up between 0.25” and 0.75” of rain. Woodland Township saw the most rain, with a total of 1.14”.
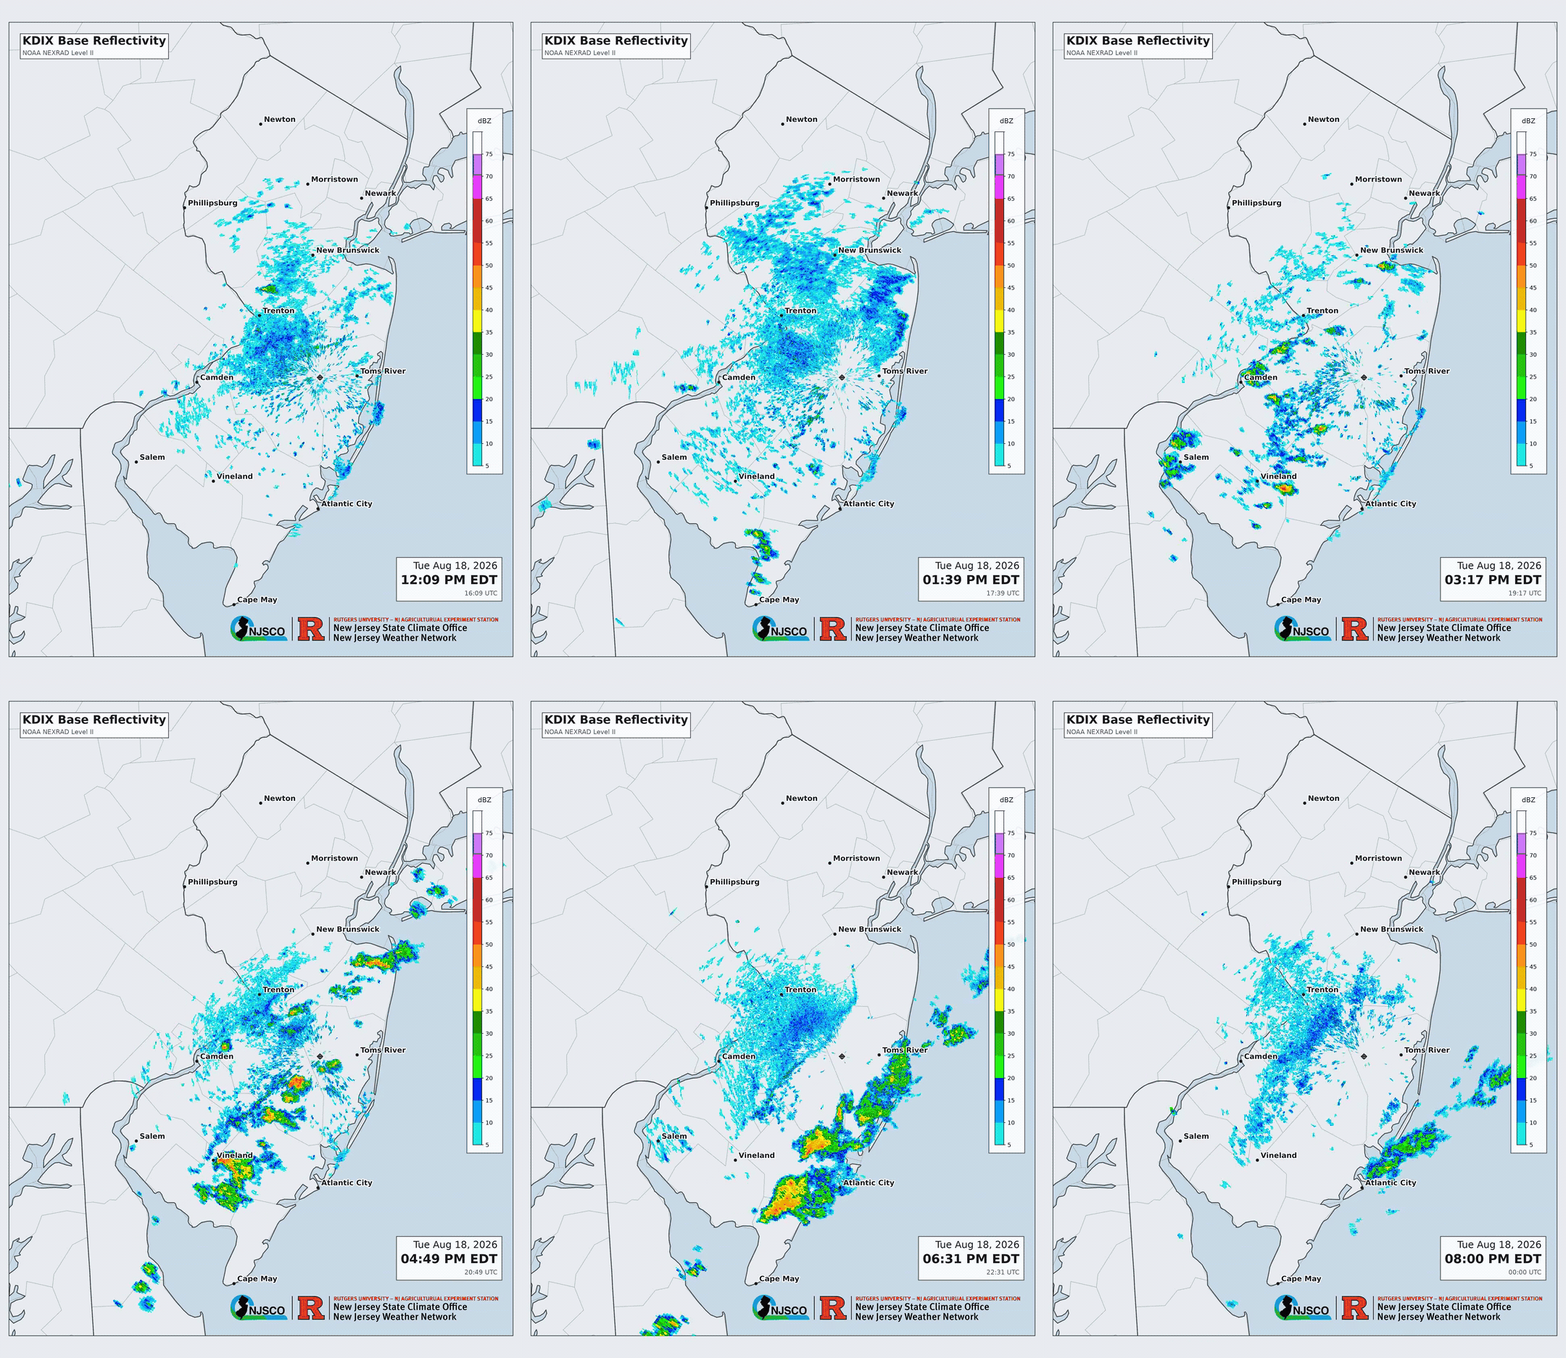
Figure 9. Fort Dix (KDIX) radar animation from the afternoon of Tuesday, August 18, illustrating showers and storms firing along the sea breeze front.
August 20
As a strong cold front approached from the west, New Jersey found itself in a moisture-rich warm sector that contributed to a statewide outbreak of severe weather and flooding rain. Hardest hit with flooding were parts of interior Atlantic and Cumberland counties, where nearly 5” to 6” of rain fell in one afternoon (4.95" at Mays Landing and 5.94" at Estell Manor). Flooding was also prevalent in the urban core, with water rescues in Harrison, Clifton, and Teterboro.
Some southern parts of the state were under tornado warnings through around 7 PM. One confirmed tornado occurred in Atlantic County, touching down in a wooded and marshy area near Estell Manor and lasting only 30 seconds (Figure 10). With no reported damage or injuries, it was classified as EF-Unknown (EFU) by the National Weather Service.
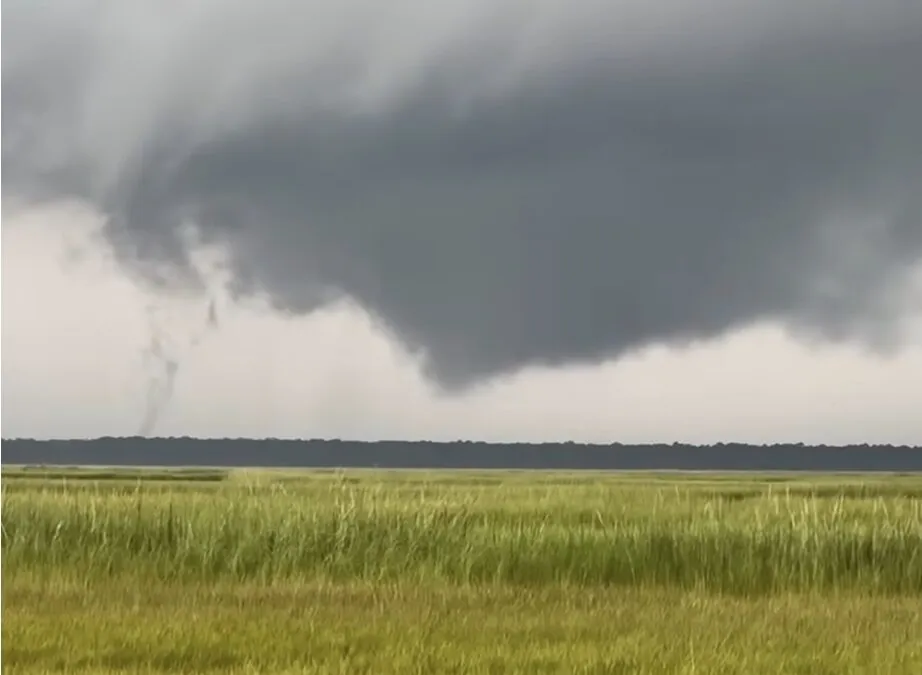
Figure 10. EFU tornado caught on video over Estell Manor on August 20, 2026. Photo courtesy of Dan Forshaw.
August 22–23
Pre-frontal overnight convection brought moderate to heavy rainfall across the state. There were 194 CoCoRaHS stations that reported more than 0.25”, including 18 stations reporting more than 1.00”. The highest amounts were in Cranford Township (1.66”) and Clark Township (1.57”). The rains produced flash flooding just south of Newark Airport in Elizabeth.
August 27–28
Showers and thunderstorms began in the overnight hours of 8/27, especially across Northern New Jersey. The storms persisted through the morning hours before building in Southern and Central New Jersey in the afternoon hours into the evening. The main threats were heavy rain and flash flooding from training thunderstorms, although there were also several reports of wind damage and hail.
The rain was heaviest in Southern New Jersey, especially in parts of Gloucester County. On Thursday, the NJWxNet station in South Harrison recorded 5.30”, Logan Township measured 4.25”, and Sewell reported 4.10”. Thursday’s rain fell during move-in day at Rowan University, disrupting plans and displacing some students. There were reports that Alcyon Lake in Pitman was overflowing its banks and that Mantua Creek reached flood stage. US 322 became impassable through the Mullica Hill section of Harrison Township, where part of the road washed away (Figure 11).

Figure 11. A large hole opened along part of US-322 in Mullica Hill as a result of flooding rains on Thursday, August 27. Photo by WPVI-TV, Philadelphia.
Heavy rain also brought flash flooding to parts of the urban corridor in central New Jersey, including Middlesex, Monmouth, Union, Essex, Bergen, and Hudson counties, where rainfall amounts were generally between 1” and 3”. Across the region, many vehicles were trapped or stalled in floodwaters, including on Route 35 in Keyport, the Garden State Parkway near Exit 125 in Sayreville, US 1 & 9 in Linden, and Route 17 in Hasbrouck Heights. In Elizabeth, water rose to the hoods of cars, and fire crews conducted multiple boat rescues of trapped motorists.
The rain returned again on Friday, 8/28, with the most significant impacts occurring in Atlantic County. Three NJWxNet stations recorded over 2” of rain: Cape May Court House (2.66”), Egg Harbor Township (2.47”), and Little Egg Harbor Township (2.11”). Street flooding with road closures and stranded vehicles was reported near Northfield, the Black Horse Pike west of Pleasantville was impassable due to high water, and flooding closed parts of US 40 in Egg Harbor Township.
Temperatures
August 2026's statewide average temperature of 74.9°F was 1.3° above normal and ranked as the 14th warmest of the past 132 Augusts. The average high of 84.6° was 0.8° above normal, ranking as the 25th warmest, while the average low of 65.2° was 1.9° above normal and 12th warmest. The Northern climate division averaged 72.5° (+0.6°, 25th warmest), the Southern division 76.4° (+1.8°, 10th warmest), and the Coastal division 76.7° (+2.0°, 7th warmest).
New Jersey’s statewide average temperatures ran above normal for the first half of August. The hottest stretch of the month occurred from Friday (8/7) through Tuesday (8/11). On Friday (8/7), 47 NJWxNet stations reported daytime maximum temperatures of 90° or higher, including the month’s highest reading of 96° at both East Brunswick and Berkeley Township. The excessive heat and humidity that day contributed to the instability that drove the Friday afternoon severe weather event.
With the exception of Sunday (8/16) and Monday (8/17), the middle of the month was marked by extended warmth throughout New Jersey. Daily statewide average temperatures were 2° to 5° above the 30-year climatological average (1991 to 2020) throughout this period. The warmth was driven by very warm overnight temperatures in the Southern and Coastal climate divisions. Leftover clouds from daytime convection and excessive humidity prevented the boundary layer from decoupling from the rest of the atmosphere, and nighttime radiational cooling was hardly present in these regions. Overnight minimum temperatures were 5° to 7° above average on Tuesday (8/18) and Wednesday (8/19).
Seasonable-to-below-average temperatures dominated the final third of August across New Jersey. Statewide average temperatures were around 3° below average on Tuesday (8/25) and Wednesday (8/26). The Northern climate division experienced overnight minimum temperatures in the lower 50°s, and the NJWxNet station in Sandyston recorded a low of 49° on Tuesday, 8/25. Another cold front moved through the state during the final weekend of the month, and the strong northwest flow behind it brought drier conditions and temperatures about 4° below average on Sunday (8/30).
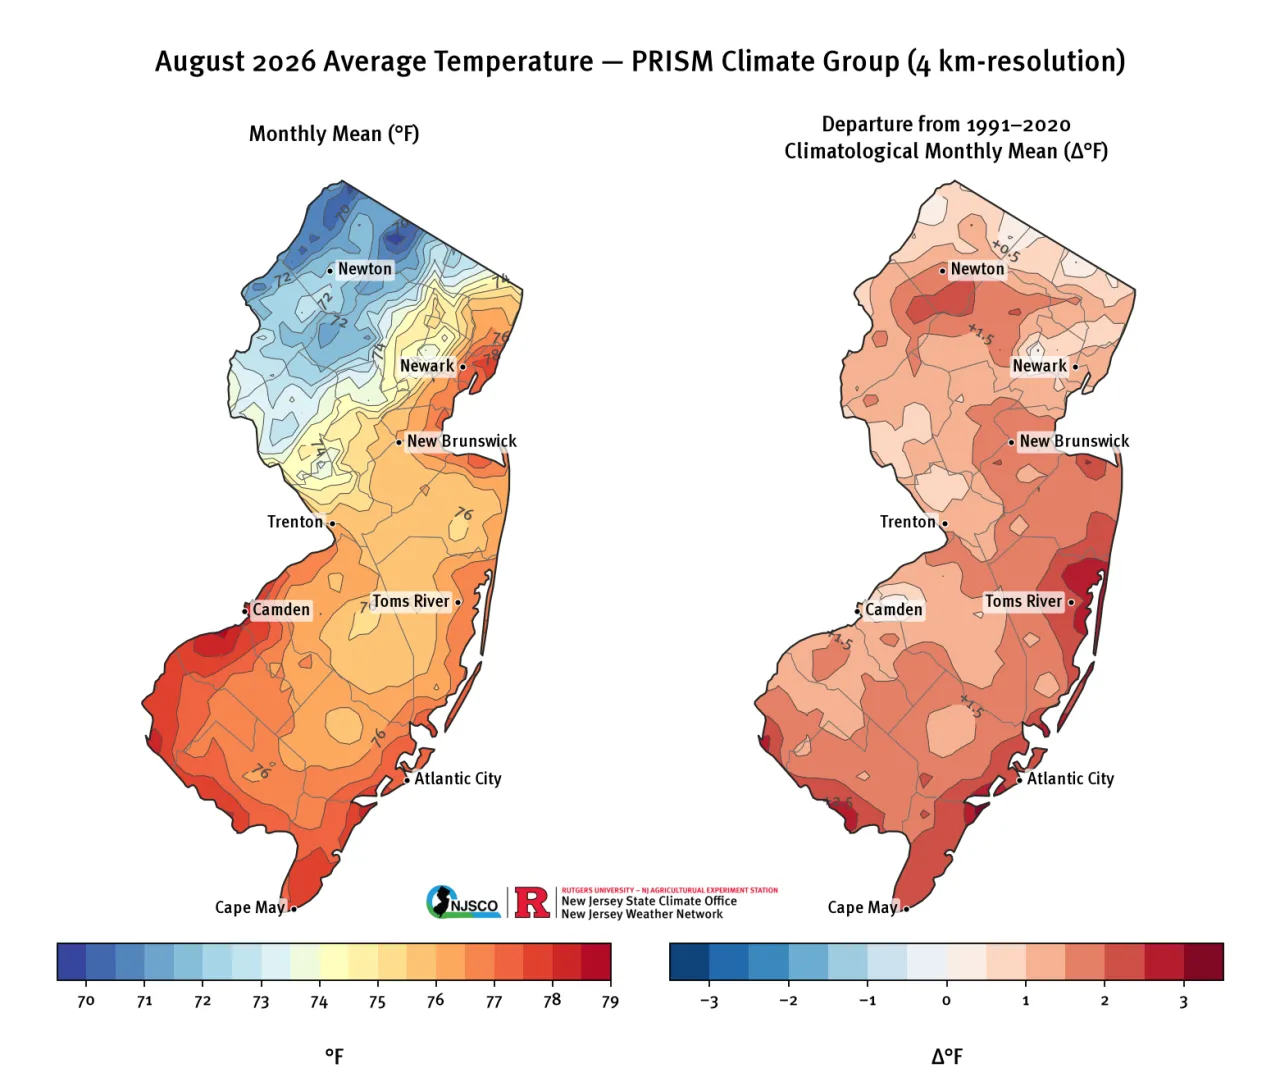
Figure 12. August 2026 average temperature (left) and departure from 30-year monthly climatology (right) from PRISM (Oregon State, https://prism.oregonstate.edu).
Summer 2026 Recap
Temperatures
Statewide temperatures during the summer months (June, July, & August) averaged 74.2°F, which was 1.1°F above the 1991–2020 climatological average and ranked 12th warmest of the past 132. Much of the statewide warm anomaly stemmed from June (+1.6°) and August (+1.3°) anomalies. Despite July having the most intense heatwave of the summer around Independence Day, July’s overall statewide temperature anomaly was only +0.4°.
For the season, the Northern division anomaly was +0.7°, the Southern division anomaly was +1.4°, and the Coastal division anomaly was +1.6°. The Coastal Division warm anomalies stand out from the rest of the state and were driven by the lack of radiational cooling in the overnight hours. Warmer-than-average ocean water temperatures also contributed to warmer temperatures in the Coastal climate division. The summer (JJA) three-month sea surface temperature anomaly along the coastal shelf (waters shallower than 100 m, excluding Long Island Sound, and the Chesapeake and Delaware Bays) was 1.1° above the 1991–2020 climatological average. This year’s anomaly ranked 11th warmest and August ranked 5th warmest since 1982.
South Jersey and the urban corridor saw the most 90°-plus days this summer. Atlantic City Airport in Pomona led the way with 24 days, tying 2006 and 2021 and ranking 14th-most since 1944. Illustrating the contrast between inland and coastal areas, the Atlantic City Marina recorded the fewest 90° days, at 7.
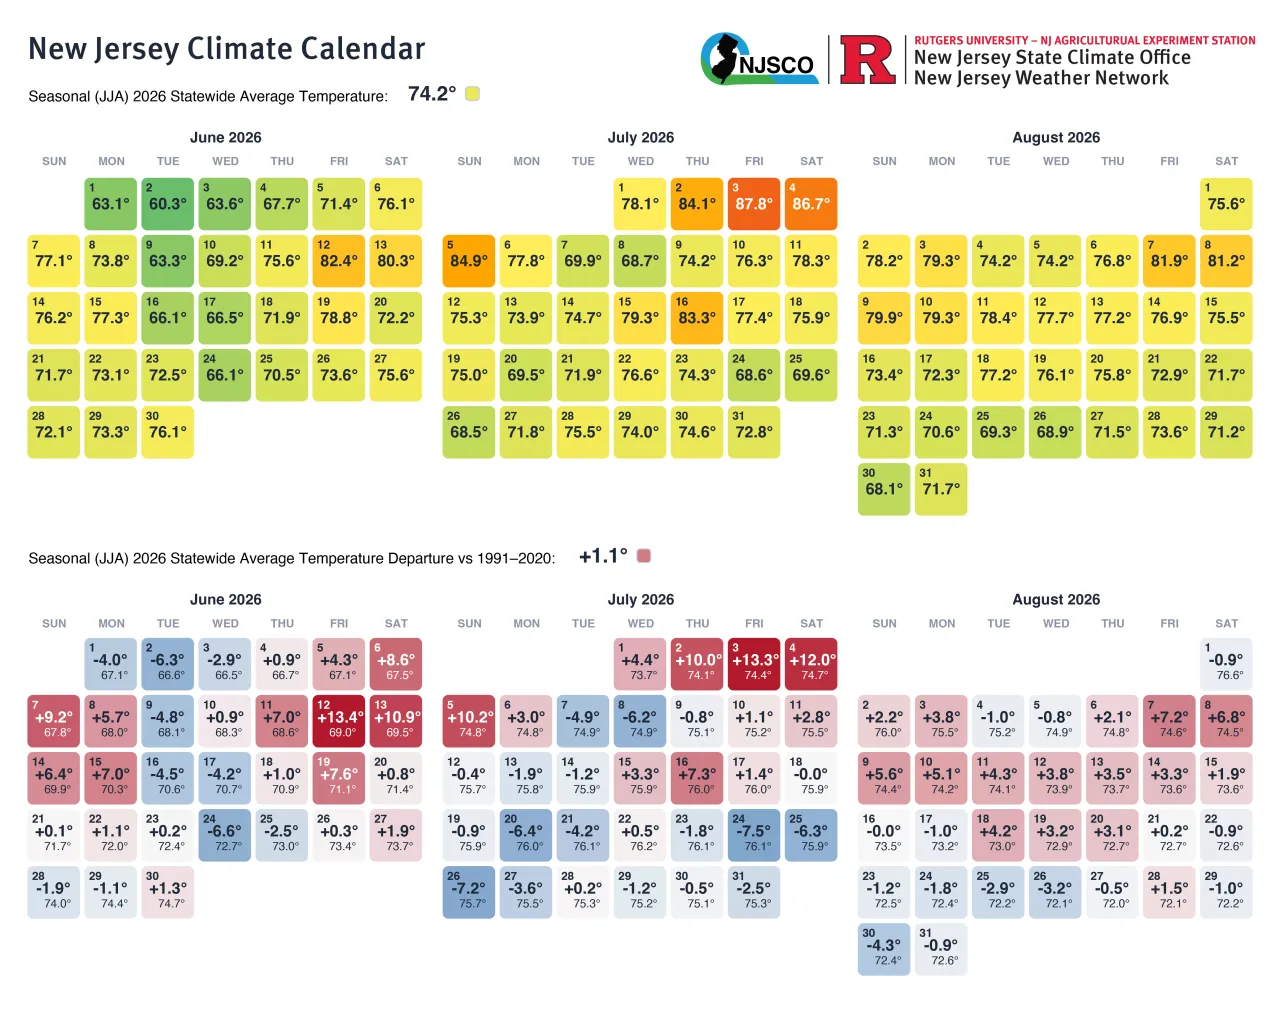
Figure 13. Summer (JJA) 2026 New Jersey Climate Calendar for statewide average temperature (top) and statewide average temperature departure from the 1991–2020 climatological average (bottom). Data source: NOAA NCEI nClimGrid-Daily.
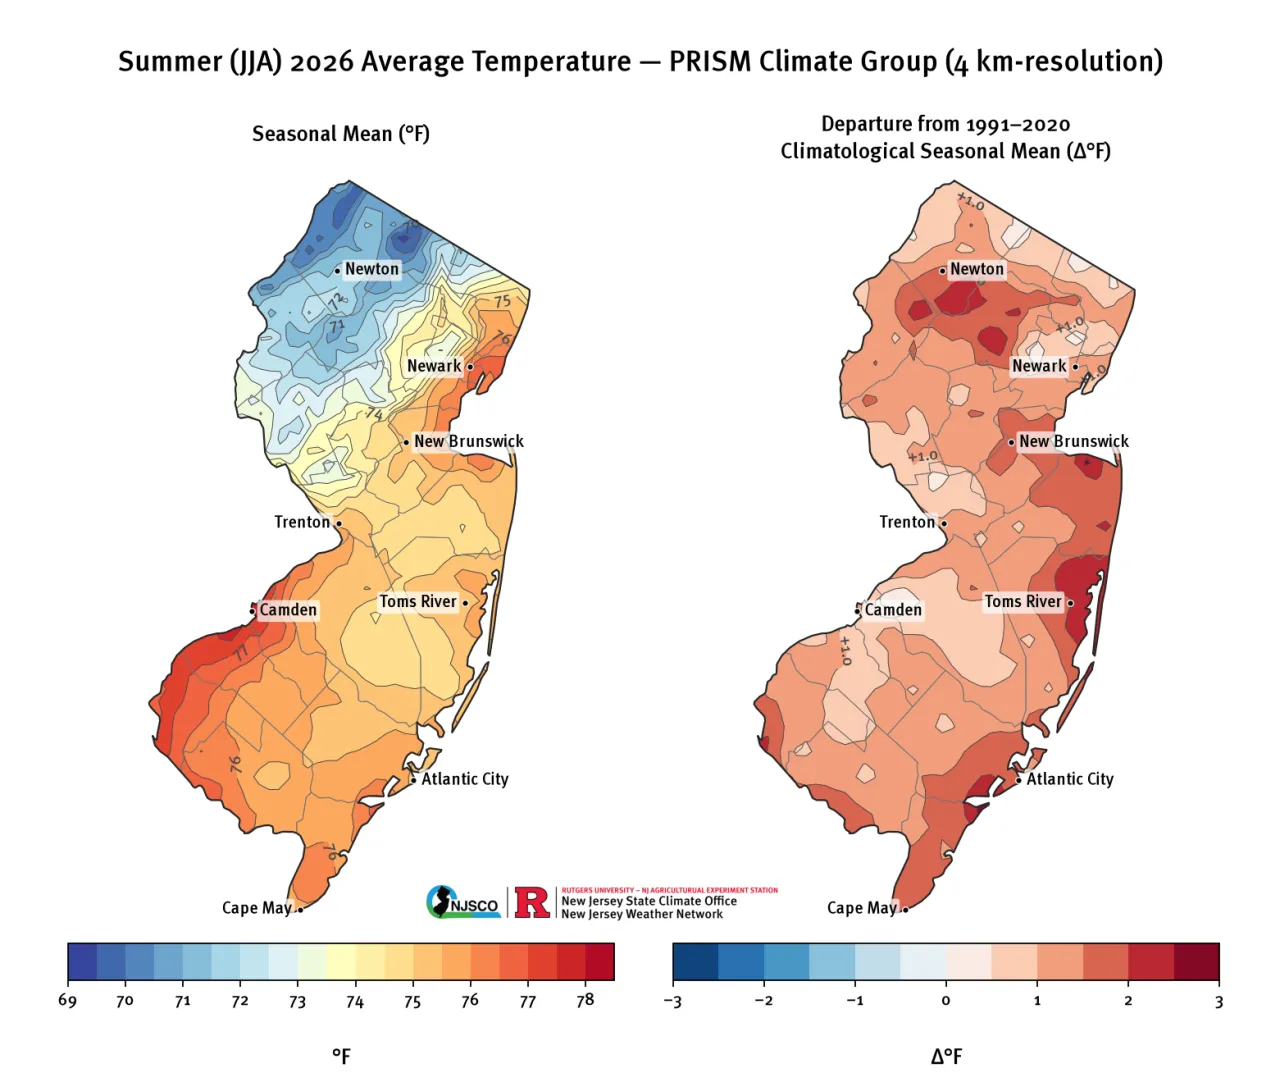
Figure 14. Summer (JJA) 2026 average temperature (left) and departure from 30-year monthly climatology (right) from PRISM (Oregon State, https://prism.oregonstate.edu).
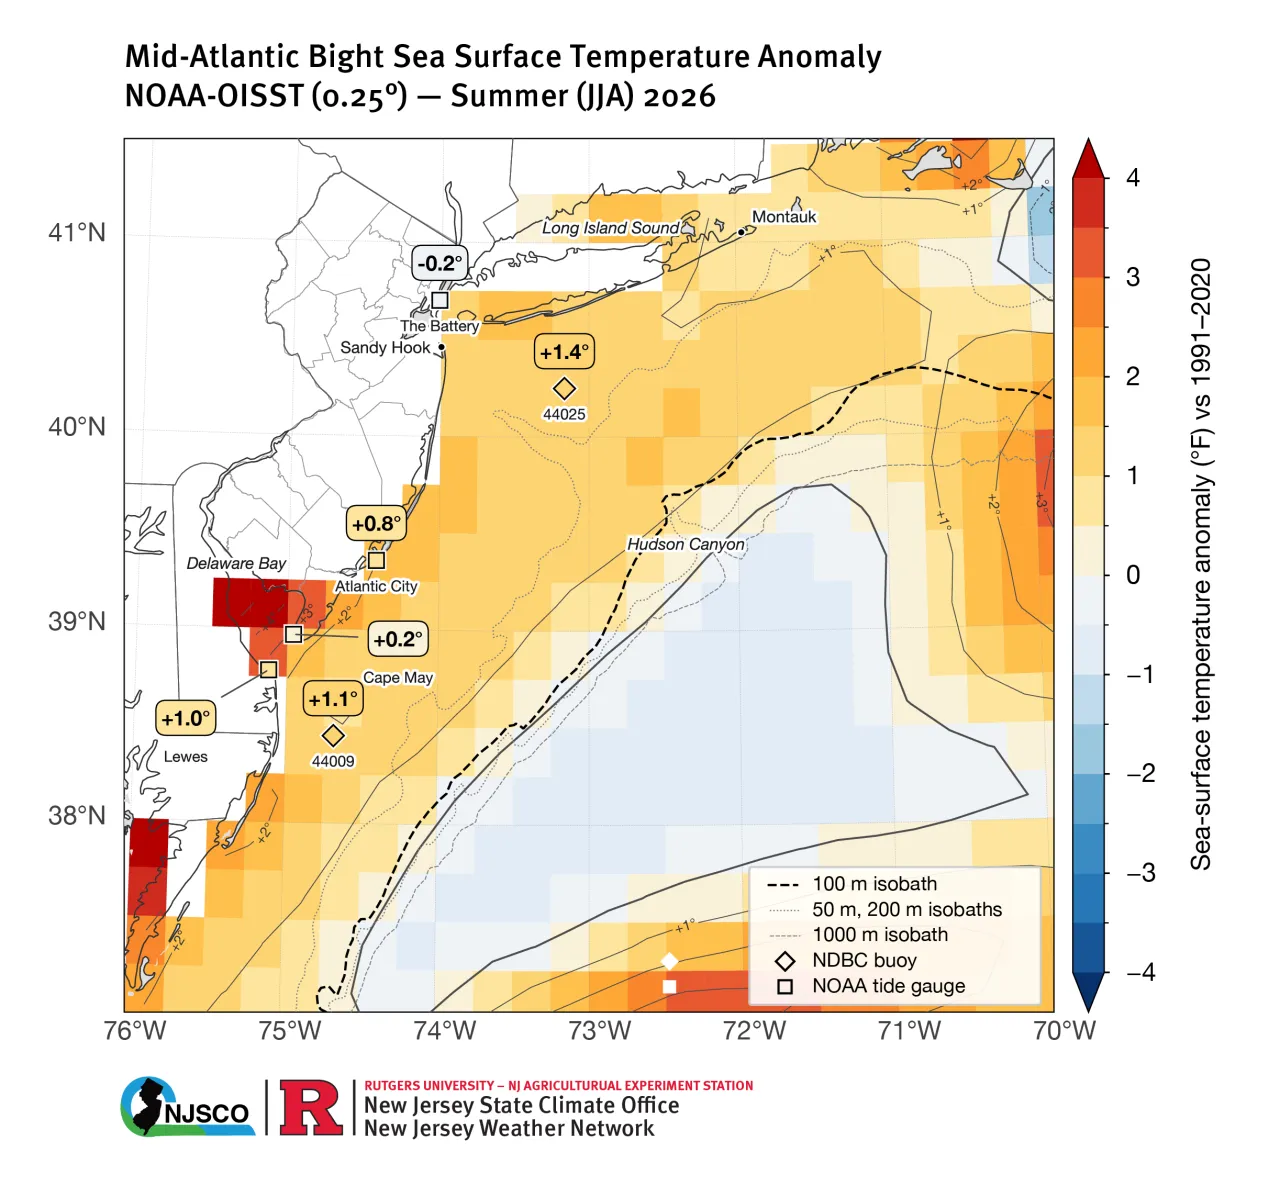
Figure 15. Summer (JJA) 2026 sea surface temperature anomaly (SSTA) relative to the 1991–2020 climatological period in units of °F from NOAA-OISST v2.1 (gridded), NDBC buoy measurements (diamonds), and NOAA tide gauges (squares).
Precipitation
New Jersey started off the summer still in drought. June was dry, and the statewide seasonal accumulated rainfall deficit peaked on June 21 at 2.13” below the climatological average, with another secondary deficit that peaked on July 3 at 2.10”. Over the remaining two months, rounds of heavy thunderstorms and flash flooding eroded the deficit, and the season ended up with a surplus of 2.56”.
The statewide 1991–2020 average JJA rainfall was 13.67”, which ranks as the 25th wettest. Many locations around the state far exceeded this average. Of the 324 active CoCoRaHS stations, 33 stations reported seasonal rainfall totals over 20” (Table 2). The driest parts of the state were in coastal Atlantic and Cape May counties, including Ocean City (8.44”), Linwood (9.22”), Little Egg Harbor (9.45”), and Hamilton Township in Atlantic County (9.93”), all reporting less than 10” of rain for the summer.
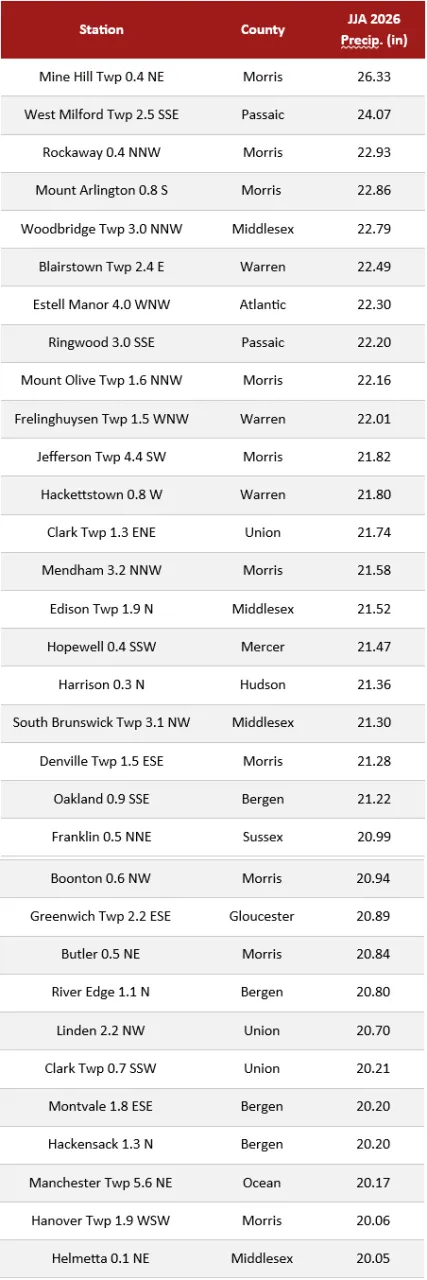
Table 2. New Jersey CoCoRaHS stations with summer (JJA) 2026 accumulated precipitation exceeding 20.00”.
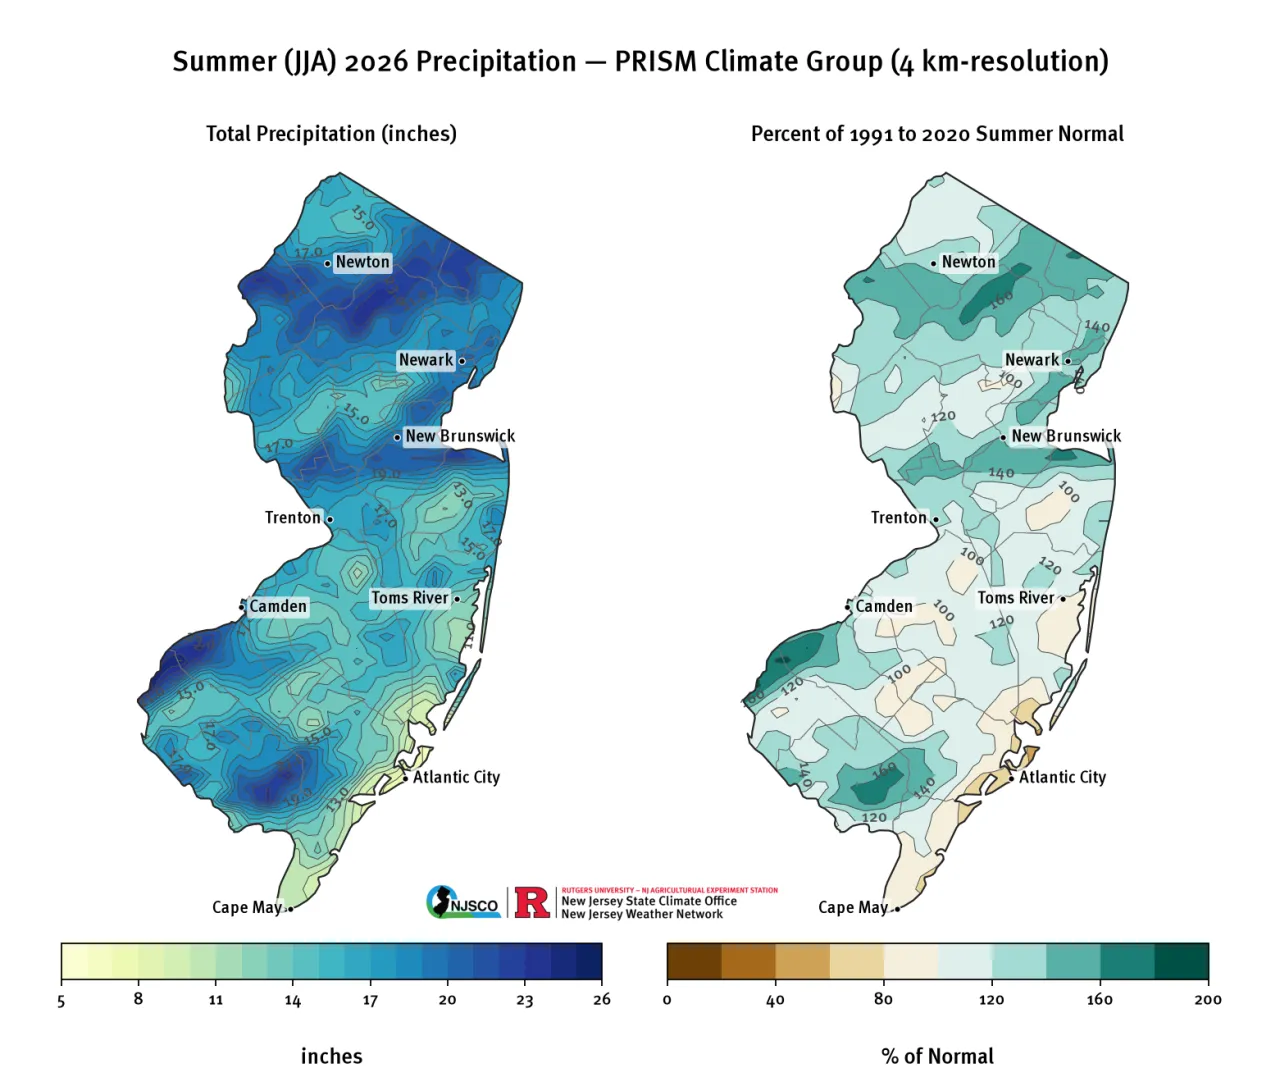
Figure 16. Summer (JJA) 2026 average precipitation (left) and percentage of seasonal normal based on the 30-year monthly climatology (right) from PRISM (Oregon State, https://prism.oregonstate.edu).
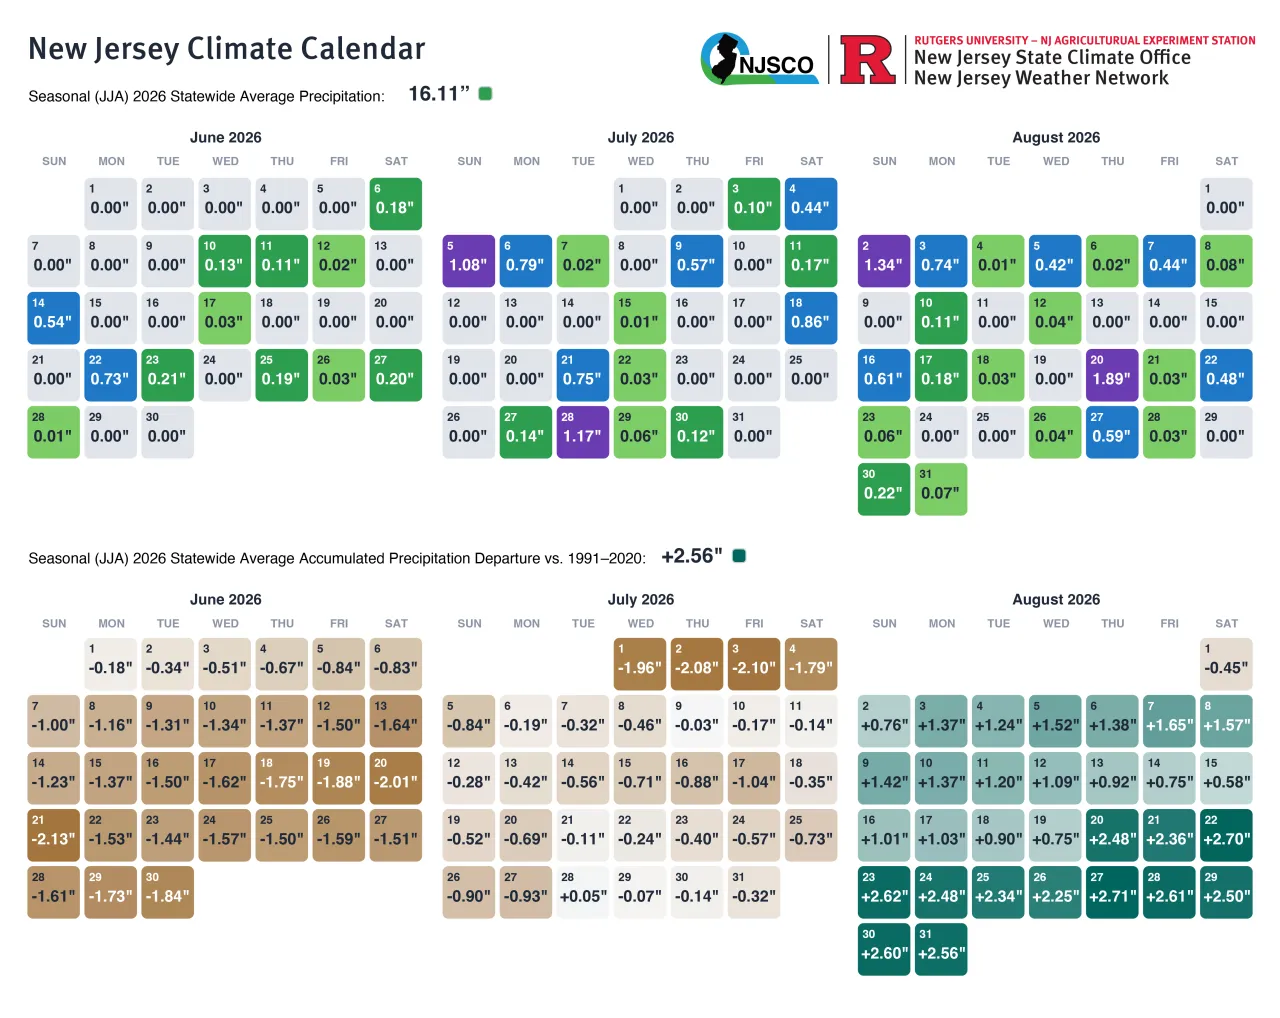
Figure 17. Summer (JJA) 2026 New Jersey Climate Calendar for statewide average precipitation (top) and statewide average accumulated precipitation departure from the 1991–2020 climatological average (bottom). Data source: NOAA NCEI nClimGrid-Daily.