

Overview
September is a transition month between summer and fall, and conditions around New Jersey reflected both seasons this year. The first two-thirds of the month were dominated by a similar weather pattern carried over from August. A large area of high pressure over the eastern third of the United States brought warm conditions that were periodically interrupted by frontal passages and heavy rain events. The pattern shifted in the final third of the month, as a blocking area of high pressure over Canada and a slow-moving nor’easter influenced weather across the state. The onshore flow brought significant rounds of tidal flooding and severe beach erosion to the Jersey shore, along with copious amounts of rainfall along the coast.
Drought conditions across New Jersey continued to improve steadily during September. A heavy rainfall event in mid-September reinforced improvements that already occurred in the northern half of the state this summer, while the northeastern brought much-needed rain relief to coastal portions of Atlantic, Cape May, and Cumberland counties. The US Drought Monitor (USDM), issued during the final week of September, showed only a few pockets of abnormally dry conditions near the Pine Barrens and in coastal South Jersey, reflecting long-term groundwater deficits. This marked the first time since the middle of August 2025 that no part of New Jersey was classified in drought status in the USDM (Figure 1).
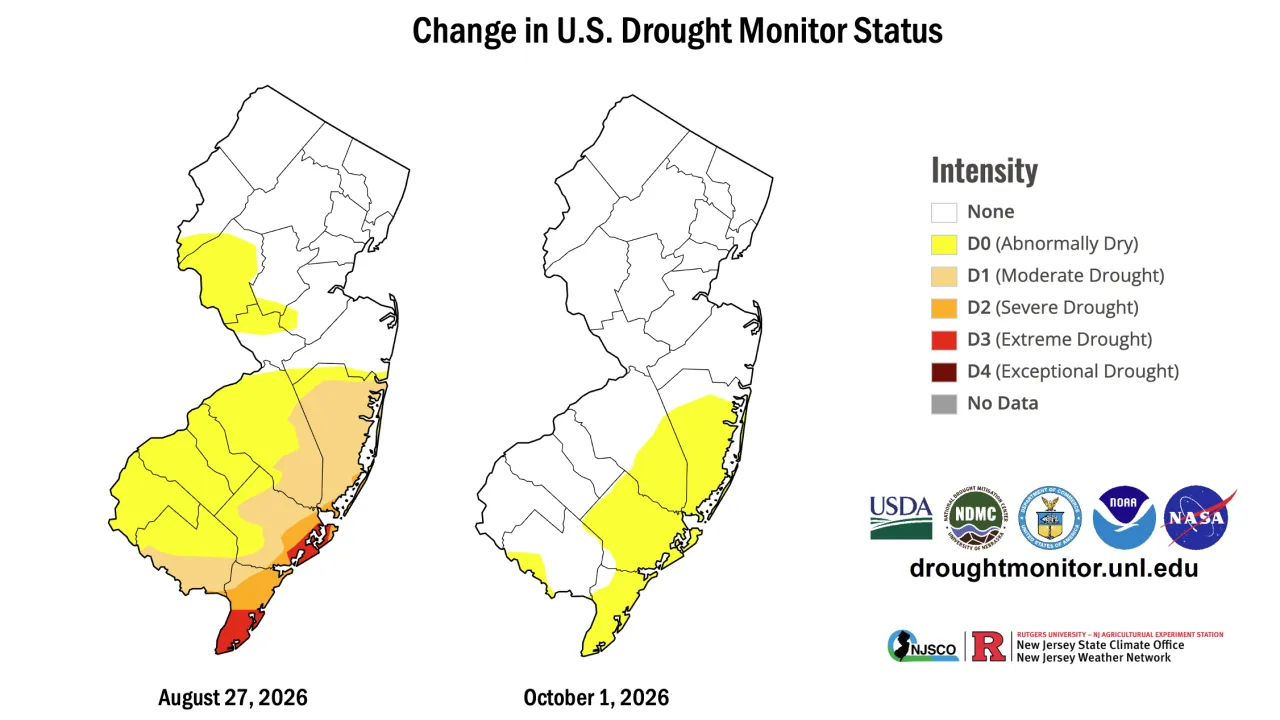
Figure 1. Change in U.S. Drought Monitor from August 27 to October 1, 2026.
The headline event for September was the late-month coastal storm. Onshore flow began early in the week, and minor high-tide flooding started on September 22, several days before the actual storm. Based on preliminary tide gauge measurements taken between September 22 and 30, there were 12 high tide cycles with at least minor flooding at Cape May and Atlantic City, and 10 high tide cycles at Sandy Hook. This nor'easter had the greatest number of high tide cycles with coastal flooding when comparing against all other major coastal storms that produced peak water levels of at least 3 feet above normal high tide (records date back to the early 1900s; Figure 2).
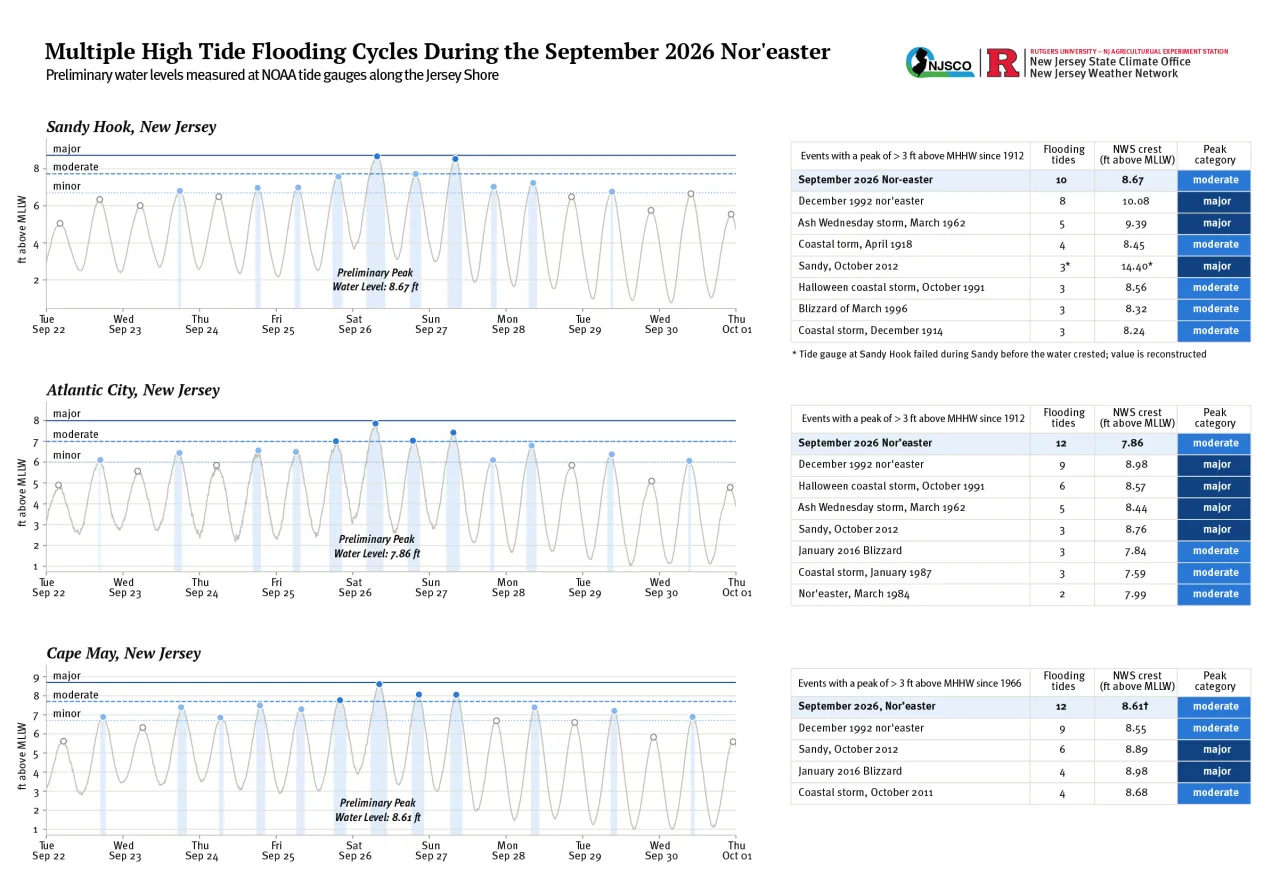
Figure 2. Total water levels (above mean lower low water) at NOAA tide gauges from September 22 through September 30, 2026 (left), along with the ranking among multiple high tide flooding cycles during events that produced water levels of at least 3 feet above normal high tide (right; mean higher high water).
September nor'easters are relatively rare in New Jersey compared to the late fall and winter months. Our office’s analysis of a recently-published climatology of East Coast storms (Chen et al. 2025, PNAS) found that since 1940, only 6 non-tropical storms with a minimum central pressure less than 990 millibars passed within 200 miles of the Jersey Shore prior to this month’s storm. The early-season timing of the storm, combined with the extensive beach erosion that took place, will be on the minds of Jersey shore communities as they enter into the winter storm season. This marks a setback, especially for towns such as Ocean City, which just completed a $19.5 million dredging and beach replenishment project on September 7.
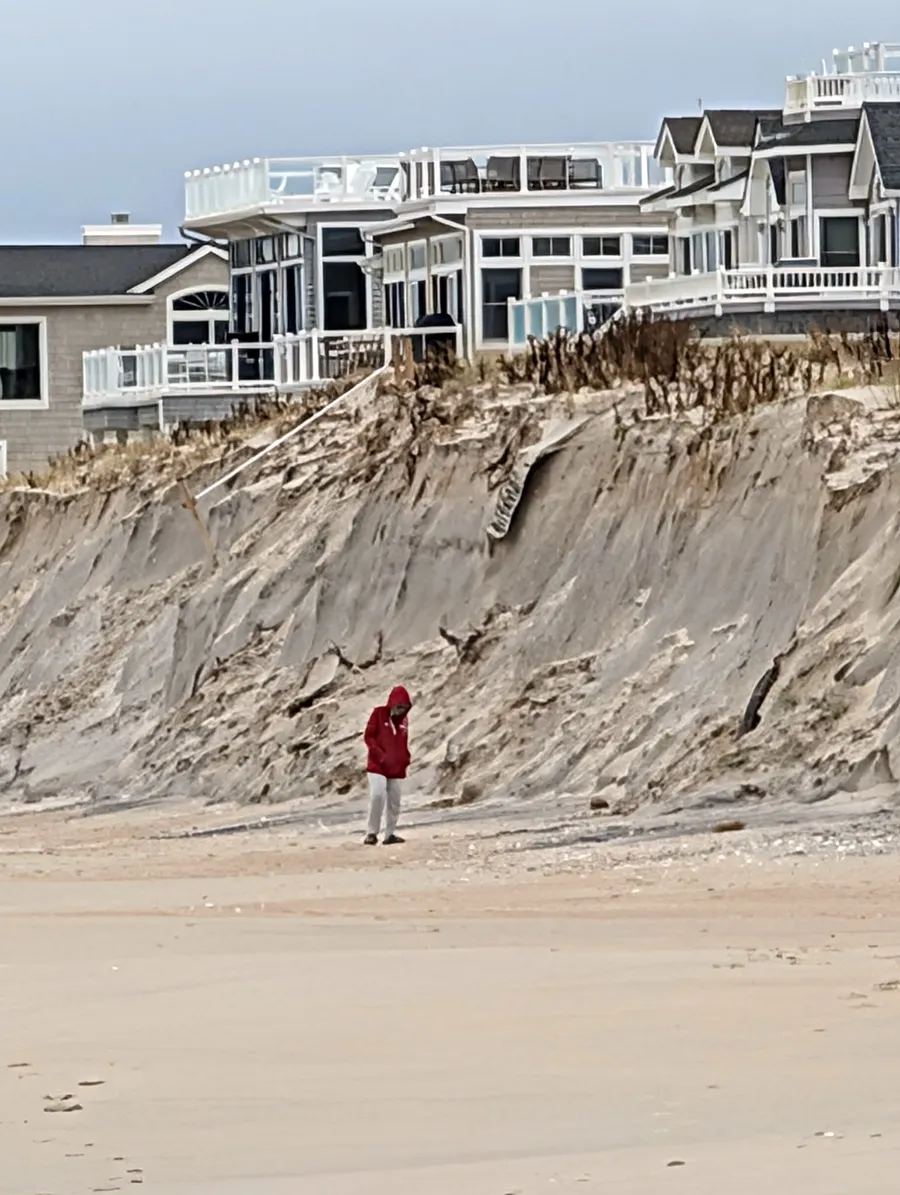
Figure 3. Beach erosion at Holgate on Long Beach Island following the September 2026 nor’easter. Photo by Jim Murdoch.
In the tropical Pacific, this season's growing El Niño intensified further. The Relative Oceanic Niño Index (RONI) in the Niño 3.4 region crossed the 2° Celsius threshold this month — the unofficial threshold of super El Niño status. Seasonal forecasts call for further intensification of El Niño conditions in the tropical Pacific between now and the end of the calendar year. Past El Niño events have led to a strengthening of the subtropical jet across the southeastern United States. The enhanced jet stream increases the chances of further coastal storms and rainy conditions in New Jersey as El Niño intensifies. Future storms will need to be monitored closely, especially after the significant beach erosion that took place during this month's nor'easter.
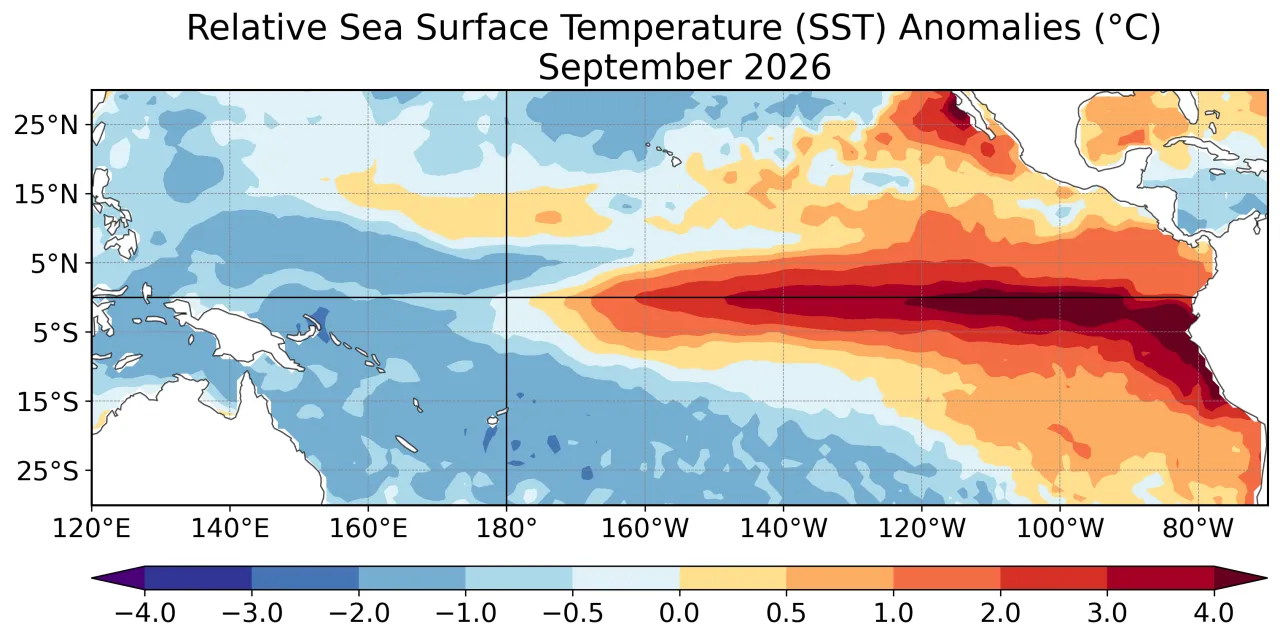
Figure 4. Average relative SST anomalies in the Tropical Pacific during September 2026. Source: NOAA CPC
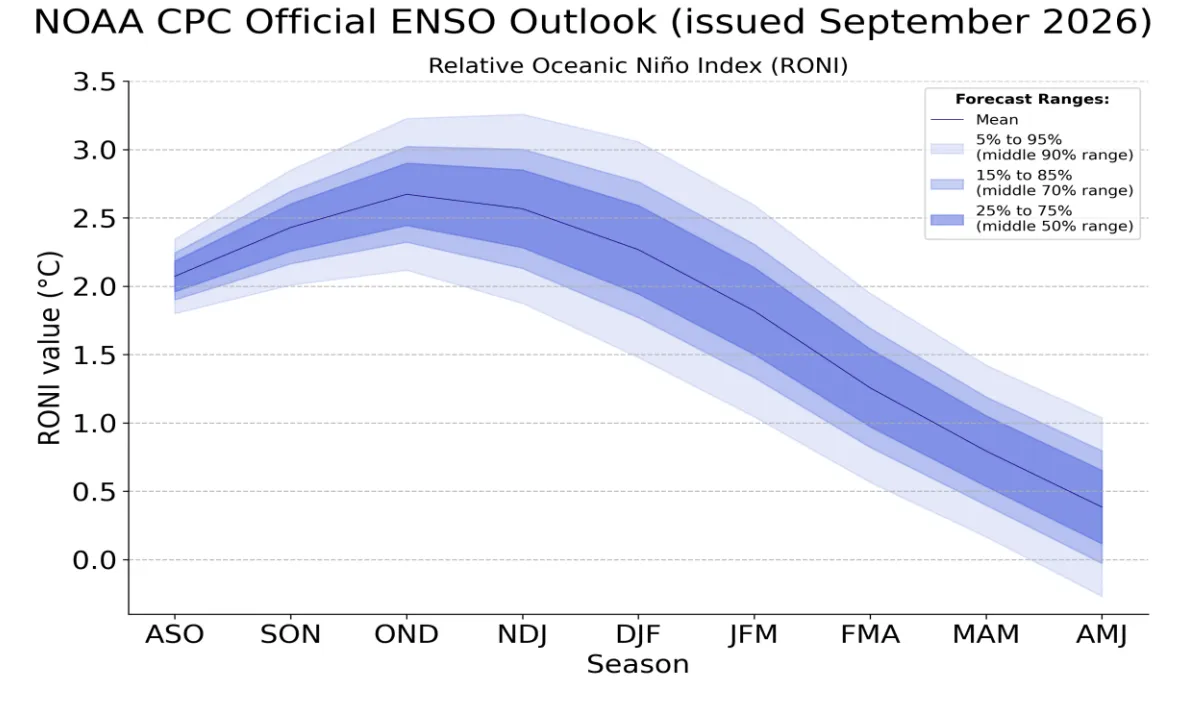
Figure 5. NOAA Climate Prediction Center ENSO Forecast issued in September 2026.
Storms and Precipitation
The September statewide average precipitation was 6.17”, which was 2.01” above the 1991–2020 mean and ranked 17th wettest. Unlike the prior two months, in September the Southern and Coastal divisions were both wetter than the north. The Coastal division led with 7.40" (3.51" above normal and 5th wettest), followed by the Southern division at 6.52" (+2.53", 12th wettest), and then by the Northern division with 5.48" (+1.02", 34th wettest).
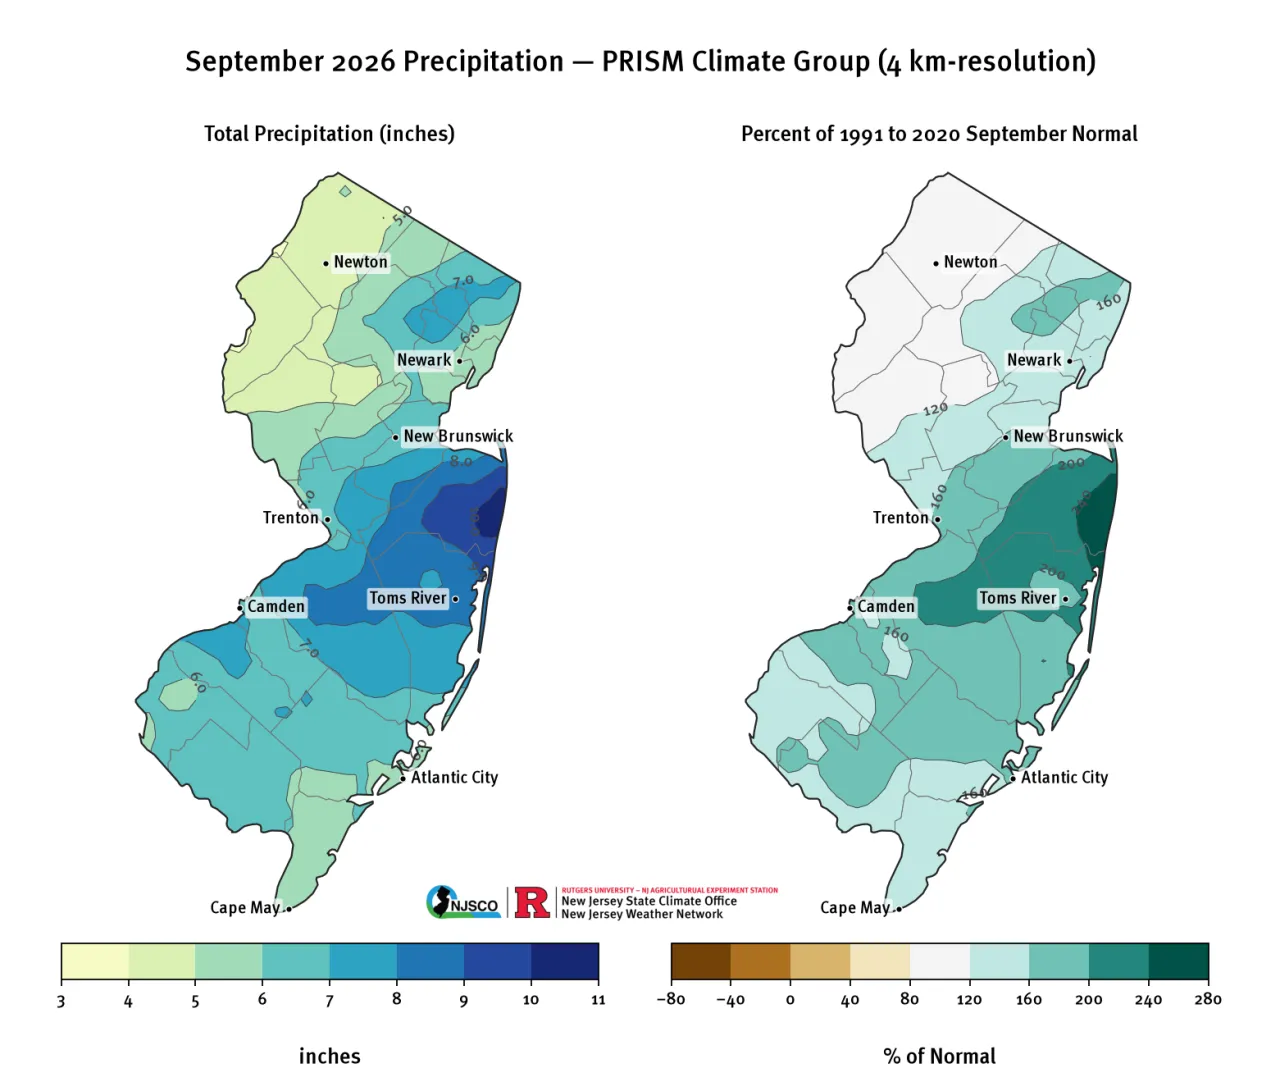
Figure 6. September 2026 total precipitation (left) and percentage of seasonal normal based on the 30-year monthly climatology (right) from PRISM (Oregon State, https://prism.oregonstate.edu).
September 1–4
The month started off steamy and hot, with temperatures well into the 90s on the first day of September. This led to a very unstable atmosphere when a slow-moving cold front began sagging south in the evening. Thunderstorms began in the evening hours and lasted into the overnight on the 2nd. The main impact of these storms was the damage caused by the winds. One area occurred in northern and central New Jersey, extending from Morris County down to Monmouth County along the coast. A more significant area of wind damage occurred in South Jersey, including Salem and Gloucester counties. Local fire departments reported numerous trees down in Harrison, Mantua, and West Deptford. Streets were nearly impassable in Williamstown, where quarter-sized hail was also reported. 28 CoCoRaHS stations reported more than an inch of rain during the first night of storms.
A second night of storms with intense lightning occurred Wednesday into Thursday. The heavy rainfall also triggered overnight flood warnings for Burlington, Gloucester, and Camden counties. Rainfall was more widespread in coverage throughout the state, with 243 CoCoRaHS stations reporting 0.25” or more of rain.
It was relatively quiet during the day on Thursday before the rains returned overnight early Friday morning. Later in the day, a cold front moved through on Friday afternoon, bringing more rain to parts of South Jersey. The week’s highest single-day rainfall occurred on Saturday (9/5), with the NJWxNet station in Fortescue reporting 1.73”, while Upper Deerfield had 1.10” and Cape May Court House 0.87”.
September 12–13
Another warm and humid airmass with plentiful moisture built into New Jersey on Saturday (9/12) ahead of an area of low pressure that tracked across the state on Sunday morning. Banded precipitation structures developed across central and North Jersey, leading to impressive rainfall rates, especially in parts of Essex, Passaic, and Bergen counties, which have been the epicenters of previous flood events this summer. Numerous water rescues took place in towns such as Patterson and East Hanover. The most significant impacts were in Bergen and Passaic counties, where 10 flash flood reports were received between 9:00 AM and 1:45 PM EDT. In Norwood, numerous road closures were in effect, and Haworth had its share of stranded vehicles in floodwaters. The Herring Brook overflowed its banks in Paramus, closing West Spring Valley Avenue, and NJ 208 northbound was fully closed north of Maple Avenue in Glen Rock. In Paterson, video showed many cars flooded on 11th Avenue with water up to the windows, and fire and rescue crews reported numerous flooded roads and vehicles in Wayne.
The NJWxNet station in North Haledon recorded over 5 inches of rainfall on Sunday morning. Much of this fell in a three-hour period between 8 AM and 11 AM (Figure 7). This extreme rainfall rate was consistent with a once-in-80-year precipitation event (around a 1.25% chance of occurring in any given year), based on estimates from NOAA Atlas 14.
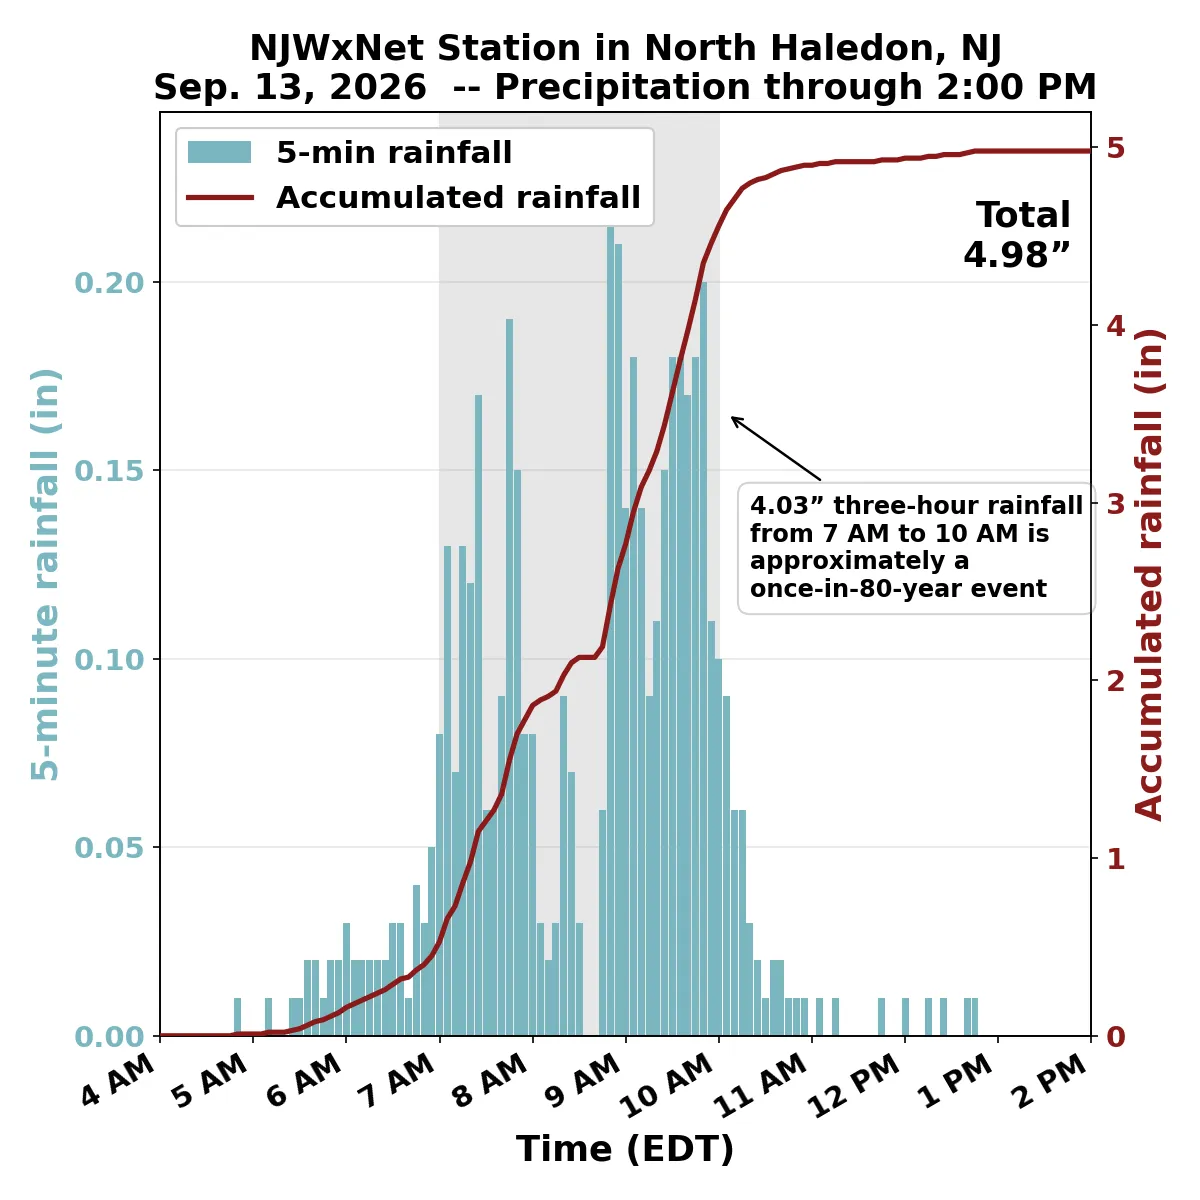
Figure 7. Rainfall at 5-minute intervals (bars) and accumulated rainfall (red curve) for the NJWxNet station in North Haledon on September 13.
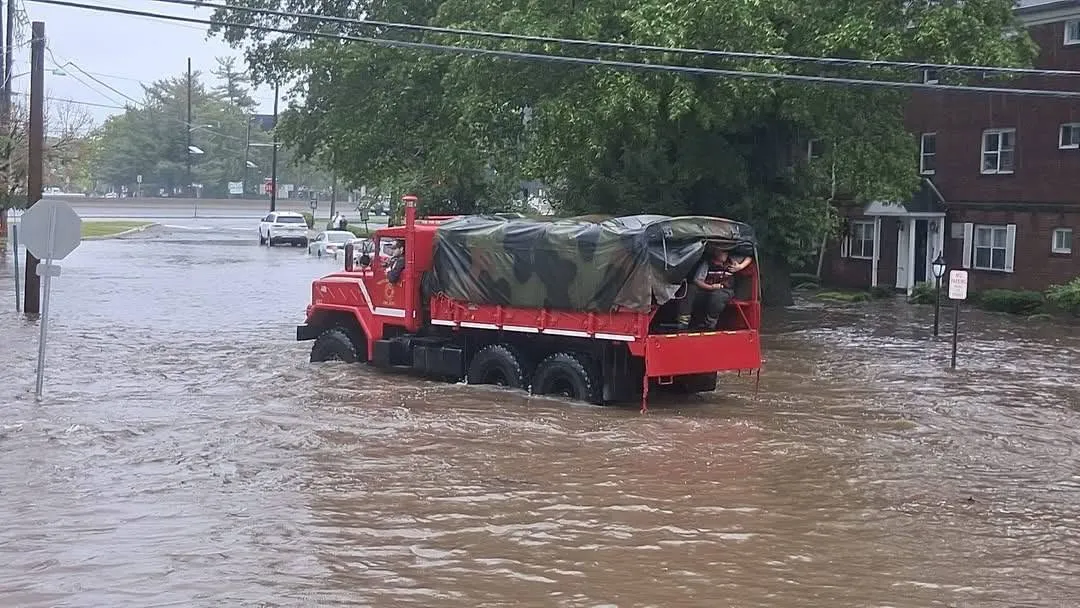
Figure 8. High water rescues taking place in Hackensack during the urban flooding event on September 13. Photo courtesy of the Hackensack Fire Department.
September 19–20
Another decaying frontal boundary was the focus for precipitation as mid-level energy in the atmosphere triggered light to moderate rain across the state. Unlike the high-impact events that have characterized this summer, this event was notable for its lack of drama. Soaking beneficial rains were welcome across the state and helped reinforce improving drought conditions. Two-day precipitation amounts were generally under 1” across New Jersey, except for higher amounts in parts of Hunterdon, Somerset, and Middlesex counties (Figure 9).
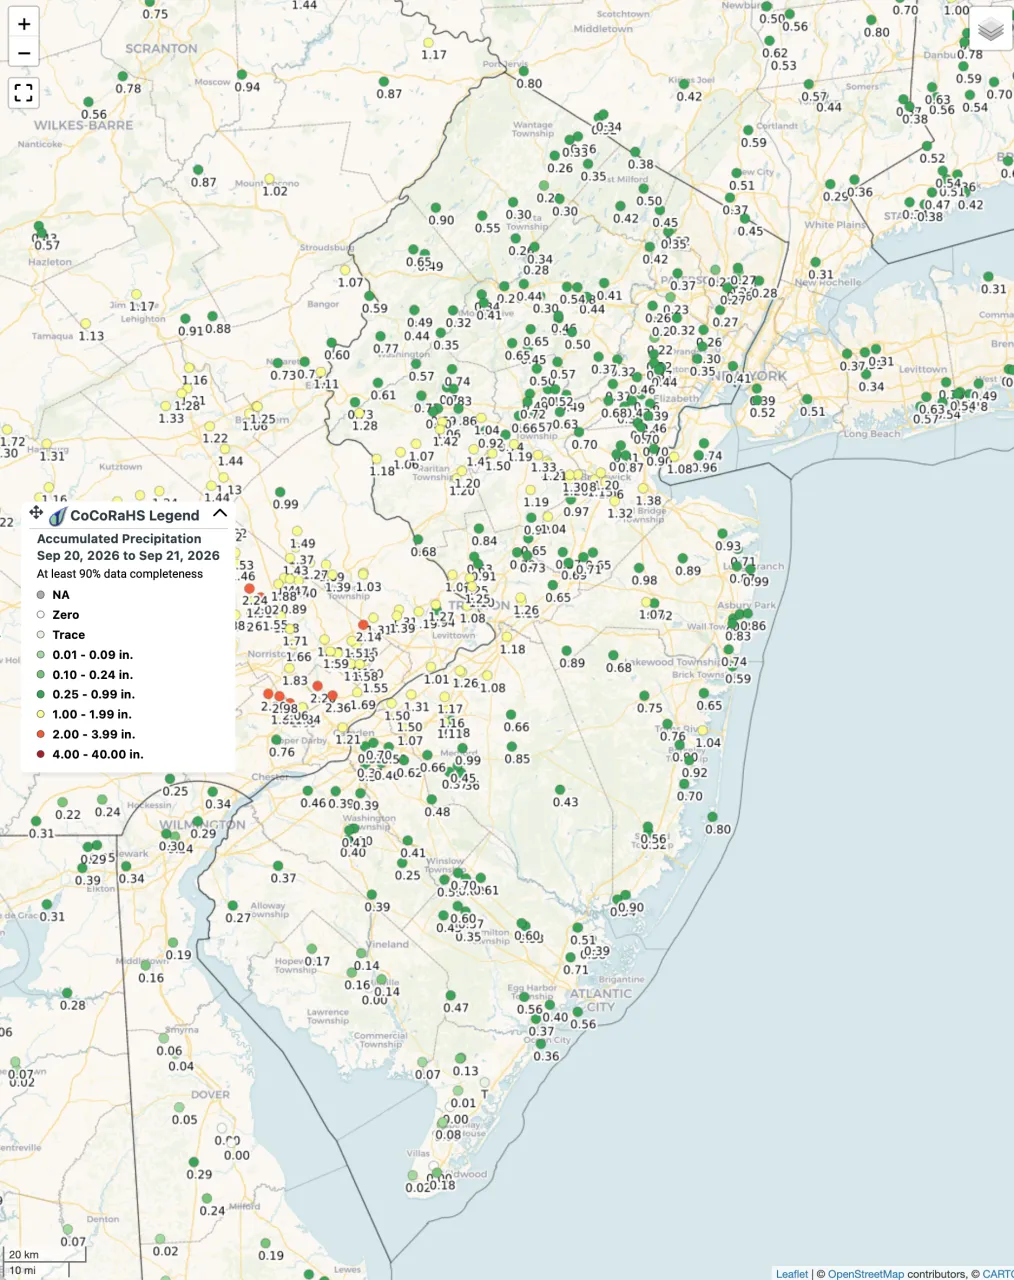
Figure 9. Two-day rainfall totals from CoCoRaHS stations (reported on the mornings of September 20 and 21).
September 25–28
A rare, early-season coastal storm formed off the Mid-Atlantic coast and caused considerable impacts across the state. The storm’s most damaging impact came in the form of coastal flooding along the Jersey Shore. The storm came on the heels of persistent onshore winds the week prior, which contributed to elevated water levels. The storm also coincided with astronomical high tides associated with a full moon. The peak water levels occurred on Saturday morning (9/26).
The impacts of coastal flooding were widespread. Voluntary evacuation orders were issued in Manasquan on Friday (9/26), and additional evacuation orders were issued in Pleasantville on Saturday morning. Ocean County law enforcement also reported numerous road closures from tidal flooding, and extensive road flooding was later reported in Margate City during the evening. Flood also occurred along tidal portions of the state’s river systems, especially in urban areas of North Jersey such as Harrison and Kearny. The storm produced gale- and storm-force wind gusts across the state (Table 1).
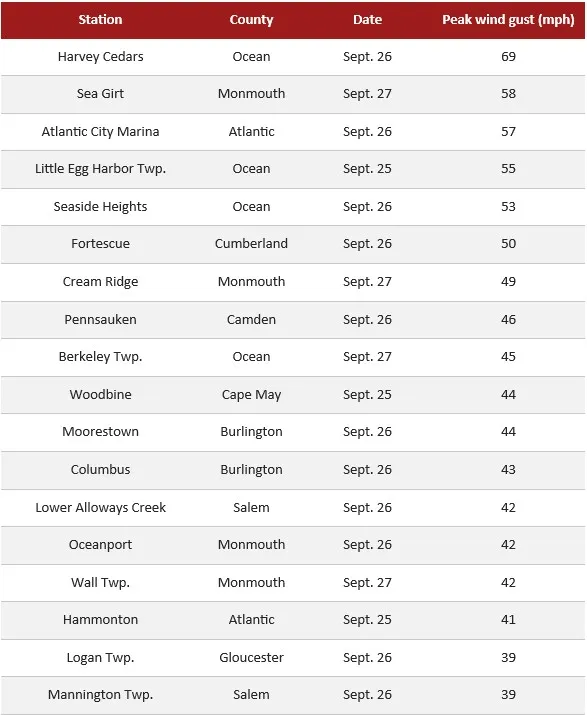
Table 1. Peak wind gusts during the September 25–28 nor'easter as measured by the New Jersey Weather Network (NJWxNet) observing system.
The storm also brought significant rainfall to the state. Coastal Monmouth saw the highest amounts and most Monmouth County NJWxNet observing network stations measured between 6.50” and 7.50” of rainfall during this nor’easter (Table 2). Additionally, 4 CoCoRaHS sites reported more than 8.00” during the storm: Bradley Beach (8.46”), Neptune City (8.34”), Wall Township (8.15”), and Neptune Township (8.04”).
Rainfall amounts exceeding 3” occurred all the way down the coast to Cape May, making a big difference with any remaining drought concerns in this part of the state.
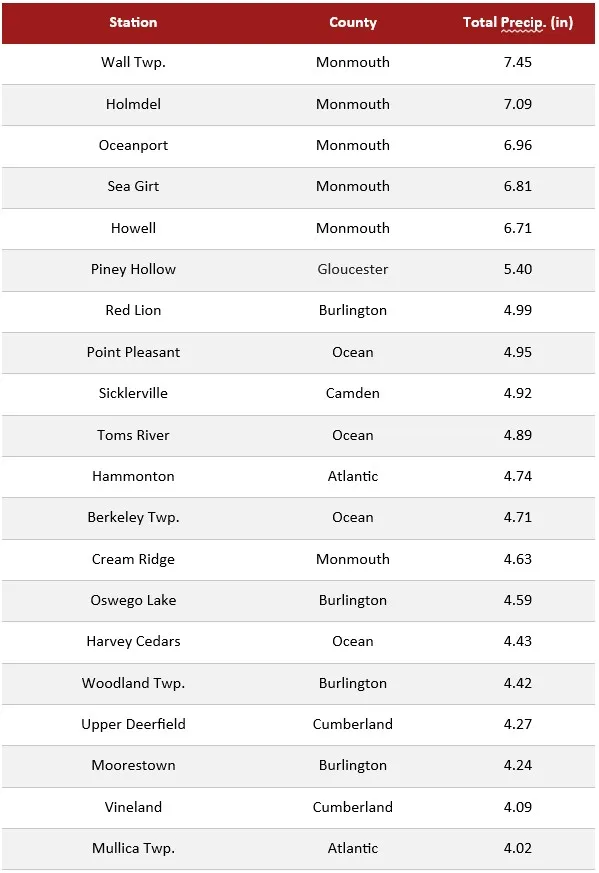
Table 2. Event rainfall during the September 25–28 nor'easter (through 8:00 AM on 9/28) as measured by the New Jersey Weather Network (NJWxNet) observing system.
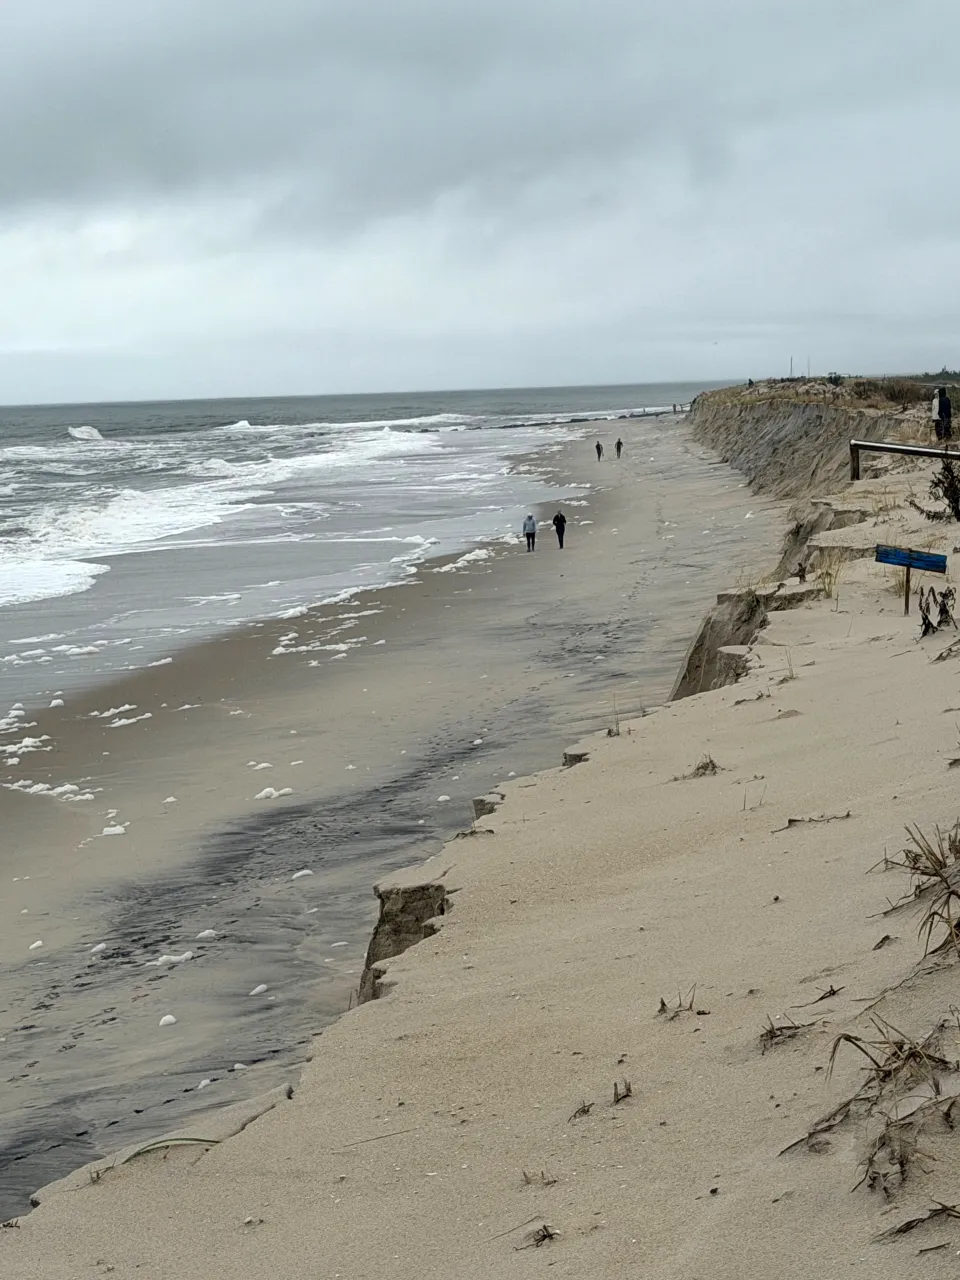
Figure 10. Another view of beach erosion occurring in Holgate on Long Beach Island from the September nor'easter. Photo by Dan Barone.
Another feature of this storm was a spectacular sunset on Friday night caused by the low clouds offshore associated with the approaching nor’easter. For many, the sky turned a vibrant red, including over SHI Stadium just before the kickoff of the team’s first victory of the season over Howard University.

Figure 11. A vibrant sunset ahead of the nor'easter over the parking lot outside SHI Stadium in Piscataway on September 25th. Photo courtesy of Mike Ashmore.
Temperatures
September 2026's statewide average temperature of 68.2°F was 1.3° above normal and ranked as the 13th warmest of the past 132 Septembers (tied with three others). The Northern climate division averaged 65.8° (+0.9°, 23rd warmest), the Southern division 69.6° (+1.5°, 14th warmest), and the Coastal division 70.4° (+1.7°, 11th warmest).
The monthly temperature averages somewhat hide the anomalous nature of the warm overnight temperatures around the state this month. The average high of 76.4° was 0.8° below normal and 55th warmest, yet the average low of 60.0° was 3.4° above normal and 4th warmest. Several National Weather Service Cooperative Observer sites ranked in the top 5 warmest September monthly average minimum temperatures (Table 3).
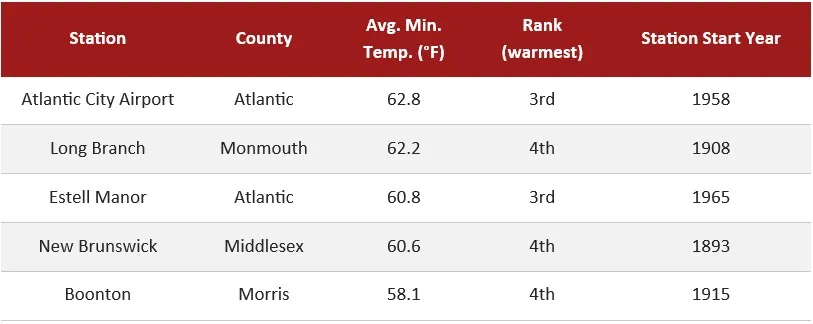
Table 3. List of National Weather Service Cooperative Observer Program stations with September 2026 monthly average minimum temperatures that ranked in the top 5 warmest for the station's period of record.
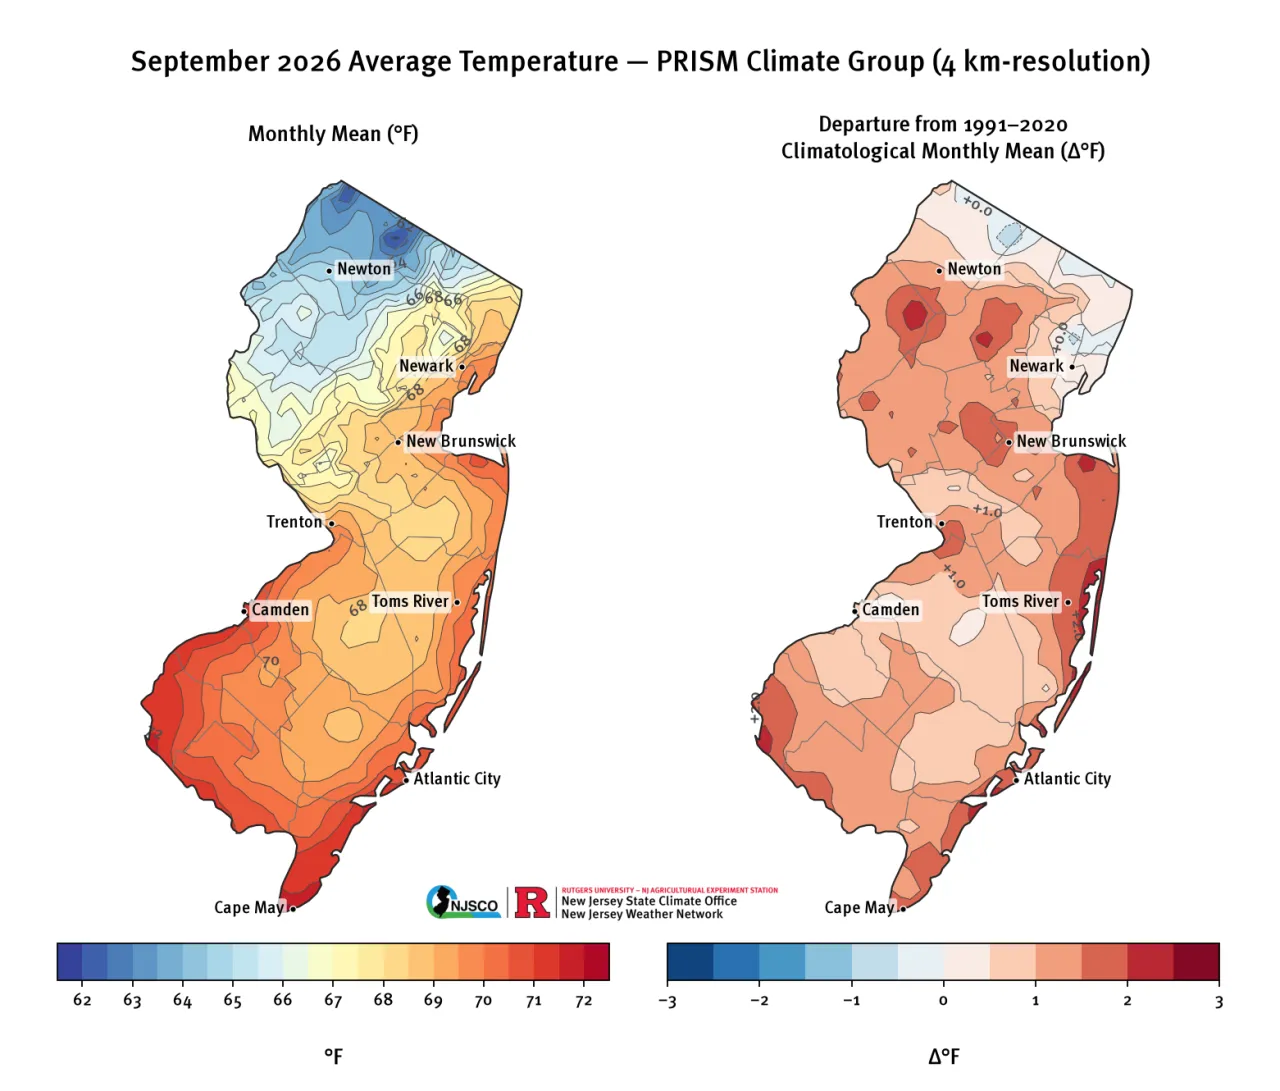
Figure 12. September 2026 average temperature (left) and departure from 30-year monthly climatology (right) from PRISM (Oregon State, https://prism.oregonstate.edu).
September 1–19
The month started off very warm by September standards. On September 1, 25 of 69 NJWxNet stations reached temperatures at or above 90°F. The warmest reading of the month occurred on 9/1 at Lower Alloways Creek, which reached 94°F. The temperatures also rebounded into the 90s the following week, when 91°F (Hamilton, Lower Alloways Creek) and 90°F (Hammonton, Berkeley Twp., and Vineland) were recorded. The thermometer made another run at 90° during the third week of September but fell short. The highest temperature of that week was 88°F, which occurred at the Harrison (Hudson County) NWS Cooperative station on Thursday, 9/17.
The overnight temperatures were also very warm during the first two thirds of the month. On Thursday morning 9/3, Little Egg Harbor, Sea Girt, and Mansfield reported balmy overnight lows of only 76°F. On Thursday 9/10, morning low temperatures at stations located along Delaware Bay were also in the low to mid 70s (76°F at Fortescue). The warmest overnight low at the NJWxNet sites during the third week of the month was 72°F, which occurred at Fortescue (Thursday, 9/17), Lower Alloways Creek (Friday, 9/18), and West Deptford (Friday, 9/18).
September 20–30
With the onshore flow setting up for the final third of the month, temperatures statewide turned cooler and below average for the time of year. From Tuesday 9/22 through Monday 9/28, statewide high temperatures averaged in the 60s. After the storm departed, however, maximum daytime temperatures rebounded into the 70s to around 80°. NJWxNet stations in Hammonton, Haworth, Hillsborough-Duke, and Toms River all reached 80° to round out the final day of the month.
During the final week of the month, the cooler temperatures were most apparent in northwestern NJ. The overnight low at the NJWxNet station in Walpack dropped to 34° on both Thursday and Friday mornings (9/24 and 9/25). Lost in the chatter of the nor'easter, these chilly nights were a reminder of September's primary role: to usher us from summer to the cooler, crisper weather of fall.