

June Overview
The title of this month’s report is appropriate for two very different reasons. First, it applies to Jersey-wide precipitation this month and over the first half of 2026 being well below normal. This condition has persisted over 23 of the past 26 months when compared to 1991–2020 normals.
The second reason for the title pertains to my 35-year run as New Jersey State Climatologist ending on June 30th as I retire from my academic career as a Rutgers professor and State Climatologist. I step down, proud of what our state climate office team has achieved and looking forward to future progress as Dr. John Krasting, a former Rutgers undergraduate and graduate student and, more recently, a respected scientist at NOAA’s Geophysical Fluid Dynamics Lab, grabs the baton. He will inherit a long-serving and dedicated staff. None more so than Mat Gerbush who has for years assisted with behind-the-scenes contributions to these monthly narratives. Expect great things from John, Mat, and others within the state climate office! Also, be sure to visit the newly updated state climate website that now combines information from our two former sites, one, a general state climate site, the other the Rutgers NJ Weather Network site. Having more of a Jersey focus than ever, check out new additions and upgrades to long-available maps, tables, and graphs. Explore NJ weather and climate data from over a century ago to the past five minutes!
Back to a look at June 2026. The statewide average temperature of 71.9° is 1.6° above the 1991–2020 normal. This ties for the 9th warmest dating back to 1895 (Table 1). Nine of the 15 warmest Junes of the past 132 have occurred since 2005, with five of them within the past seven years. The average high of 83.7° is 2.7° above normal and ranks 7th warmest. Indicative of dry conditions that often result in wide diurnal temperature ranges, the average low of 60.2° is 0.6° above normal, yet, due to the warming of recent decades, is the 21st warmest of the past 132 Junes. The northern climate division averaged 70.1° (+1.5°, tied for 10th warmest), the southern division 73.1° (+1.7°, 8th warmest), and the coast 72.7° (+2.2°, 7th warmest).
| Rank | Year | June Avg. Temp. | |
| 1 | 2010 | 73.9° | |
| 2 | 1943 | 73.6° | |
| 3 | 2024 | 73.4° | |
| 4 | 2008 | 73.0° | |
| 4 | 1925 | 73.0° | |
| 6 | 1994 | 72.2° | |
| 7 | 2005 | 72.1° | |
| 8 | 1957 | 72.0° | |
| 9 | 2026 | 71.9° | |
| 9 | 2025 | 71.9° | |
| 9 | 2011 | 71.9° | |
| 12 | 2021 | 71.8° | |
| 12 | 1934 | 71.8° | |
| 14 | 2020 | 71.5° | |
| 14 | 1973 | 71.5° |
Table 1. The 15 mildest Junes across NJ since 1895.
Precipitation across New Jersey average 2.48” this June. This is 1.82” below normal and ranks as the 21st driest on record. The northern division averaged 3.04” (-1.57”, 37th driest), the southern division 2.18” (-1.96”, 21st driest), and the coast 1.63” (-2.22”, 7th driest). More specifically, as seen in Figure 1, the Highlands were notably the wettest area of the state. The far south and scattered central areas were driest.
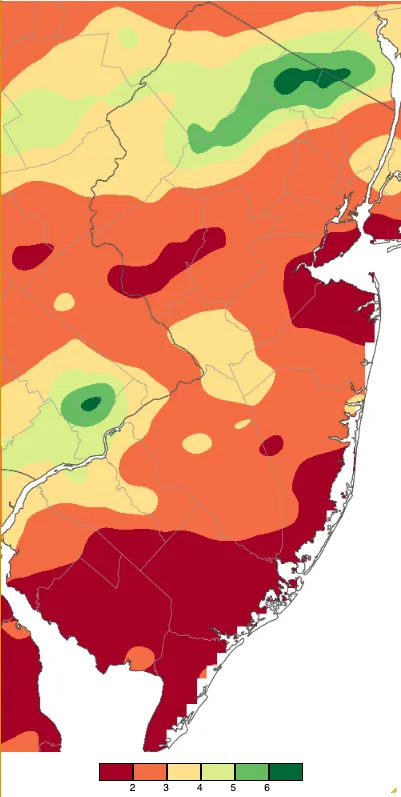
Figure 1. June 2026 precipitation across New Jersey based on a PRISM (Oregon State University) analysis generated using NWS Cooperative, CoCoRaHS, NJWxNet, and other professional weather station observations from 8 AM on May 31st to 8 AM on June 30th. Note the scale in inches at the bottom of the map. Totals range from 1.00”–1.99” (dark red) to 6.00”–6.99” (dark green).
Precipitation and Storms
There was a seven-fold difference in precipitation totals across NJ this early-summer month. In the Highlands, West Milford Township (Passaic County) totaled 7.00”, followed by Jefferson Township (Morris) 6.14”, two Oakland (Bergen) sites 6.11” and 5.63”, Mount Arlington (Morris) 5.51”, Franklin (Sussex) 5.50”, Mount Olive Township (Morris) 5.39”, Mine Hill Township (Morris) 5.29”, and Ringwood (Passaic) 5.26”. On the low end, in the south, three Lower Township (Cape May) stations came in with 0.88”, 1.04”, and 1.16”, three in Galloway Township (Atlantic) at 0.97”, 1.10”, and 1.11”, Hamilton Township (Atlantic) 0.94”, Folsom (Atlantic) 1.01”, Estell Manor (Atlantic) 1.14”, Linwood (Atlantic) 1.15”, Ocean City (Cape May) 1.15”, and Brigantine (Atlantic) 1.16”.
June began with five dry days until a line of showers on the evening of the 6th into early on the 7th delivered 1.06” to Mine Hill Township, Mount Olive Township 1.00”, Mansfield Township (Warren) 0.98”, and 0.50”–0.97” at 33 of 272 Community Collaborative Rain, Hail, and Snow Network (CoCoRaHS) stations. Strong winds accompanied the thunderstorms, including gusts of 60 mph at Newark Liberty Airport in Elizabeth (Union), Teterboro Airport in Teterboro (Bergen) 58 mph, Jersey City (Hudson) 54 mph, Stewartsville (Warren) 52 mph, and eight Rutgers NJ Weather Network (NJWxNet) stations with gusts from 41–47 mph. This resulted in trees and wires down and some house damage reported in ten north and central counties.
Scattered late afternoon and evening storms struck the far south on the 10th. Lower Township caught 1.30”, 0.67”, and 0.50” (three stations), Middle Township (Cape May) 1.29”, 1.25”, and 1.15” (three stations), Dennis Township (Cape May) 1.18” and 0.99” (two stations), and from 0.50”–1.15” at 15 of 259 reporting stations. Winds gusted to 41 mph at Lower Alloways Creek Township (Salem). An evening line of showers crossed extreme northern NJ on the 11th. West Milford received 0.75” and Ringwood 0.67”. Winds gusted to 45 mph in Wantage (Sussex). Scattered afternoon showers on 12th delivered no more than 0.56” to Little Falls Township (Passaic) and 0.54” in Hackensack (Bergen). Elsewhere, winds gusted to 52 mph at Harvey Cedars (Ocean) and damage to trees and wires was reported in Hunterdon and Burlington counties, and in particular, Bergen County.
Yet another round of evening storms impacted NJ on the 14th, ending early on the 15th. Plentiful rains of 1.84” and 1.59” fell in Mount Ephraim (Camden), Greenwich Township (Gloucester) 1.75”, Helmetta (Middlesex) 1.58”, East Windsor Township (Mercer) 1.52”, 1.00”–1.45” at 23 CoCoRaHS stations, and 0.50”–0.99” at 90 others out of 278 reports (Figure 2). Winds gusted to 44 mph at Harvey Cedars, with some tree and wire damage reported in Camden and Mercer counties.
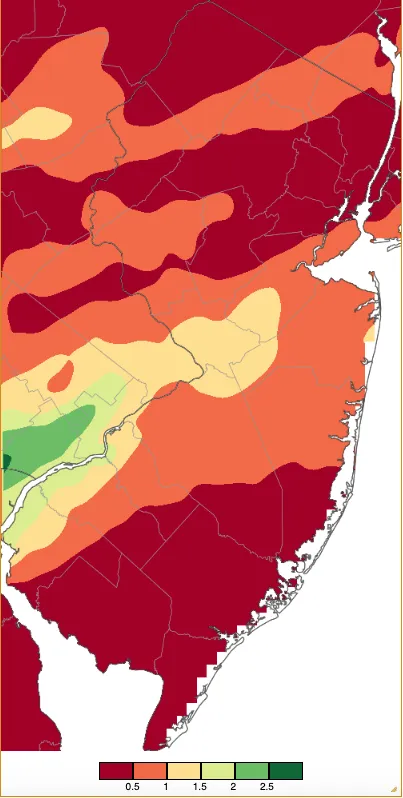
Figure 2. Precipitation across New Jersey from 8 AM on June 14th through 8 AM June 15th based on a PRISM (Oregon State University) analysis generated using NWS Cooperative, CoCoRaHS, NJWxNet, and other professional weather station observations.
The wettest event of the month began with midday showers in the northwest on the 22nd, continuing with afternoon thunderstorms in northern and central areas moving southward in the evening, before culminating with heavy northeast rain early on the 23rd. Of 277 CoCoRaHS reports, Jefferson Township caught the most with 3.35”, followed by Mount Arlington 2.71”, West Milford Township 2.61”, Winslow Township (Camden) 2.44”, Mine Hill Township 2.31”, Oakland 2.26”, six stations from 2.00”–2.25”, 82 from 1.00”–1.99”, and 107 from 0.50”–0.99” (Figure 3). Hail up to 1.5” in diameter was reported in Burlington Township (Burlington), with tree and wire damage in four lower Delaware Valley counties from winds gusting up to 41 mph in Logan Township (Gloucester).
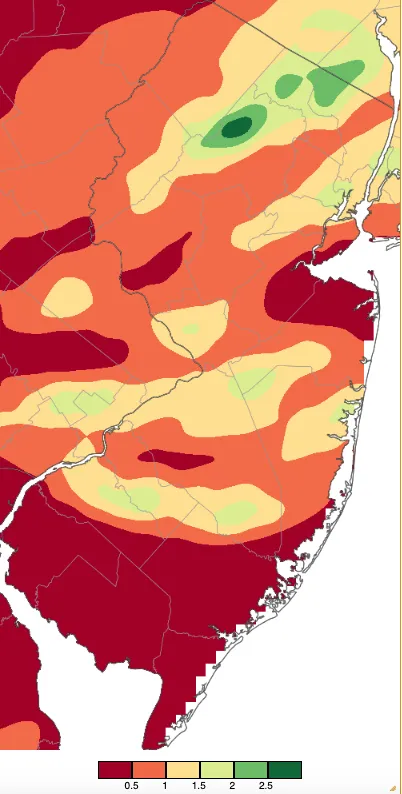
Figure 3. Precipitation across New Jersey from 8 AM on June 22nd through 8 AM June 23rd based on a PRISM (Oregon State University) analysis generated using NWS Cooperative, CoCoRaHS, NJWxNet, and other professional weather station observations.
Daytime showers on the 23rd deposited 1.03” in Surf City (Ocean), Egg Harbor City 0.91” and 0.77” (Atlantic; two stations), Lacey Township (Ocean) 0.84”, Barnegat Light (Ocean) 0.73”, and 0.50”–0.75” at six of 264 CoCoRaHS reporting sites. A heavy swath of rain crossed the north early on the 26th, with showers extending through the morning. Of 259 CoCoRaHS reports, Franklin (Sussex) saw the most with 2.27”, followed by Stillwater Township (Sussex) 2.03”, Newton (Sussex) 1.96”, West Milford 1.90”, 17 stations from 1.00”–1.89”, and 14 from 0.50”–0.99”. Last up were afternoon showers on the 27th that produced 0.88” at Belvidere (Warren), 0.83” and 0.71” at two Mansfield Township (Warren) sites, 0.70” in Millville (Cumberland), and 0.50”–0.69” at five other locations.
Highest monthly barometric pressures were in the 30.25”–30.35” range on the 8th and 9th. Lowest readings were from 29.45”–29.55” on the 18th. In addition to the six days mentioned previously when winds gusted to 40 mph or greater at a NJWxNet station, there were gusty winds on the 18th that reached 49 mph at Atlantic City Marina (Atlantic), Pennsauken (Camden) 48 mph, and 13 stations from 40–47 mph.
Drought conditions persisted across New Jersey throughout the month as the Drought Warning issued by the NJ Department of Environmental Protection continued. Some water purveyors began to issue lawn watering restrictions toward the end of the month. There was some improvement in the north, with conditions easing to an “abnormally dry” designation. Also, some improvement was felt in the lower Delaware Valley, falling from D2 (Severe) to D1 (Moderate). However, an area of D3 (Extreme) blossomed in the far south on the June 9 map, expanding up the coast to extreme lower Ocean County by the 23rd.
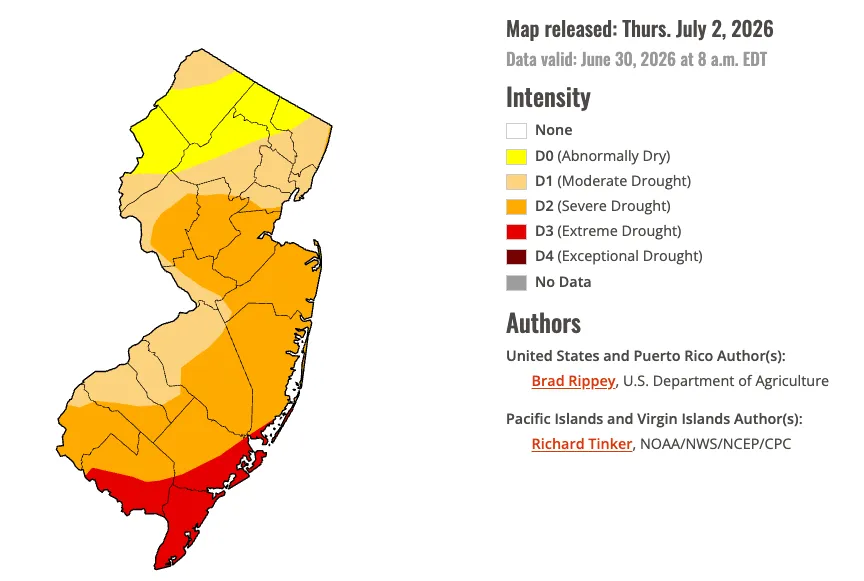
Figure 4. U.S. Drought Monitor map of conditions in NJ as of June 30, 2026.
Temperature
June began on a chilly note, with Walpack (Sussex) dropping to 45° on the 1st. Seven more days with lows of at or below 45° followed at one or more NJWxNet location. The 2nd was the coolest June morning, with lows of 37° at Walpack and Berkeley Township (Ocean), Sandyston (Sussex) 38°, Hopewell Township (Mercer) 39°, and 36 stations from 40°–45° (Figure 5). Lower Alloways Creek Township was mildest at 54°. Walpack fell to 41° on the 4th before rising to an afternoon high of 87°. Four locations were as cool as 44° or 45°. Lows were only 64° at Lower Alloways Creek Township and at the high elevation Vernon Township (Sussex) station. Walpack was again coolest on the 5th at 44°, later in the day rising to 90°. Berkeley Township reached 40° on the 9th with 20 locations from 41°–45°. On the 16th, Sandyston and Walpack fell to 42° and four stations were either 44° or 45°. The last ≤45° lows were on the 17th, with Walpack at 42° and Sandyston 45°. Fortescue only fell to 67°.
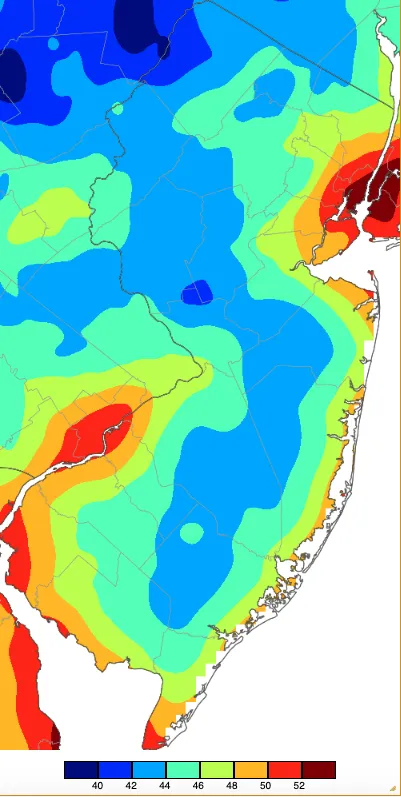
Figure 5. Minimum temperatures on June 2nd based on a PRISM (Oregon State University) analysis generated using NWS, NJWxNet, and other professional weather stations. Note the 2-degree scale beneath the map.
Thirteen June days found one or more NJWxNet station topping off at or above 90°, with occurrences ranging from the 4th to the 30th. The first bout of 90°s began with highs of 91° at Lower Alloways Creek Township and Piney Hollow (Gloucester) on the 4th, with four stations at 90°. Berkeley Township and Woodland Township (Burlington) reached 94° on the 5th, with 43 of the 70 NJWxNet stations from 90°–93°. Berkeley Township, Woodland Township, and East Brunswick (Middlesex) hit 93° on the 6th, with 31 stations 90°–92°. Five stations reached 90° on the 7th.
The 11th proved to be the hottest June day this year with Woodland Township up to 99°, Berkeley Township 98°, 28 stations from 95°–97°, and 35 from 90°–94° (Figure 6). Fortescue (Cumberland) had the lowest maximum of 84°. The 12th found four stations up to 96°, 18 at 95°, and 37 from 90°–94°. This time it was High Point Monument (Sussex) that was coolest with a maximum of 84°. The mid-afternoon heat index (HI) on the 12th demonstrated the discomfort from the combined heat and humidity during this hot episode. HI readings were in the 100°–108° range throughout most of NJ, the exceptions being the northwest and immediate coast (Figure 7). Hammonton (Atlantic) reached 91° on the 13th with ten stations at 90°. Berkeley Township was again warmest at 94° on the 14th when 34 stations rose to 90°–93°.
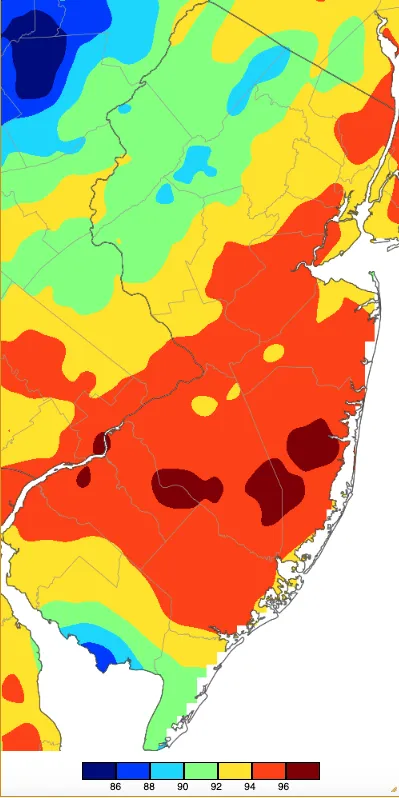
Figure 6. Maximum temperatures on June 11th based on a PRISM (Oregon State University) analysis generated using NWS, NJWxNet, and other professional weather stations.
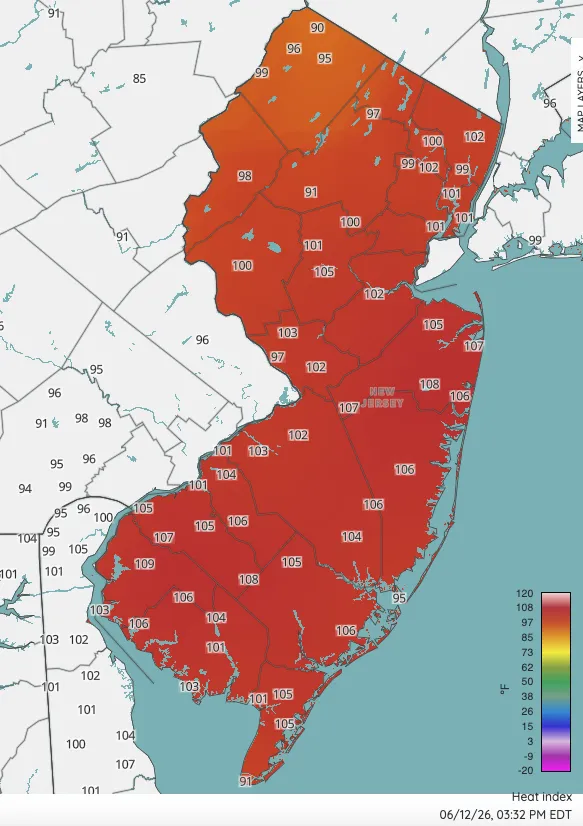
Figure 7. Heat index at 3:30 PM on June 12th based on NJWxNet, NWS, and DEOS professional weather stations.
Excessive warmth returned on the 18th, with Berkeley Township up to 95° and 40 stations from 90°–94°. Next up was the 92° high at Piney Hollow on the 22nd, when Mannington (Salem) and Sewell (Gloucester) were both 90°. Northwest Jersey was much cooler on the 22nd, with the high reaching just 64° at both Sandyston and Wantage. Cape May Court House (Cape May) rose to 90° on the 26th. Piney Hollow made it to 93° on the 29th, with eleven sites from 90°–92°. Again, it was Piney Hollow on top on the 30th at 94°, with 25 stations 90° or 91°.
First Half of 2026 Overview
This report’s theme of “That’s All Folks” certainly applies to the minimal statewide precipitation total for the first half of 2026. The statewide average of 15.14” is 7.16” below the 1991–2020 normal, which is just 68% of normal. This ties with 1995 as the 3rd driest first six months, with only 1965 and 1963 drier (Table 2). Every month in the first half of 2026 had below-normal precipitation, with the last above-average month occurring back in July 2025. To again state what was said earlier, 23 of the past 26 months have seen below-normal precipitation.
| Rank | Years | January–June Precip. | |
| 1 | 1965 | 14.73” | |
| 2 | 1963 | 15.06” | |
| 3 | 2026 | 15.14” | |
| 3 | 1995 | 15.14" | |
| 5 | 1985 | 15.75" | |
| 6 | 1927 | 15.97" | |
| 7 | 1954 | 15.98" | |
| 8 | 1957 | 16.14" | |
| 9 | 1955 | 16.31" | |
| 10 | 1926 | 16.55" |
Table 2. The 10 driest January–June periods since 1895.
As was the case the first half of 2025, totals were greatest in the Highlands and driest in parts of the south, as well as a few central Jersey locations. Coming in with the most precipitation was West Milford Township (Passaic) with 26.30”, followed by Mine Hill Township (Morris) 24.63”, Mount Arlington (Morris) 23.82”, Jefferson Township (Morris) 23.59”, and two Oakland (Bergen) stations with 22.18” and 21.81”. Galloway Township (Atlantic) was driest at 15.16”, followed by Hamilton Township (Atlantic) 15.36”, Manville (Somerset) 15.42”, Ocean City (Cape May) 15.58”, two Franklin Township (Somerset) stations with 15.65” and 15.74”, and Upper Deerfield Township (Cumberland) 15.74”.
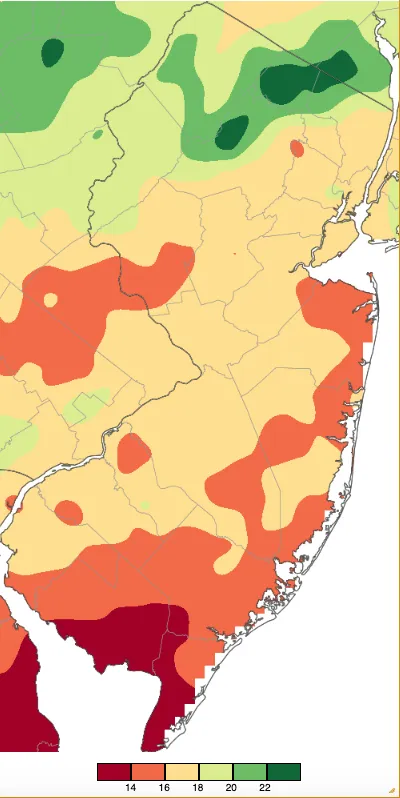
Figure 8. January–June 2026 precipitation across New Jersey based on a PRISM (Oregon State University) analysis generated using NWS Cooperative, CoCoRaHS, NJWxNet, and other professional weather station observations from 7 AM on December 31st to 8 AM on June 30th. Note the scale in full inches at the bottom of the map. Totals range from 12.00”–13.99” (dark red) to 22.00”–23.99” (dark green).
The first six months averaged 48.3°, which is exactly the 1991–2020 normal and ranks as the 26th warmest on record. The mean maximum temperatures across the state for the first half of the year were mildest, close to 60°, in the interior south (Figure 9). They ranged downward to the low 50°s in higher northwest locations. Mean lows for the six months were mildest in coastal and urban locations, generally in the low 40°s (Figure 10). They ranged downward from south to north in the interior, dipping to the mid 30°s in the northwest, regardless of elevation.
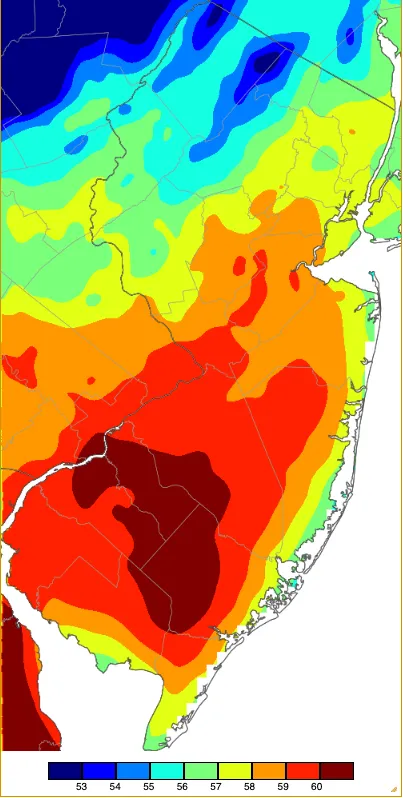
Figure 9. Mean maximum temperatures for the first half of 2026 based on a PRISM (Oregon State University) analysis generated using NWS, NJWxNet, and other professional weather stations.
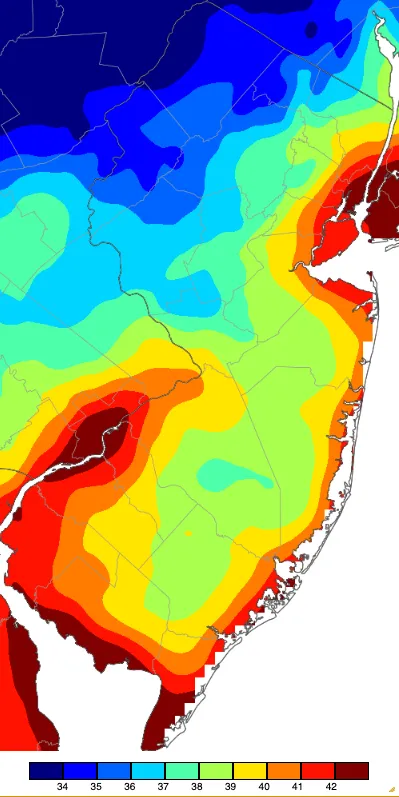
Figure 10. Mean minimum temperatures for the first half of 2026 based on a PRISM (Oregon State University) analysis generated using NWS, NJWxNet, and other professional weather stations.
Interested in receiving our monthly summaries at the end of each month? Send us your e-mail address here to join the mailing list.